You still probably don't know what happened
The Fed cut rates by 0.5%, then the $TLT and other bonds like $IEF $SHY saw their yields go UP by over 0.5%
This divergence against the $SPY $SPX, especially to $IWM can't be good
Here's how to play this
A 🧵☕️
The Fed cut rates by 0.5%, then the $TLT and other bonds like $IEF $SHY saw their yields go UP by over 0.5%
This divergence against the $SPY $SPX, especially to $IWM can't be good
Here's how to play this
A 🧵☕️
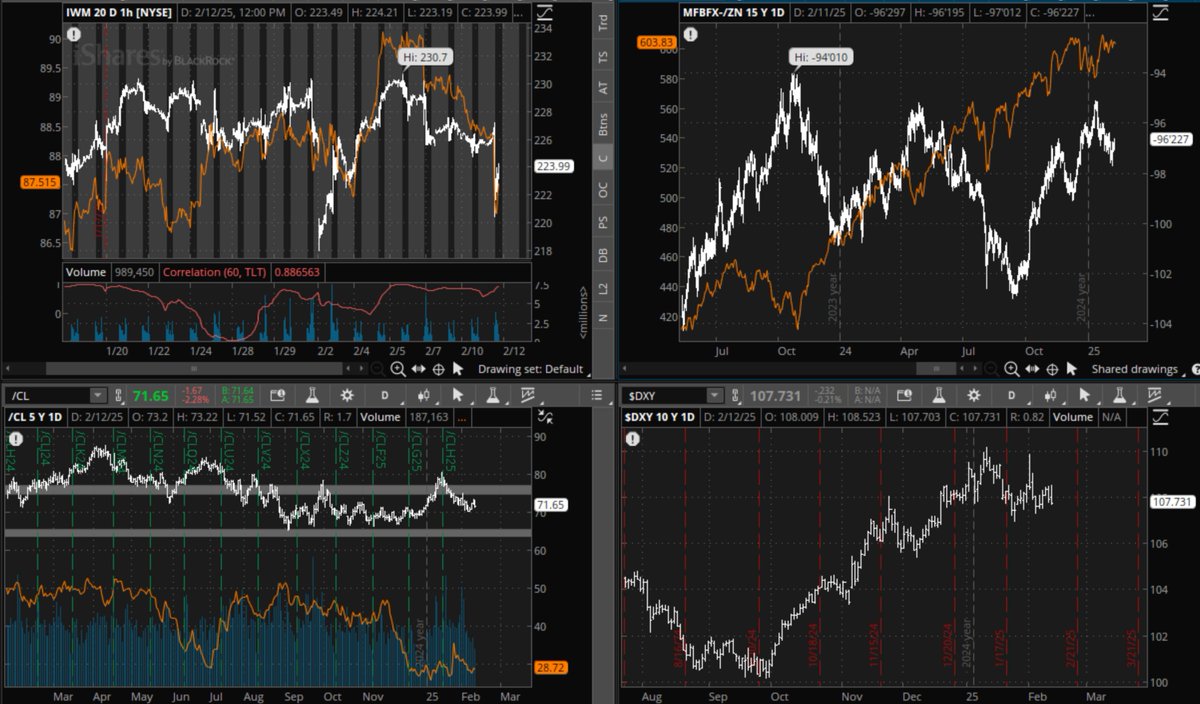
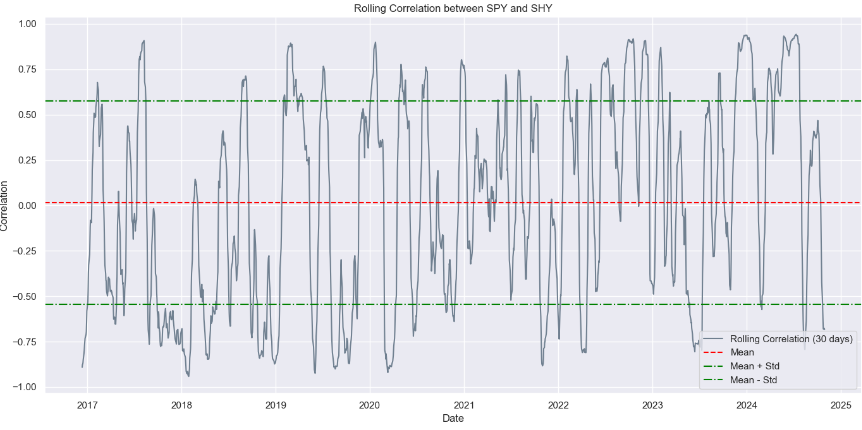
1. Typically, bond prices and stock prices are positively correlated
You can see the below rolling correlation between the $SPY and $SHY, which has been at 75% historically
Correlations breaking down on a long-term basis typically precede a stock market selloff on fundamentals
You can see the below rolling correlation between the $SPY and $SHY, which has been at 75% historically
Correlations breaking down on a long-term basis typically precede a stock market selloff on fundamentals
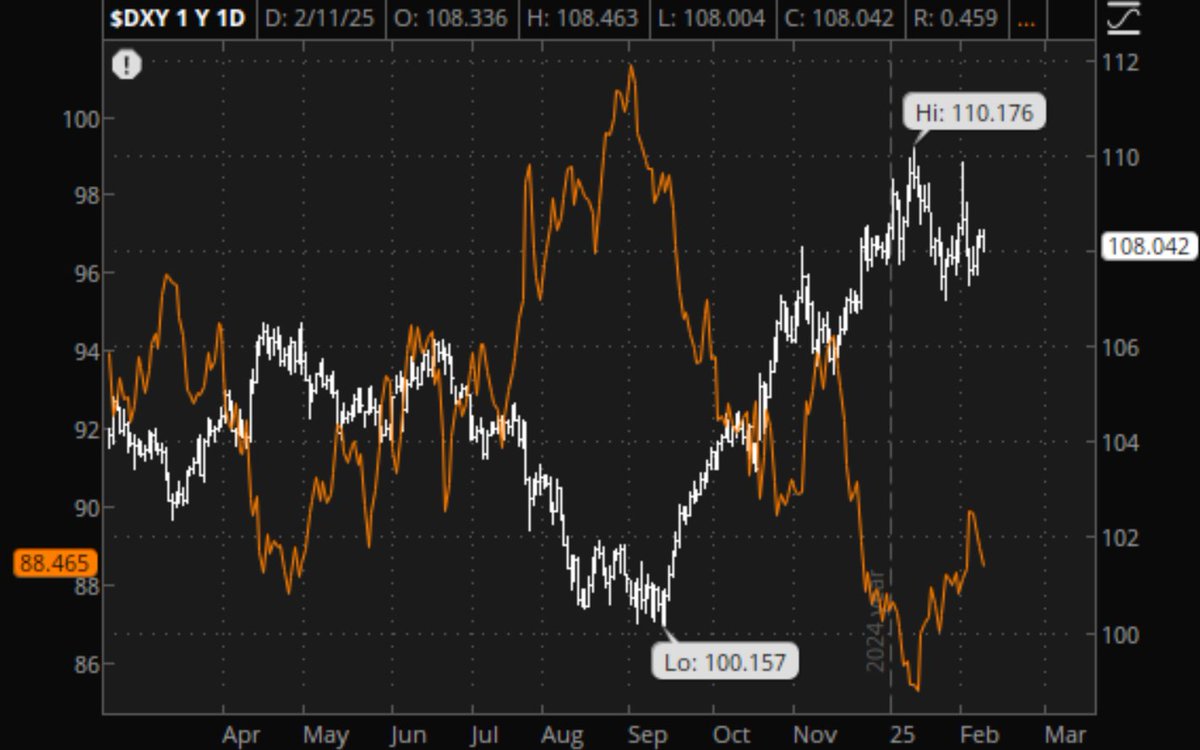
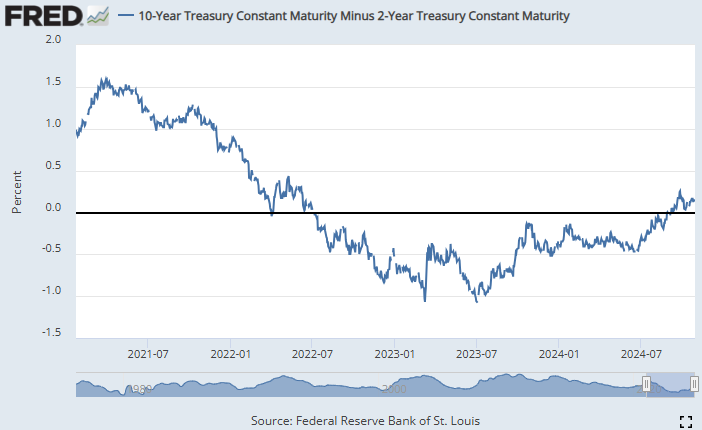
2. But, it's not going to be just one set of bonds, like the $SHY, to consider against the $SPY $SPX
You have to look at the yield curve itself, which considers long-term bonds like $IEF or $TLT against short term bonds
This is a great economic cycle gauge, here it is:
You have to look at the yield curve itself, which considers long-term bonds like $IEF or $TLT against short term bonds
This is a great economic cycle gauge, here it is:
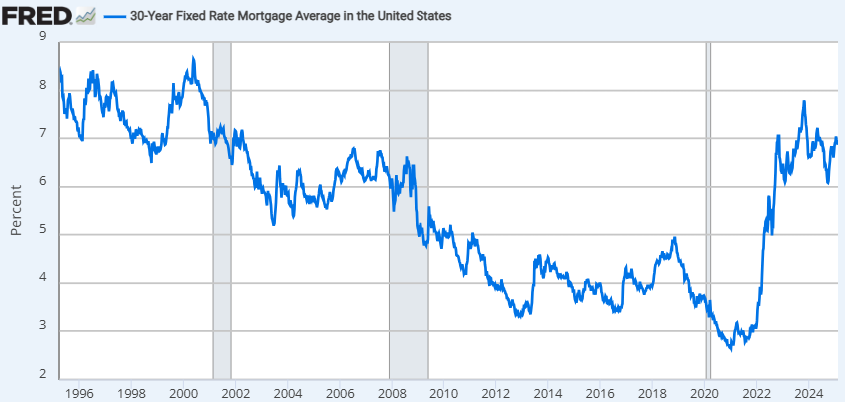
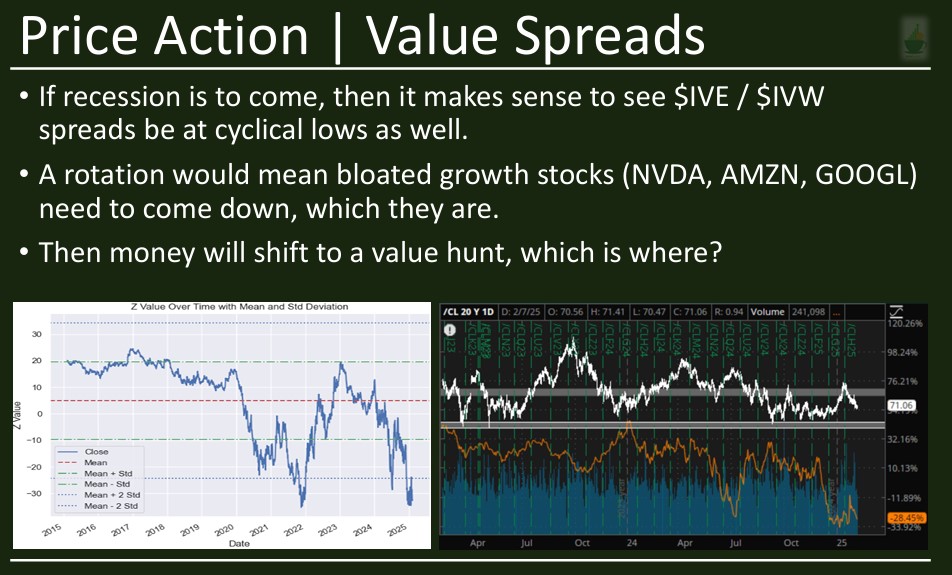
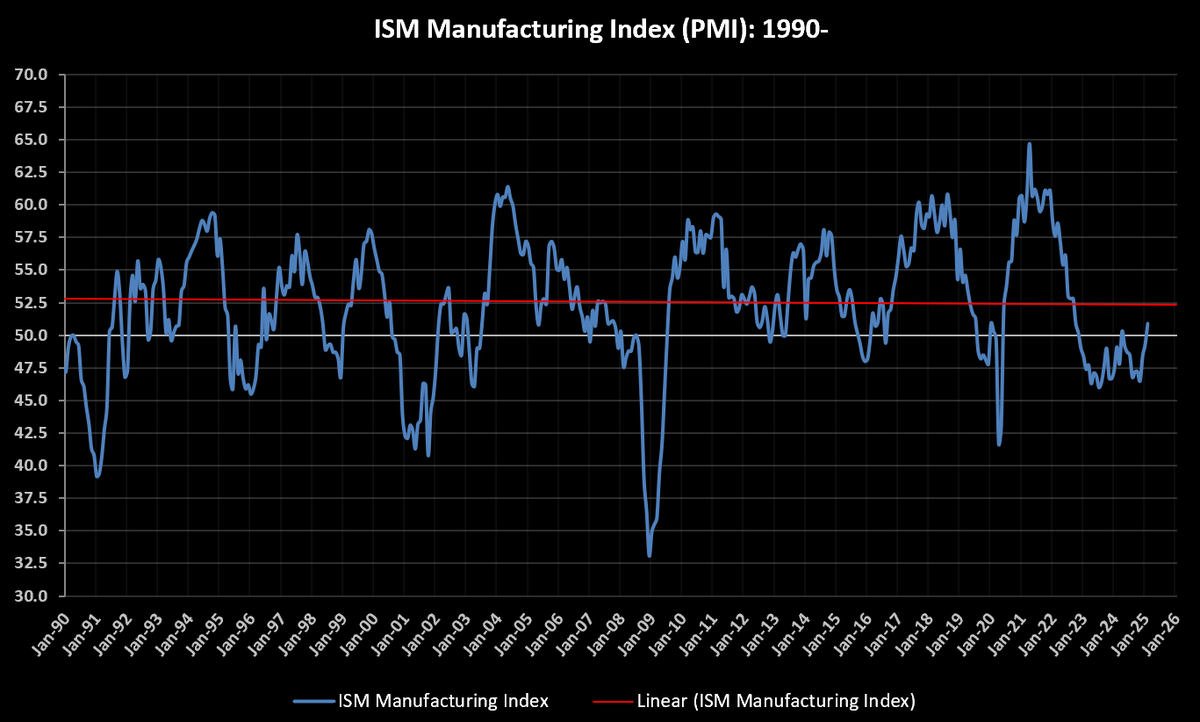
3. Whenever the yield curve comes down, you can be sure that some sort of liquidity boost / money printing will take place
This is the leveraging cycle of an economy, as we saw since the days of COVID-19
Now, the opposite is happening as the curve steepens...
This is the leveraging cycle of an economy, as we saw since the days of COVID-19
Now, the opposite is happening as the curve steepens...
4. But, what does it mean really?
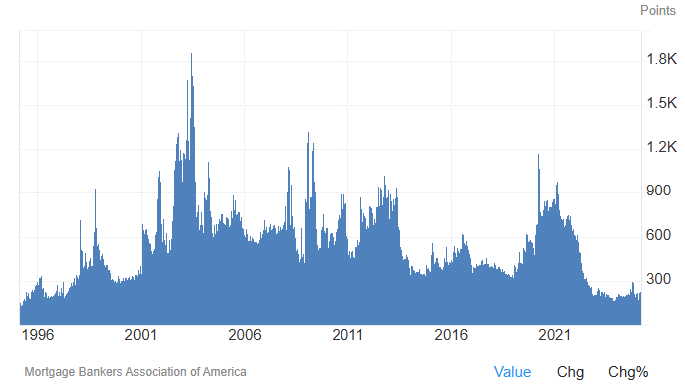
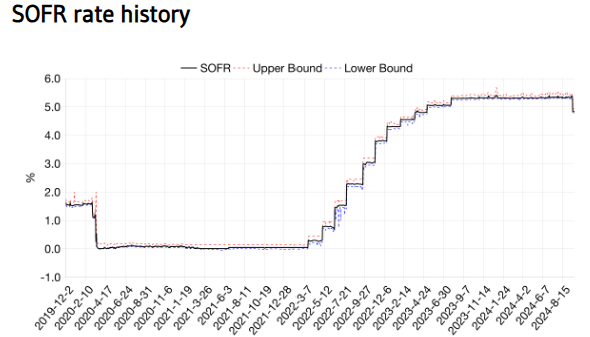
First of all, it means money is being taken out of the market, you can see banks reacting to this by raising SOFR rates and tightening money flows
Even through a cut cycle, liquidity can dry up very quickly such as right now
What can you do?
First of all, it means money is being taken out of the market, you can see banks reacting to this by raising SOFR rates and tightening money flows
Even through a cut cycle, liquidity can dry up very quickly such as right now
What can you do?
5. It means you can place a bet on the yield curve steepening, which can pay you for at least 12 months on a relatively stress-free basis
How?
Steepening = 10-year yields rising faster than 2-year yields
So, buy 2-years in $SHY ETF, short 10-years in $IEF ETF
Boom ☕️
How?
Steepening = 10-year yields rising faster than 2-year yields
So, buy 2-years in $SHY ETF, short 10-years in $IEF ETF
Boom ☕️
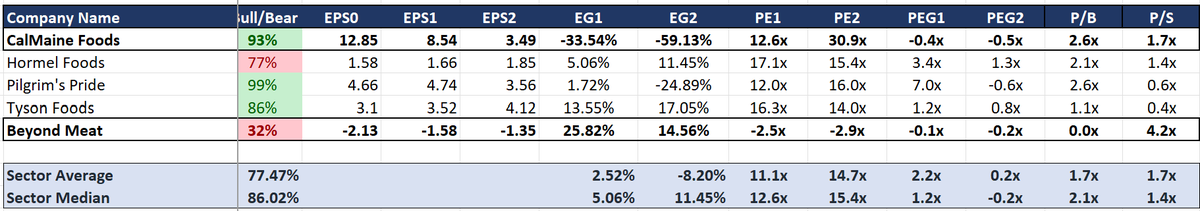
6. What about stocks?
Most people are betting against the $SPY $SPX, which absolutely makes sense
But
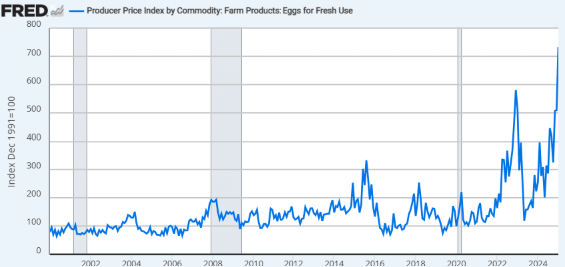
I think if inflation does hit us in the head, it'll be the $IWM that will see the worst of it
Small-caps have pure domestic exposure, so they can't manage costs as easy 📉
Most people are betting against the $SPY $SPX, which absolutely makes sense
But
I think if inflation does hit us in the head, it'll be the $IWM that will see the worst of it
Small-caps have pure domestic exposure, so they can't manage costs as easy 📉

@threadreaderapp unroll
• • •
Missing some Tweet in this thread? You can try to
force a refresh