Dave Jones Profile picture
Oct 30 5 tweets 3 min read Read on X
This graphic is going viral.

This is how it was calculated... let's get geeky🤓... Image
It's based on this table in today's IEA report.

Solar is x100 coal because...
- SOLAR: 2GW x 17% utilisation x 40 years = 120TWh
- COAL: 150kt x 8MWh/t = 1.2TWh (note this *energy* content of coal; you'd need x300 as many ships for the same *electricity* content as a ship of solar panels)

Notes on solar:
- The "40 years" and "17% utilisation" is what i've used to backcalculate their x100 calculation and show they are reasonable calculations.
- A container ship is assumed as 15000TEU, far short of the largest container ship at 25000TEU.
- 2GW across 15,000TEU means there's 133KW of solar panels in a container. Useful to know:)

iea.blob.core.windows.net/assets/48d2ba3…Image
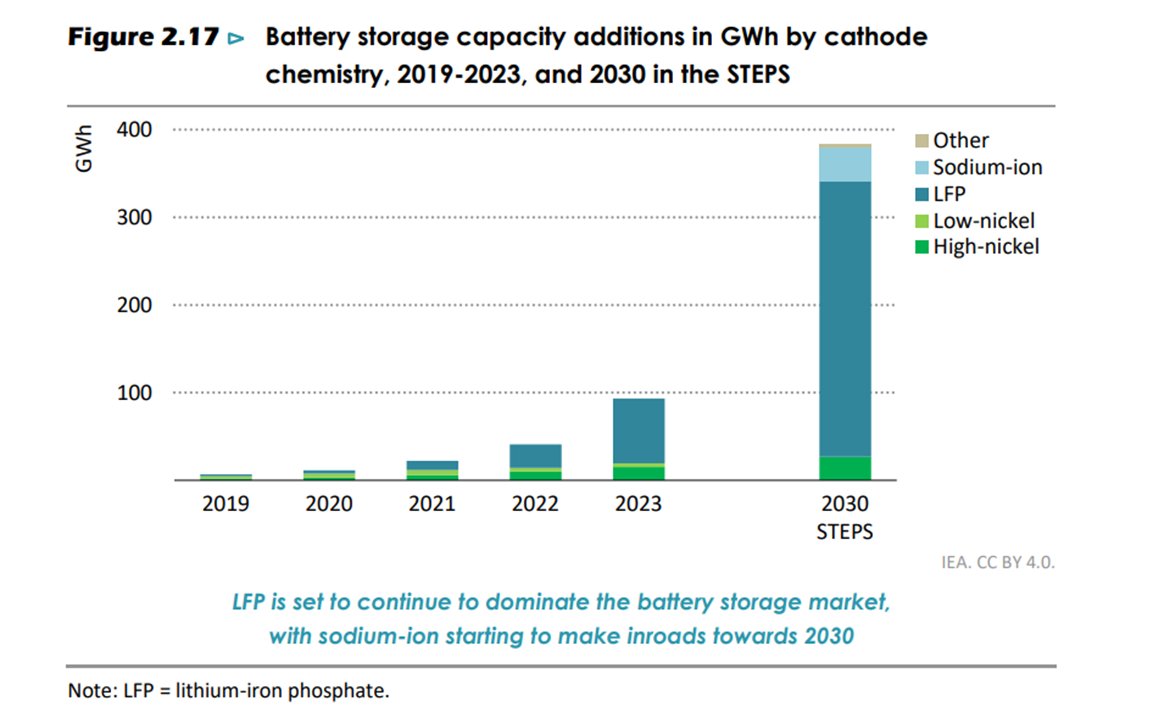
Interestingly, battery takes up even less room...

If container ship has 2GW, then for 4 hours of storage, you need 8GWh of battery - which is less than a third of a container ship... Image
The reason why it's proving popular? It's hot off the heels of this great tweet which I'm sure you've seen countless times over the last month... Image
To put it another way...

You'd need one ship of coal *every 7 weeks* to make the same electricity coming from one ship of solar panels

And this is the scale: from @vecteezy vecteezy.com/video/48419321…

• • •

Missing some Tweet in this thread? You can try to force a refresh
 

Keep Current with Dave Jones

Dave Jones Profile picture

Stay in touch and get notified when new unrolls are available from this author!

Read all threads

This Thread may be Removed Anytime!

PDF

Twitter may remove this content at anytime! Save it as PDF for later use!

Try unrolling a thread yourself!

how to unroll video
  1. Follow @ThreadReaderApp to mention us!

  2. From a Twitter thread mention us with a keyword "unroll"
@threadreaderapp unroll

Practice here first or read more on our help page!

More from @CleanPowerDave

Oct 16
The IEA's #1 flagship report, and the bible of the energy transition.

So, what's new? My key takeaways...
We are firmly in the Age of Electricity💪 Image
Electricity demand has been revised up.

Previously, it was 2.7%/year to 2030 (the same as for 2010-2023), now it's 3.3%/year.

And demand growth is coming from EVERYWHERE - yes data centres + a/c, but also EV's+heat pumps, and industry is actually the biggest slice... Image
Read 13 tweets
Sep 19
NEW: The rise of global solar this year was significantly underestimated. AGAIN.

Of the 6 major forecasters out there, all of them have been scrambling to update their forecasts through this year.. Image
We forecast 2024 solar additions will be 593GW, a rise of 29%.

At this point in the year, there is enough data whereby uncertainty is now relatively small. (BTW, this was a MAJOR undertaking for us🫣) Image
Even at the start of 2024, the IEA, WoodMac, Rystad and (initially) S&P Platts forecasted that there would be LESS solar installed in 2024 than was actually installed in 2023 🤷‍♂️

(in part because they underestimated 2023 itself, rather than explicitly forecasting a y-o-y fall) Image
Read 12 tweets
Jul 3
Q: Why have batteries become so cheap?
A: Because many no longer need expensive minerals.

The rise of the LFP battery means 40% of all EV batteries globally (higher in China), do not contain any nickel or cobalt… Image
..and less minerals means lower CO2 footprint. About 30% lower last year, than nickel batteries.... Image
The downside is LFP is 20-30% less energy-dense.

That makes it even more suitable for grid batteries. So where 40% of use LFP, 80%(!) of grid batteries already use LFP. Image
Read 6 tweets
Jun 21
Only 33% of EU's electricity was from fossil in 2023.

However, that hides that hour-by-hour, it ranged from 15% to 50%.

To get to 0% fossil, we need 0% in EVERY HOUR.

Here's a long thread on flexibility 🧵 Image
Let's start with seasonal flexibility, all the way through to millisecond flexibility..
The EU doesn't need a lot of seasonal flexibility. Wind delivers more in winter, complementing solar in summer. Even the swings by month are not huge.

Yes, this will get bigger as the EU electrifies heat, and winter demand grows - so it's a great job that EU is still building sooo much wind, even as solar so often steals the headlines.Image
Read 20 tweets
May 8
The latest on the global electricity transition🧵

Wind and solar produced 13% of global electricity in 2023; renewables, in total, produced 30%.. Image
The rise in wind and solar has ALREADY slowed fossil generation growth from about 3%/year to 1%/year..

And 2023 fossil generation would have been 22% higher without wind and solar.. Image
..and more than half the countries in the world are ALREADY now at least 5 years past their "peak" power emissions. Image
Read 14 tweets
Apr 22
Today, the @IEA has started tracking progress of all 10 things that every country in the world committed to at @COP28_UAE.

You can't say there's no ambition!?... 🧵
#DecadeofImplementation Image
Image
(obviously the weird sarcastic remarks are me, not the IEA, duh! Please don't take them seriously!)
Read 13 tweets

Did Thread Reader help you today?

Support us! We are indie developers!


This site is made by just two indie developers on a laptop doing marketing, support and development! Read more about the story.

Become a Premium Member ($3/month or $30/year) and get exclusive features!

Become Premium

Don't want to be a Premium member but still want to support us?

Make a small donation by buying us coffee ($5) or help with server cost ($10)

Donate via Paypal

Or Donate anonymously using crypto!

Ethereum

0xfe58350B80634f60Fa6Dc149a72b4DFbc17D341E copy

Bitcoin

3ATGMxNzCUFzxpMCHL5sWSt4DVtS8UqXpi copy

Thank you for your support!

Follow Us!

:(