We @electriccapital analyzed 110k+ developer profiles to understand crypto devs geographically.
Asia is now #1 for crypto devs. The US is losing market share.
Crypto impacts every state in the US -- crypto should be non-partisan.
Here’s what the data shows & why it matters:
Asia is now #1 for crypto devs. The US is losing market share.
Crypto impacts every state in the US -- crypto should be non-partisan.
Here’s what the data shows & why it matters:

North America lost its lead in crypto developer share to Asia.
North America’s share of devs dropped sharply—from 44% in 2015 to just 24% in 2024.
Meanwhile, Asia’s share climbed from 13% to 32%.
For the first time, Asia is the #1 continent for crypto talent.
North America’s share of devs dropped sharply—from 44% in 2015 to just 24% in 2024.
Meanwhile, Asia’s share climbed from 13% to 32%.
For the first time, Asia is the #1 continent for crypto talent.

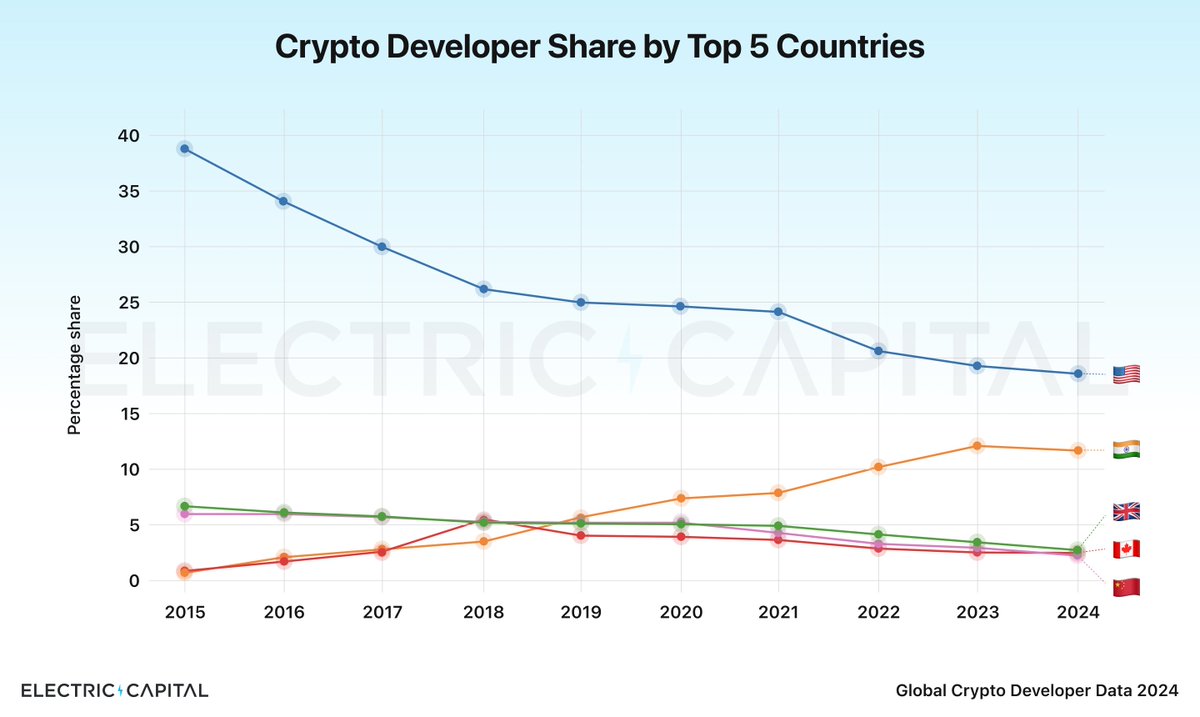
The US remains #1 in crypto devs by country.
% of crypto devs by country:
#1 🇺🇸 US: 18.8%
#2 🇮🇳 India: 11.8%
#3 🇬🇧 UK: 4.2%
81% of crypto devs live outside the US shaping the future of digital money.
This is a national security issue & innovation drain for the US.
% of crypto devs by country:
#1 🇺🇸 US: 18.8%
#2 🇮🇳 India: 11.8%
#3 🇬🇧 UK: 4.2%
81% of crypto devs live outside the US shaping the future of digital money.
This is a national security issue & innovation drain for the US.

The US had a 51% drop in dev share since 2015 - while crypto grew from $5B to $2.4T in market size!
Is this the result of negative regulatory environment? The US needs clear crypto policy to maintain its country lead.
Zooming in to the US: How does this break down by US state?
Is this the result of negative regulatory environment? The US needs clear crypto policy to maintain its country lead.
Zooming in to the US: How does this break down by US state?
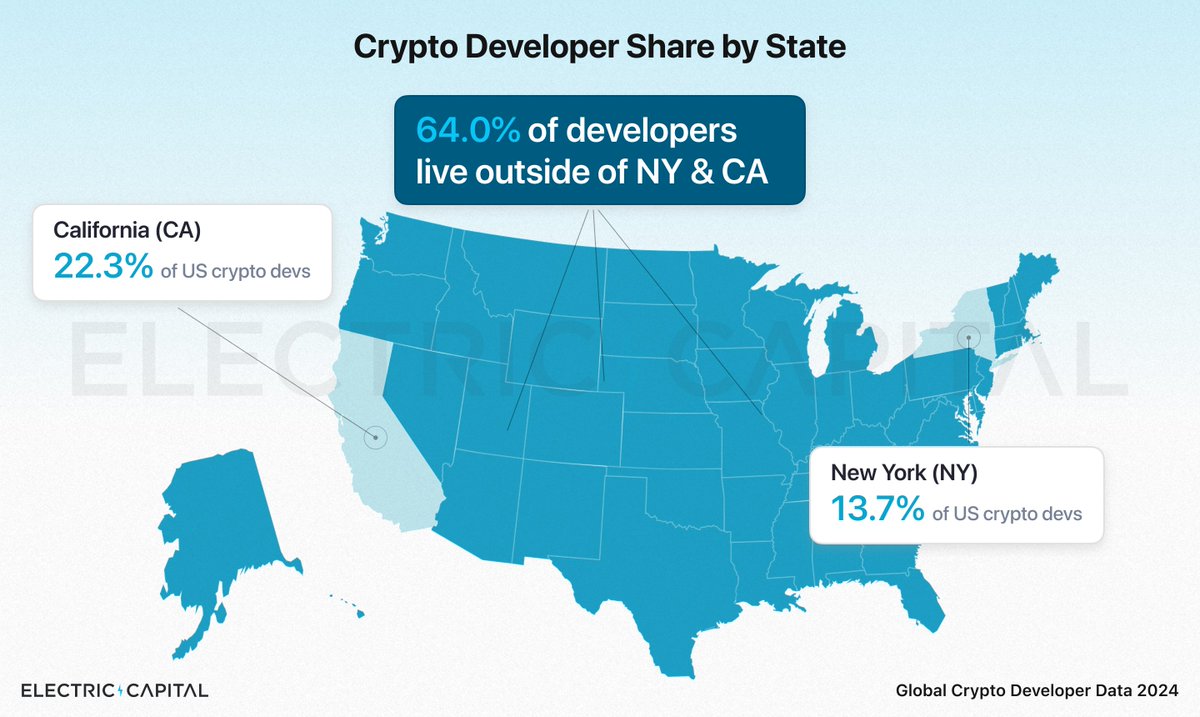
Crypto thinks of itself as CA & NY based - but 64% of devs live outside of these traditional tech hubs!
This is an opportunity for job & wealth creation for policymakers.
Crypto should not be partisan -- devs live in every state, representing all political backgrounds.
This is an opportunity for job & wealth creation for policymakers.
Crypto should not be partisan -- devs live in every state, representing all political backgrounds.
Methodology: We analyze 200M+ crypto related git commits across 350K+ repos. Geo data is from 110K devs w/ self-reported locations, out of 366K crypto devs since 2009.
Geo data & more will be in our upcoming 2024 Developer Report!
Add to our taxonomy:
github.com/electric-capit…
Geo data & more will be in our upcoming 2024 Developer Report!
Add to our taxonomy:
github.com/electric-capit…
Producing this analysis is a ton of work! Credit to @n4motto for this original geography analysis.
It takes a team to put this together:
@n4motto on analysis
@mishafrolov on design
@jubos on data pipeline
@scinocco_a on eng
@avichal, @martha, @EmilyMMeyers for analysis ideas
It takes a team to put this together:
@n4motto on analysis
@mishafrolov on design
@jubos on data pipeline
@scinocco_a on eng
@avichal, @martha, @EmilyMMeyers for analysis ideas
Thank you @martha_shear for the many reads and feedback.
Apologies for the wrong tag -- this is what happens when I don't have your eyes on a tweet.
Apologies for the wrong tag -- this is what happens when I don't have your eyes on a tweet.
• • •
Missing some Tweet in this thread? You can try to
force a refresh