Lately @NateSilver has been arguing that pollsters are "herding" —tweaking or hiding their results to avoid publishing outliers.
I don't know any (reputable) pollsters who do this.
And I think the problem here is Nate making a simple math/stats error 🧵
I don't know any (reputable) pollsters who do this.
And I think the problem here is Nate making a simple math/stats error 🧵

Let's explore binomial distributions and the standard errors of weighted samples.
TL, DR: Weighting across groups with different voting patterns should change how you calculate confidence intervals.
Fail to do so, and you'll falsely accuse pollsters of herding.
TL, DR: Weighting across groups with different voting patterns should change how you calculate confidence intervals.
Fail to do so, and you'll falsely accuse pollsters of herding.
First, what @NateSilver538 does:
In a “vanilla” poll—a simple random sample—the standard error of an estimate of a candidate’s vote share, p, in a two horse race is √[p(1-p)/n].
This is the perspective that animates Nate's analysis of "herding".
In a “vanilla” poll—a simple random sample—the standard error of an estimate of a candidate’s vote share, p, in a two horse race is √[p(1-p)/n].
This is the perspective that animates Nate's analysis of "herding".

Two simplifications (actually, approximations) will simplify the math:
1. In a close race p≈0.5, so the standard error = √[p(1-p)/n] ≈ 0.5 /√n
2. The standard error of the winning margin in a two-horse race is roughly double this ≈ 1/√n.
1. In a close race p≈0.5, so the standard error = √[p(1-p)/n] ≈ 0.5 /√n
2. The standard error of the winning margin in a two-horse race is roughly double this ≈ 1/√n.

But here's the key issue. Most samples use weights. And that can change everything.
In a weighted sample, the standard error is the square root of the sum of the weighted variances of each individual respondent's binary vote. (And the se of the winning margin is double that.)
In a weighted sample, the standard error is the square root of the sum of the weighted variances of each individual respondent's binary vote. (And the se of the winning margin is double that.)
In a moment I'll show my work.
But for now, my point is that by ignoring weighting in modern polls, Nate overstates the extent of sampling error (and hence the margin of error).
In many polls, he overstates by a factor of TWO OR MORE.
But for now, my point is that by ignoring weighting in modern polls, Nate overstates the extent of sampling error (and hence the margin of error).
In many polls, he overstates by a factor of TWO OR MORE.
Lemme explain the logic of weighted samples and their sampling error, in English.
Say there's a street where 95% of folks on the left side of the street vote Democratic, and 95% of folks on the other side of street vote Republican.
Say there's a street where 95% of folks on the left side of the street vote Democratic, and 95% of folks on the other side of street vote Republican.

A pollster will poll both sides of the street, and weight to ensure both are represented.
They effectively have two separate independent samples
The standard error from a poll of n/2 folks from the left is √[(.95x.05)/(n/2)] ≈ 0.31/√n
Ditto for the other side of the street
They effectively have two separate independent samples
The standard error from a poll of n/2 folks from the left is √[(.95x.05)/(n/2)] ≈ 0.31/√n
Ditto for the other side of the street
Notice that in this setting, if you accidentally polled too many people from one side of the street, that could really distort your findings.
But weighting solves this problem for you!
Point is, in this example, it's really important that you weight your sample.
But weighting solves this problem for you!
Point is, in this example, it's really important that you weight your sample.
The weighted poll's topline gives equal weight to both samples, and hence has a standard error equal to the square root of the sum of the squared SE's
= √ [(0.5* SE_left)^2+0.5*SE_right^2]
≈ 0.22/√n
Double this to get the standard error of the winning margin ≈ 0.44/√n
= √ [(0.5* SE_left)^2+0.5*SE_right^2]
≈ 0.22/√n
Double this to get the standard error of the winning margin ≈ 0.44/√n
Now compare: If you ignore the weighting and use the vanilla formula, you get 1/√n (see above).
But in reality, the true standard error is 0.44/√n.
In this example, ignoring weighting leads Nate to estimate a standard error that is ***2.3x the truth***
[2.3 is simply 1/0.44]
But in reality, the true standard error is 0.44/√n.
In this example, ignoring weighting leads Nate to estimate a standard error that is ***2.3x the truth***
[2.3 is simply 1/0.44]
Here's the payoff.
Our hypothetical street is in fact a sampling reality. Think of the left side of the street as Biden 2020 voters, and the right side as Trump 2020 voters.
Roughly 95% of past Trump voters will vote for him again, and 95% of Biden voters will vote for Harris.
Our hypothetical street is in fact a sampling reality. Think of the left side of the street as Biden 2020 voters, and the right side as Trump 2020 voters.
Roughly 95% of past Trump voters will vote for him again, and 95% of Biden voters will vote for Harris.

And so for pollsters who weight by recalled vote -- which @Nate_Cohn recently estimated to be around two-thirds of recent polls -- the naive estimate of the "margin of error" that @NateSilver relies on is about 2.3x the reality.

Point is, @NateSilver dramatically over-estimates the margin of error of many modern polls.
His estimates are more than two times as wide as they should be.
And that's why he finds so few "outlier" polls *relative to what the tails of his naive distribution tell him to expect*
His estimates are more than two times as wide as they should be.
And that's why he finds so few "outlier" polls *relative to what the tails of his naive distribution tell him to expect*

Now, @NateSilver538's key finding is that 80% of polls report a margin <2.5 points, which he says is way too few.
Recall that 2-in-3 polls weight by recalled vote, and a 1-in-3 don't.
Thus, I would (roughly!) expect: (2/3)x90% + (1/3)x52% = 77%. That's AWFULLY CLOSE to 80%.
Recall that 2-in-3 polls weight by recalled vote, and a 1-in-3 don't.
Thus, I would (roughly!) expect: (2/3)x90% + (1/3)x52% = 77%. That's AWFULLY CLOSE to 80%.

Point is, finding that 80% of polls yield winning margins within 2.5 percentage points is pretty darn close to what you would expect if:
a) Many pollsters are weighting by recalled vote, and
b) NONE OF THE POLLSTERS ARE HERDING.
a) Many pollsters are weighting by recalled vote, and
b) NONE OF THE POLLSTERS ARE HERDING.
The pollsters aren't doing anything dishonest here. They're simply using sampling theory (weighting) to get more precise estimates.
My math simply shows that by making sure not to over-sample one side of the street, they're getting more reliable estimates. (More on this below)
My math simply shows that by making sure not to over-sample one side of the street, they're getting more reliable estimates. (More on this below)
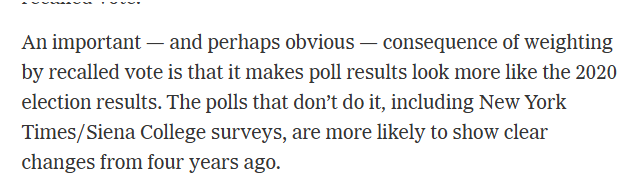
If you want more intuition, I’ll lean on @Nate_Cohn, who points out that that weighting on recalled vote leads poll results to look more like the past election.
He gets this mostly right, but what he really means, is that it minimizes the variance due to sampling error.
He gets this mostly right, but what he really means, is that it minimizes the variance due to sampling error.
Remember, pollsters want less sampling variation. That's why weighting by recalled vote – if recall is accurate – is a fantastic idea.
Aside: @Nate_Cohn argues that recall is often inaccurate, and he's somewhat opposed to using it. I'm not convinced (yet)
nytimes.com/2024/10/06/ups…
Aside: @Nate_Cohn argues that recall is often inaccurate, and he's somewhat opposed to using it. I'm not convinced (yet)
nytimes.com/2024/10/06/ups…
Now not all pollsters weight by recalled vote.
But they still still weight by a bunch of factors–age, race, gender, etc that are collectively very predictive.
But they still still weight by a bunch of factors–age, race, gender, etc that are collectively very predictive.
These "demographic weights" are similar to the earlier case, but perhaps the analogy is that 75% of people on one side of the street vote D, with a mirror image on the other side.
In this eg, the naive formula would overstate the margin of error by ≈ √(.5*.5)/√(.75*.25) =1.15
In this eg, the naive formula would overstate the margin of error by ≈ √(.5*.5)/√(.75*.25) =1.15
This is a much smaller bias, but it's enough to exactly match @NateSilver's fact that 80% of polls are within 2.5 points.
Here's why: Demographically-weighted polls yield "close results" p(|poll lead|<2.5) =58% of the time.
[In math: 1-2xNORMSDIST(-.025*1.15*√(n=800)) =58%]
Here's why: Demographically-weighted polls yield "close results" p(|poll lead|<2.5) =58% of the time.
[In math: 1-2xNORMSDIST(-.025*1.15*√(n=800)) =58%]
So "demographically weighted" polls yield "close results" 58% of the time, and recall-weighted polls yield "close results" 90% of the time (see above).
If 1-in-3 polls are the former, and 2-in-3 are the latter,y ou'll get "close results" .33*58%+.67*90%
= 79%(!) of the time.
If 1-in-3 polls are the former, and 2-in-3 are the latter,y ou'll get "close results" .33*58%+.67*90%
= 79%(!) of the time.

And so pollsters who aren’t cheating, or tweaking, or file-drawering, or in any way herding, will often get estimates that are (substantially!) less extreme than naïve application of the binomial formula would lead you to expect.
Implication: @NateSilver's complaint that they’re herding arises because he (mistakenly) expects the variation from weighted polls to match that from formulae that were developed for unweighted poll.
A couple of qualifications, and then on to some more interesting implications.
I’m only focusing on sampling error, because that’s the issue that’s what @NateSilver uses to diagnose "herding".
There are many many other sources of error: Voter recall could be imperfect; we don't know who will turn out; weights are estimates, sampling design, etc
There are many many other sources of error: Voter recall could be imperfect; we don't know who will turn out; weights are estimates, sampling design, etc
My math uses the approximation that we're looking at exactly even contests, and so √p(1-p)≈0.5
Of course none of these races are exactly even, but this approximation is really very good for any close race.
Of course none of these races are exactly even, but this approximation is really very good for any close race.

I also haven't messed around with any third party votes, but again, this is sufficiently small that the approximations I've used will get the main ideas across.
There's a lot here that's suggestive, but I haven't dotted every i or crossed every t.
I'm willing to say that *a lot* of what @NateSilver538 is calling "herding" is not herding.
Even so, some herding may still exist.
One would need to do more work than either of us have done.
I'm willing to say that *a lot* of what @NateSilver538 is calling "herding" is not herding.
Even so, some herding may still exist.
One would need to do more work than either of us have done.
Now, a few interesting implications...
Sampling error gets smaller when you're effectively sub-sampling smaller groups for whom √p(1-p) is far from 0.5. That occurs when p is close to zero or one.
The bias from naively using the binomial formula is only big when population groups are highly polarized. (Like today!)
The bias from naively using the binomial formula is only big when population groups are highly polarized. (Like today!)
This also suggests that weighting on recalled vote has greater merit in today's political environment when we all seem to be stuck in our political bubbles.
So I think this is well worth a lot more attention.
So I think this is well worth a lot more attention.
The weights in @NateSilver538's model *penalize* pollsters for *perceived* herding.
But if this apparent herding is actually the use of more sophisticated weights that reduce sampling error (which produces fewer outliers than Nate expects), this may perversely put less weight on BETTER pollsters.
But if this apparent herding is actually the use of more sophisticated weights that reduce sampling error (which produces fewer outliers than Nate expects), this may perversely put less weight on BETTER pollsters.

• • •
Missing some Tweet in this thread? You can try to
force a refresh