Ethereum's Roadmap is under fire.
But have we truly grasped the *economic* ripples that every proposal sets in motion?
Each pivot, upgrade, and idea impacts more than just the blockchain itself.
It shapes the experiences, challenges, and fortunes of:
1. Developers
2. Users
3. Validators
4. Service Providers
5. And Investors
That’s why I created a dashboard on @tokenterminal breaking it all down.
Past. Present. And Future.
A 🧵with some insights from the dashboard + a link at the end for those looking to go deeper 👇
Starting with EIP1559 in August of '21:
$12.4b has been “burned” or bought back since it’s implementation.
1/7

Shifting to ETH 2.0 and the move to Proof of Stake in Sept. '22:
Annual issuance dropped 88% overnight.
Impact on Validators:
1. Now compensated with tips from users (fees paid in excess of the base fee for block inclusion) + new issuance.
2. Compensation from new issuance was reduced by 88% overnight (from roughly 13.5k ETH/day to 1.7k ETH/day).
3. Overhead costs (energy) reduced by 99.9%.
4. Compensation from fees + new issuance is now determined by the validator's portion of ETH staked pro-rata to the amount of ETH staked on the network.
[see dashboard for impact on ETH holders]
2/7

Moving on to The Shapella Upgrade (staking withdrawals) in April of '23:
Validators increased 58% in the first 6 months post-Shapella.
Impact:
1. Validators: decrease in yield
2. Tokenholders: drop in yield can impact demand for ETH
3. Network security: more validators = more secure network.
4. Applications: @LidoFinance was the largest beneficiary.
3/7
Validators increased 58% in the first 6 months post-Shapella.
Impact:
1. Validators: decrease in yield
2. Tokenholders: drop in yield can impact demand for ETH
3. Network security: more validators = more secure network.
4. Applications: @LidoFinance was the largest beneficiary.
3/7

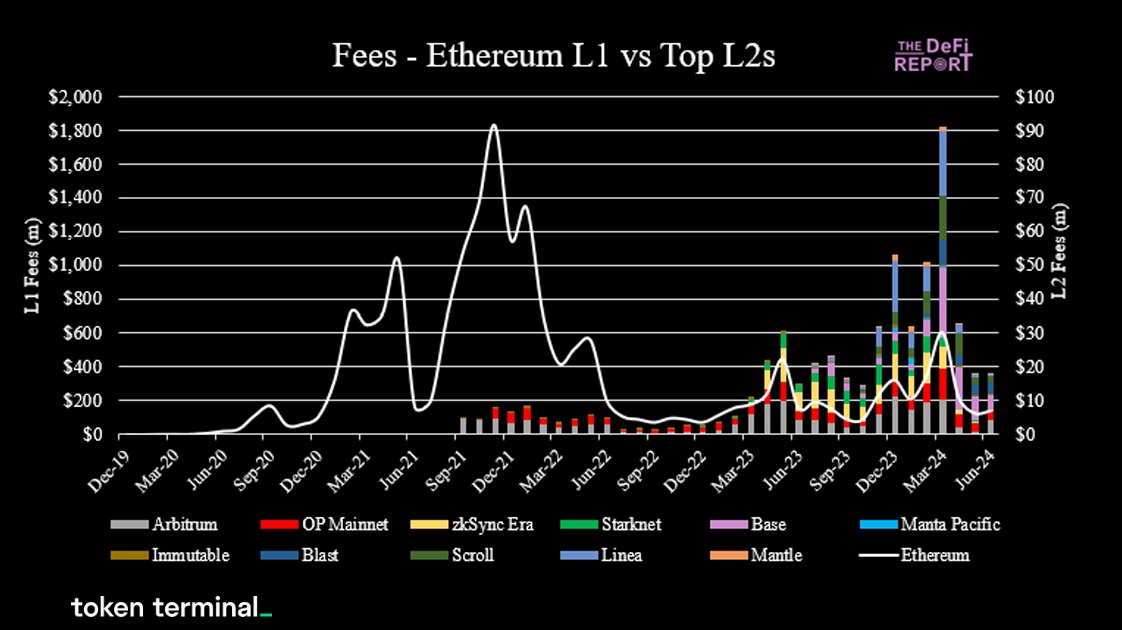
March '23 EIP4844: Introduction of “Blobs,” a new data structure that lowered costs for L2s.
Impact:
1. Users: reduced transaction fees on L2s an order of magnitude.
2. L1 Validators: the reduction in L2 fees has reduced the fees paid to L1 and the yield paid to validators/stakers.
3. L2 Sequencers: fees are down while transactions are up. Transaction volume will need to increase exponentially to backfill the loss in revenue from a lower avg. cost to transact.
4. Tokenholders: the reduction in fees at the L2 has also decreased fees at the L1 level, reducing burned ETH and yield paid to validators/stakers.
5. L2 Margins: increased from roughly 75% to 99%.
6.Applications/Developers: reducing costs on L2s can enable use cases that were previously not possible.
4/7

The result? Ethereum is scaling as designed.
90% of transactions within the ecosystem now come from L2.
5/7
90% of transactions within the ecosystem now come from L2.
5/7

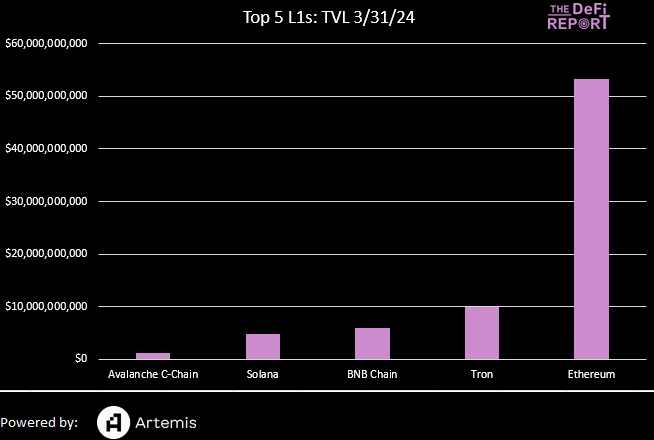
But the million-dollar question remains: Where will the most value accrue?
The market still values the L1 at 13x the combined valuation of the top L2s.
6/7
The market still values the L1 at 13x the combined valuation of the top L2s.
6/7

Want to go deeper and come to your own conclusions? 👇
Please tear it up and leave your comments below so that we can make it even better 🤝
7/7tokenterminal.com/terminal/studi…
Please tear it up and leave your comments below so that we can make it even better 🤝
7/7tokenterminal.com/terminal/studi…
• • •
Missing some Tweet in this thread? You can try to
force a refresh


