CUSUM is an algorithm for change-point detection. It's kind of magical. Here is a financial application, which is very important in itself, to showcase its magic.
A short informal 🧵, to be rewritten in a more formal technical note. Ready, let's go.
1/
A short informal 🧵, to be rewritten in a more formal technical note. Ready, let's go.
1/
Imagine you have a strategy a stream of daily (or, better, intraday) returns r[t].
One of the very basic problems in life is to know when your strategy's performance is degrading. Solving this can make or break you.
2/
One of the very basic problems in life is to know when your strategy's performance is degrading. Solving this can make or break you.
2/
Stop-loss policies, among many other things, intuitively serve also this purpose: to tell you that the strategy is not performing as it should. And they're so simple that even billionaires can understand them.
But is there a better way?
3/
But is there a better way?
3/
Say that the volatility sigma[t] of your returns is fixed and it is known. z-score your returns.
x[t] := r[t]/sigma[t]
*If* your returns are iid, then the expected value of x[t] is the sharpe ratio of your strategy.
4/
x[t] := r[t]/sigma[t]
*If* your returns are iid, then the expected value of x[t] is the sharpe ratio of your strategy.
4/
Let's rephrase the problem. I expect the sharpe of my strategy to be at least S_H (if your sharpe is 15 and you made $15m last year, stop reading. I don't care about you). And I have to worry if the sharpe of my strategy is less than S_L.
5/
5/
For example: S_H = 1.5/sqrt(251) ~ 0.01 (we are looking at daily sharpes) and S_L=0.
6/
6/
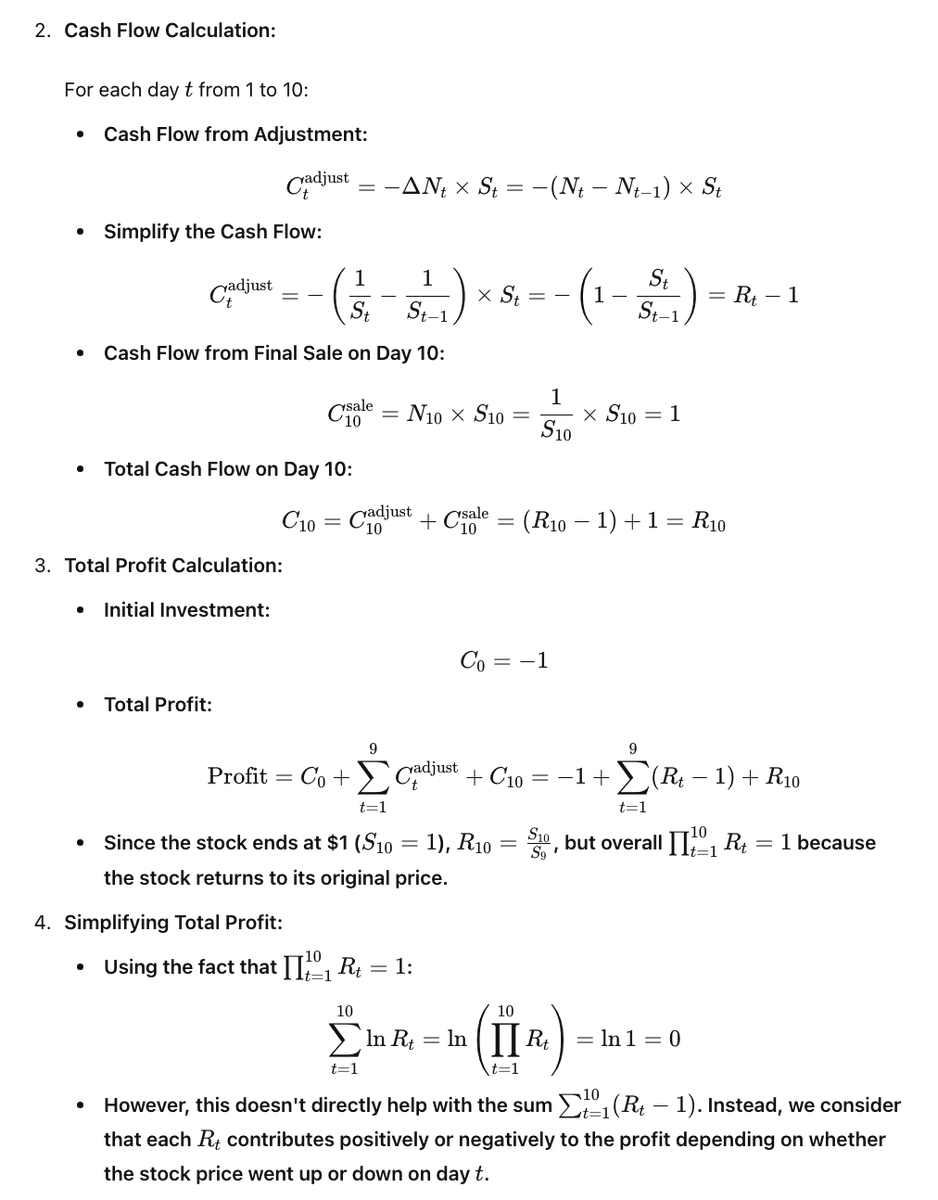
CUSUM's (one-sided) procedure works like this:
1. z-score returns (we did this already)
2. define y[t]:= x[t] -(S_H + S_L)/2. This is "detrending" the z-scored returns, splitting the sharpe in the middle.
3. if the drawdown of y[t] reaches threshold D_M, then stop the strategy.
7/
1. z-score returns (we did this already)
2. define y[t]:= x[t] -(S_H + S_L)/2. This is "detrending" the z-scored returns, splitting the sharpe in the middle.
3. if the drawdown of y[t] reaches threshold D_M, then stop the strategy.
7/
In formulas, you define the drawdown d[0] := 0
d[t] := min {d[t-1] + y[t-1], 0}
So, CUSUM is a "stop loss of the rescaled and detrended time series of returns".
Stop-loss is a special case. How? When S_L=-S_H. Then the de-trend is 0. The z-scoring doesn't matter
8/
d[t] := min {d[t-1] + y[t-1], 0}
So, CUSUM is a "stop loss of the rescaled and detrended time series of returns".
Stop-loss is a special case. How? When S_L=-S_H. Then the de-trend is 0. The z-scoring doesn't matter
8/
Intuition: imagine that your strategy has sharpe >= S_H. Then the series has unit vol and positive drift. It will have small drawdowns. When sharpe <= S_L, it has guaranteed negative drift. It's going to draw down. The larger the gap, the starker the difference.
9/
9/
Where does the threshold come from? There are some approximations, but it's easiest to simulate the sequences and to choose a value that controls the false positive rate.
10/
10/
What you have to know is that this procedure is an optimal stopping rule. Like so much of sequential analysis, e.g., the secretary problem, it feels magical.
But CUSUM doesn't have a self-contained exposition.
11/
But CUSUM doesn't have a self-contained exposition.
11/
The wikipedia page is horrid. So here is something to get you started.
12/
12/

This survey by Lai, so you see the likelihood ratio underlying engine.
13/
13/
The proof of CUSUM optimality by Moustakides. Frankly, almost unreadable.
14/
14/

This is super-simple to the point that it doesn't explain the "why"
15/
15/

One day, I'll try to write a self-contained, simple but rigorous exposition. But it's midnight and tomorrow I wake up at 6:30AM.
I hope this made you curious, though.
16/
I hope this made you curious, though.
16/
@threadreaderapp unroll
• • •
Missing some Tweet in this thread? You can try to
force a refresh