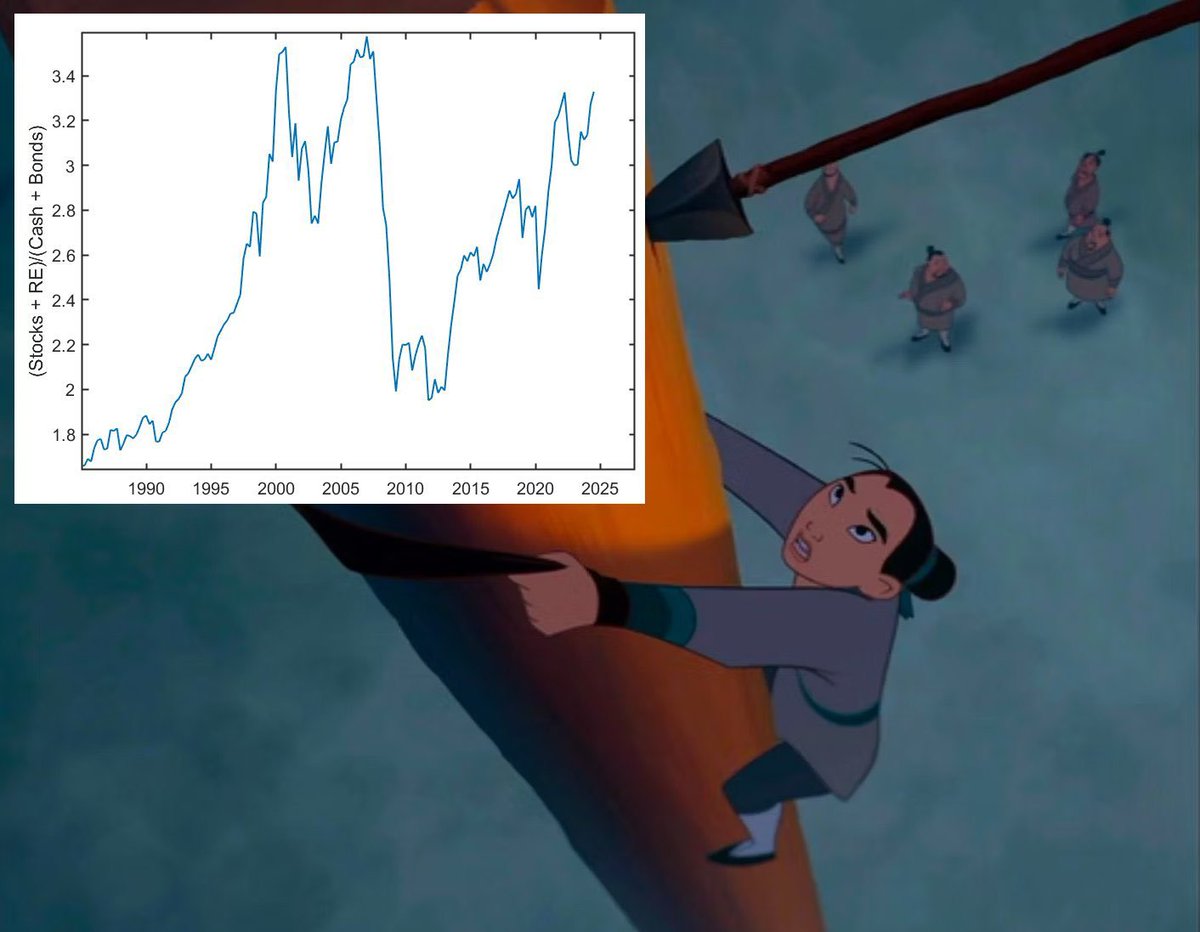
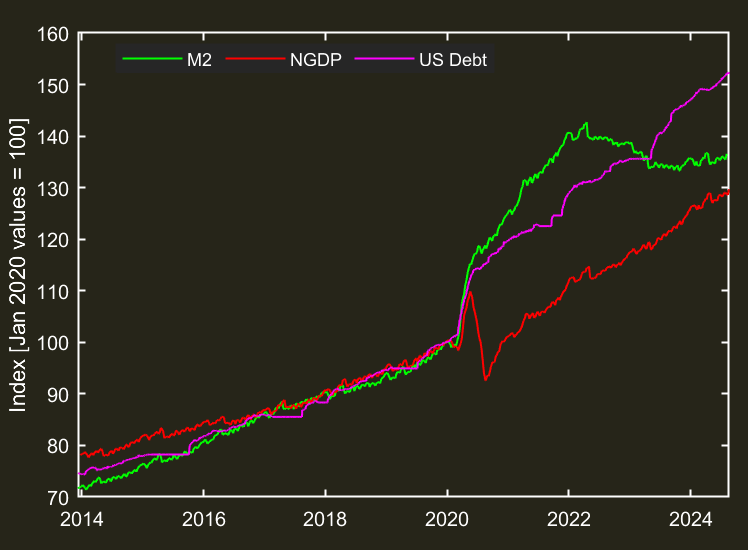
It shows what components make up the wealth of US households over time. The ratio of stocks + real estate over cash + US treasuries shows a measure of the relative portfolio risk of all US households.
In times when exuberance is low, People want to hold more cash relative to stocks + RE. When mania is raging, people don't want to hold cash and bonds.
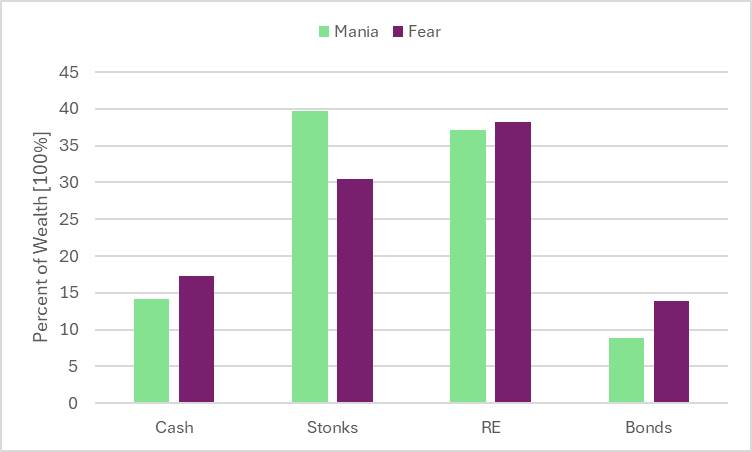
The difference is subtle, but very impactful. It is this small difference that drives all of the price improvement you see in equities. Flows are simply the path to arrive at this portfolio allocation.
Underpinning this portfolio allocation is the ever present foundation that is the money supply. This ever-present rise lifts all boats, making everything seem less risky over time. Or another way to think about it, holding cash is seen as riskier because other things will rise.
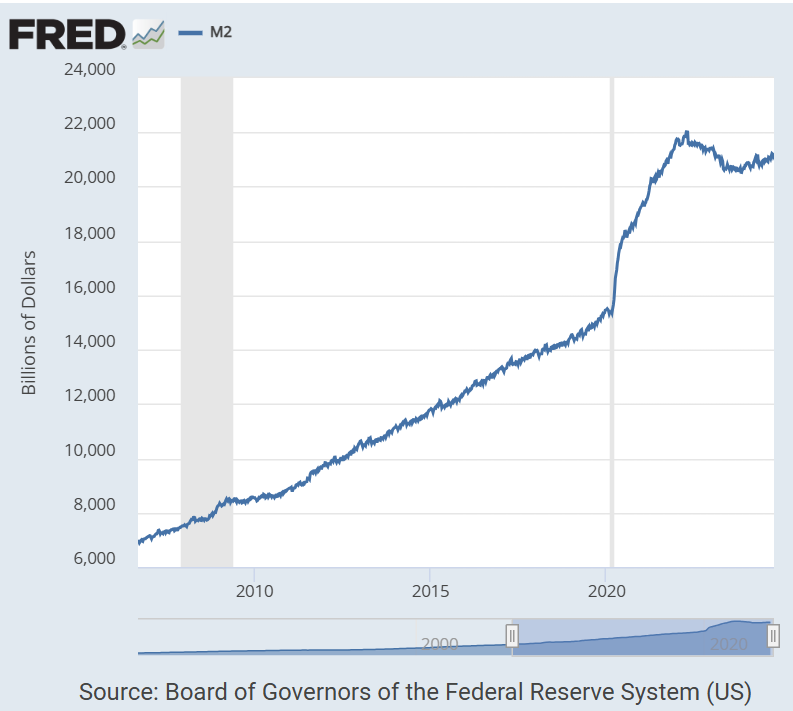
During the height of the dot com bubble, the market cap of the stock market hit 300% of the money supply. Today we are very close to the same level. But money today is much less productive than in the past, so looking at market cap to GDP, the "Buffett Indicator," shows an ATH.
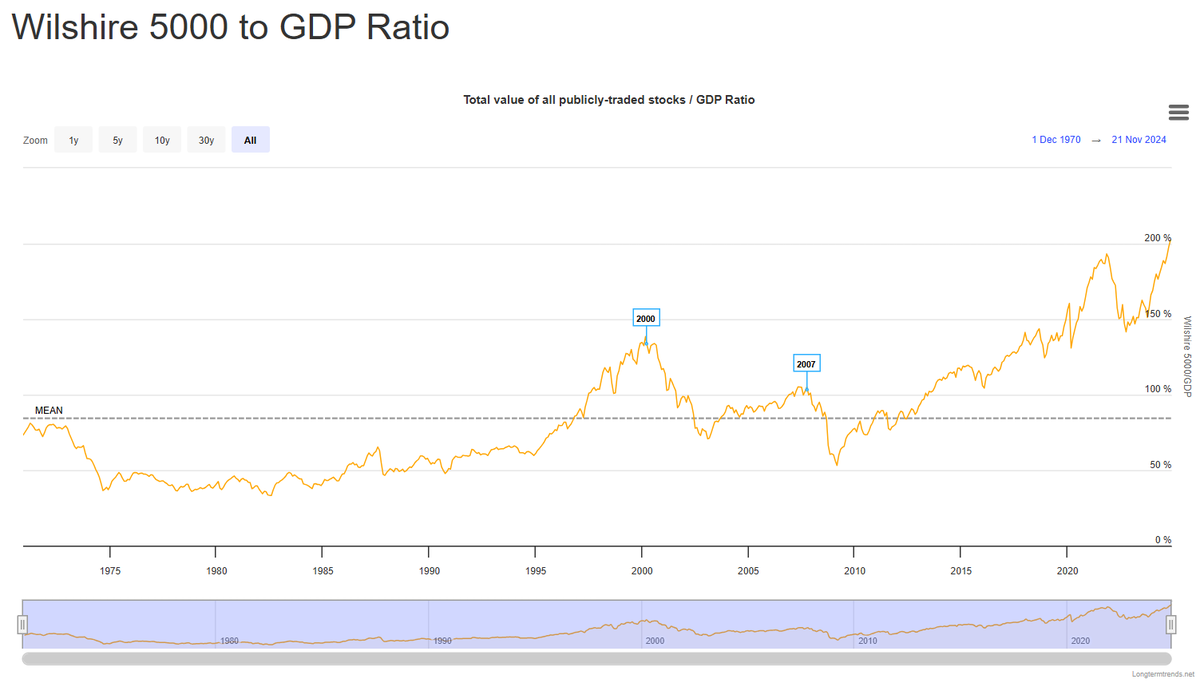
So why are multiples rising to astronomical values? The portfolio allocation. There are simply too many dollars lying around and their productivity is at an all time low. Then for the same percent portfolio allocations, stocks must be ever higher valued.
This has important implications for markets. For those looking to understand why value investing is dead, it is the modern portfolio balance. People will simply invest based on risk tolerance, with no attention paid to fundamentals. What percent of X and y do you want to own?
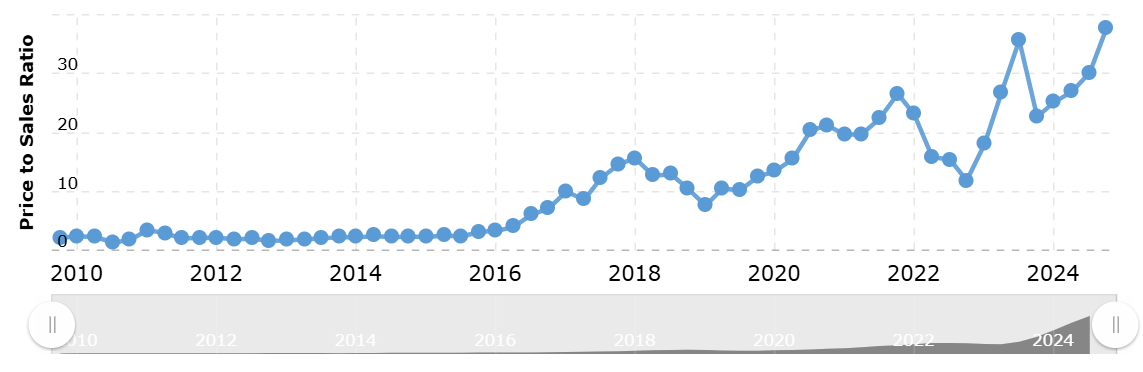
This results in things like $NVDA having a price to sales ratio of over 30x. During the dot com bubble, where the CEO of Sun Microsystems famously wrote a letter to investors asking "what were you thinking?!?" when their P/S hit 10x before the bust.
So what's the problem? Money is debt. The growth in our money supply comes from the extension of debt and credit, both public and private. What happens eventually when leverage goes up and productivity goes down? Eventually something has to pop.
This pop leads to a massive deleveraging like the ones we saw in 2000, 2008, and 2020. The key is that the government responds to every crisis with more money, continuing the progression of more money with lower productivity.
So back to my Disney meme. Typically these bubbles tend to pop once they reach a certain point of leverage. This data is from Q2, so is one quarter old. My estimate is that we are close to the top of previous bubbles. As long as the Fed is not printing...
It's likely we will see a pop. But watch out for the printer, because when they turn it on again, valuations are going to get even crazier. If you think markets are broken now, wait until the next cycle. I think we have at least one more in us, so I'm not bullish right now.
Disclosure: I have a 2.85% 30 yr mortgage and would love for JPOW to inflate my asset backed debt to zero. Print baby, print.
• • •
Missing some Tweet in this thread? You can try to
force a refresh
Your Bitcoin primer: Everything you need to know to understand the $BTC market.🧵
Before we talk about market dynamics, let's quickly discuss what $BTC is. People argue over whether it is a store of value, or a currency, or a commodity, which I am not going to try and decide here. Instead I will simply present the information and let you decide yourself.
$BTC is a token on a blockchain. A blockchain is just a ledger that records transactions. The innovation of cryptocurrency is the development of decentralized ledger recording, or trustless transactions.
Everyone here has the effect of treasury rates backwards because they are still operating with a low debt level framework. 🧵
If debt is same as cash, rates are irrelevant and NGDP growth = Deficit when bank reserve fraction constant. If treasuries carry duration risk, then rates are sensitive to supply as bond holders use the interest payments along with savings to balance proportional debt holdings.
So the more bonds are sold to the public, the heavier their weight in their portfolios, and the more they will demand to be compensated for duration risk. Without this cash flow from interest payments, bonds would continue to grow relative to cash holdings.
Alright, we've all heard fintwit, seemingly every economist, and even the chair of the Federal Reserve say there is a housing shortage in our country. So did you know that there are more dwellings per person than there have been in the last 20 years? Time for a housing 🧵!
Let's be real, the plot above is really just a flat line. So if housing supply more or less always tracks total population, what's really happening to housing prices? Let's peel it back and see if we can find anything.
This number includes both owner dwellings and rentals. So let's look at just owner dwellings. We can see that units went down after the great financial crisis, but increased again in 2015 until today. In terms of occupied units, it's also the highest per capita in 25 years.
As we await the Fed rate decision this week, it's important to put it into context. First is the chart I use to get a feel for macroeconomic conditions. It plots the YoY percent change of 1) US deficit, 2) M2 broad money, 3) CPI (inflation), 4) Nominal GDP, and 5) Wages. 🧵
Just to quickly recap, during and following Covid, the Fed printed and distributed nearly 40% of all money at the time. This influx of money was an attempt to offset the drop in money velocity (how many times money changes hands) from the pandemic.
The NGDP curve is wobbly in this region because of reporting lags, but it more or less perfectly increased M2 by the amount that velocity decreased to keep NGDP stable. However, after the pandemic it was likely that velocity would return as the world reopened.
This week was Feb OPEX. Last week I said it looked a lot like Dec OPEX, which would likely provide immense upward pressure if it played out similarly. Although we ended the week negative, I think most people would agree buying pressure was immense.
First we have an update on options contract values on the chain. Similar story, most of the value is in calls. Puts continue to be sold to scavenge income. But compare Feb to spike in Dec. In Dec, lots of contract value dropped off at OPEX. In Feb very little did.
Here's my take on the Geoffrey Hinton "just storing weights" meme about @GaryMarcus. I put in the prompt "game controller" into Bing image maker.
Look familiar?
I couldn't think of a better image to capture $MSFT stealing Sony concepts and telling them to "Get F***ed"🧵
I did a reverse image search in Google (take that $MSFT and Sony!), and quickly returned many likenesses of what is obviously a Sony Dualshock 4 wireless controller.
Comparing the two, there's a lot you can glean from the image creation process. First, the joy-cons look almost exactly identical, where the AI generated one has more contrast and is grainier. Also note the dots in the center screen. More contrast, and distorted.