Engineer. Researcher. Stonk Enjoyer. Don't ask me if the drapes match the carpet.
5 subscribers
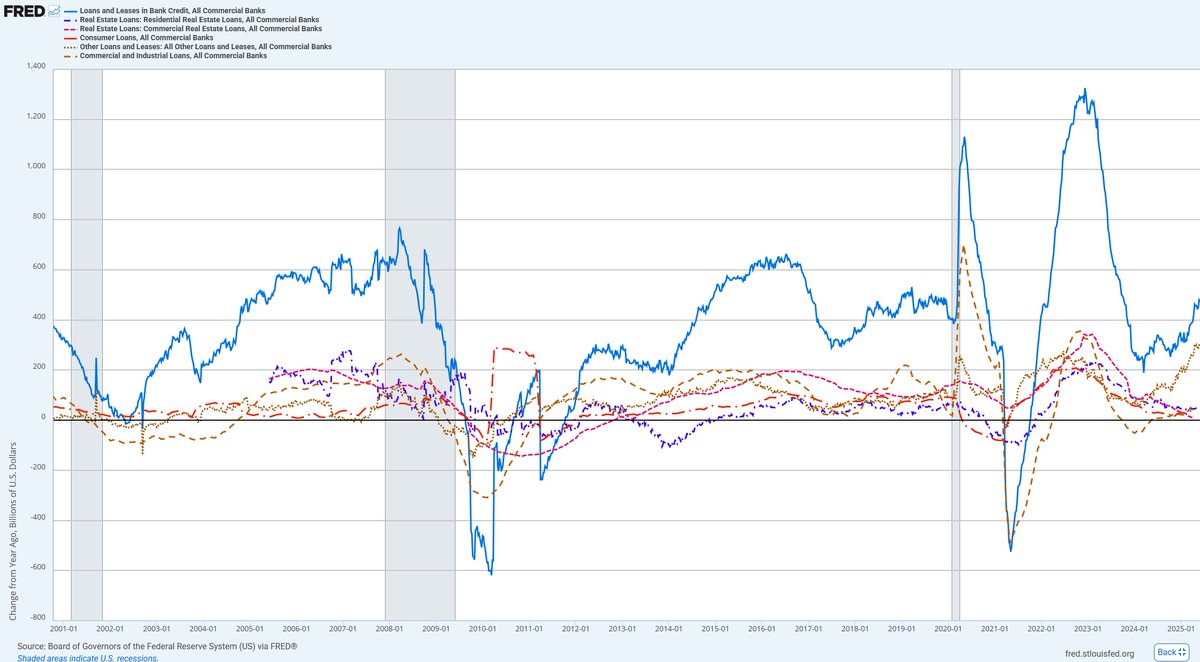 In the chart above is the change in loans over a year in billions of dollars. Over the last 25 years, it more or less seems reasonable. It's broken into residential real estate, commercial real estate, consumer loans, C&I loans, and "other loans and leases."
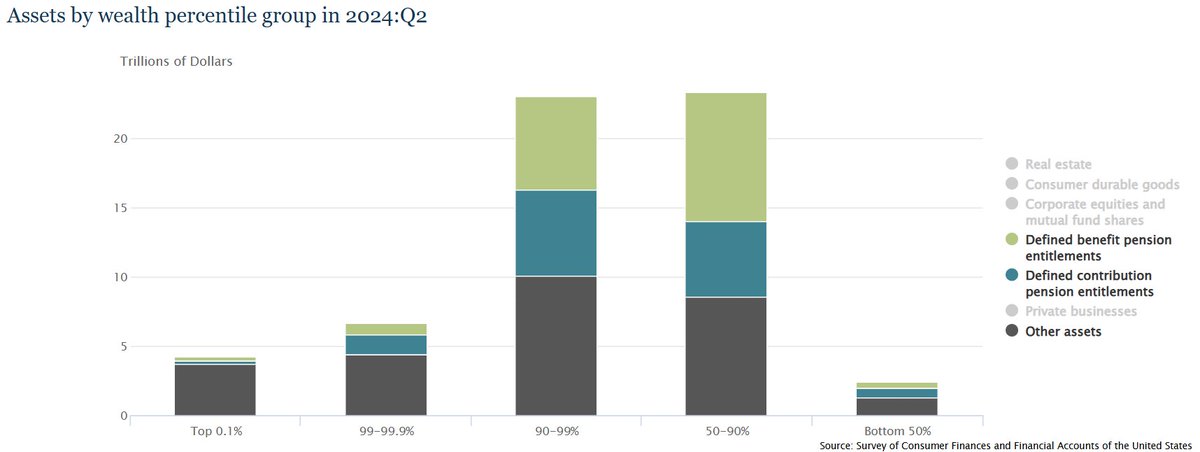
 It's pretty simple, just pulled the data from the Fed Z tables on household wealth.
 Before we talk about market dynamics, let's quickly discuss what $BTC is. People argue over whether it is a store of value, or a currency, or a commodity, which I am not going to try and decide here. Instead I will simply present the information and let you decide yourself.
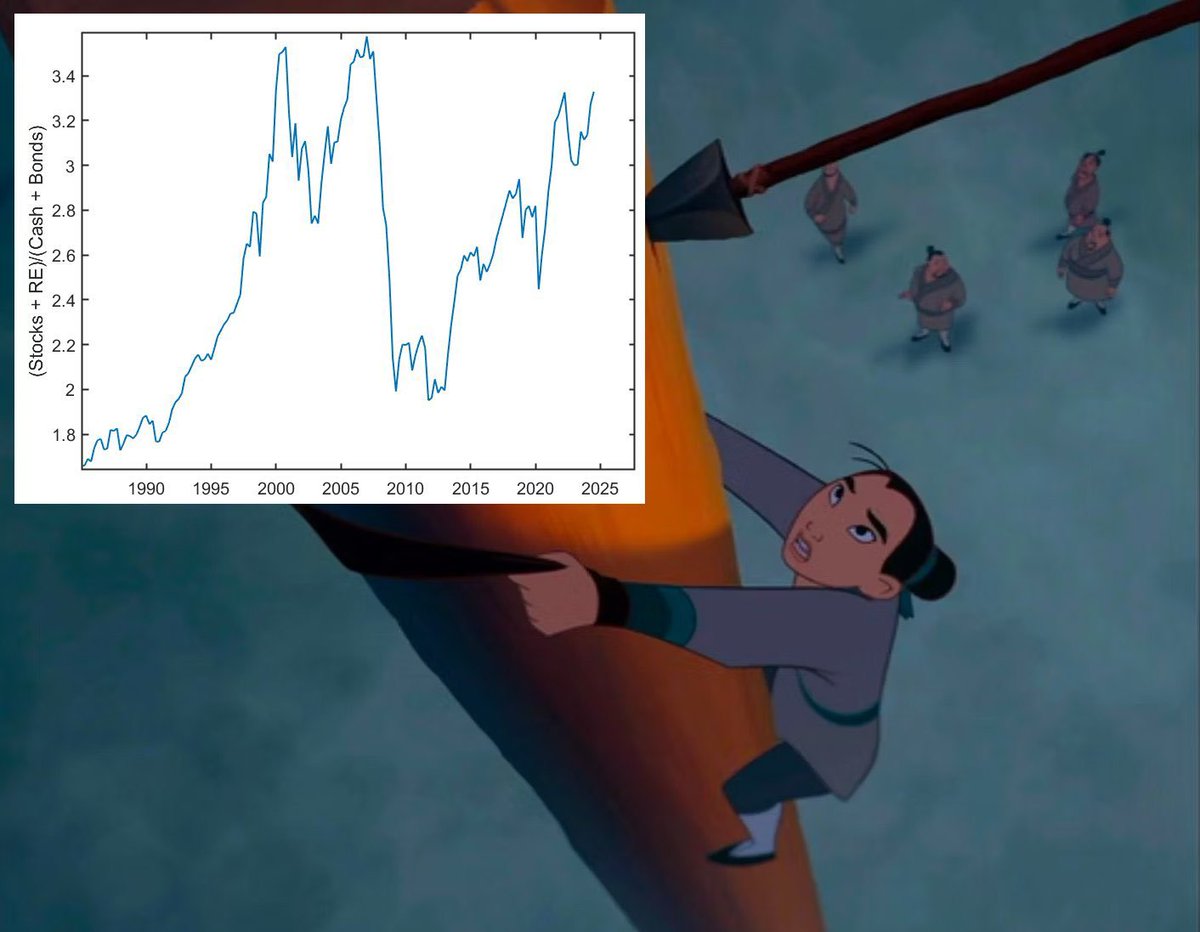
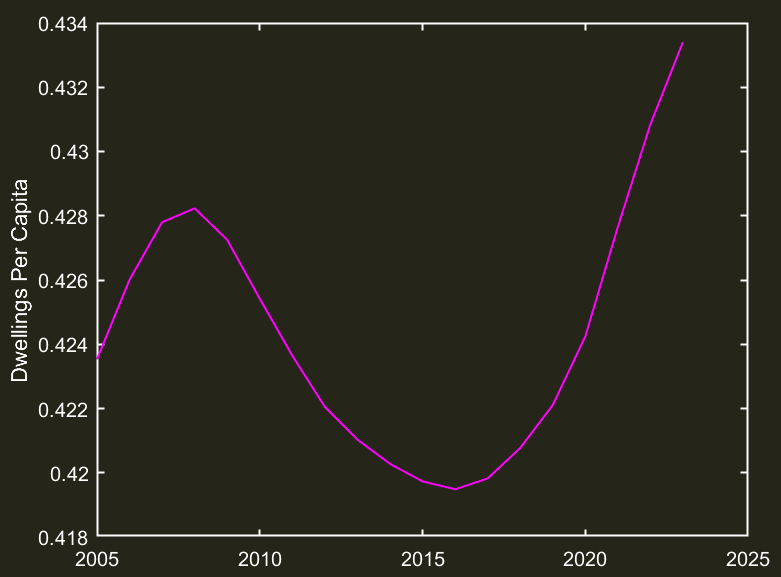 Let's be real, the plot above is really just a flat line. So if housing supply more or less always tracks total population, what's really happening to housing prices? Let's peel it back and see if we can find anything.
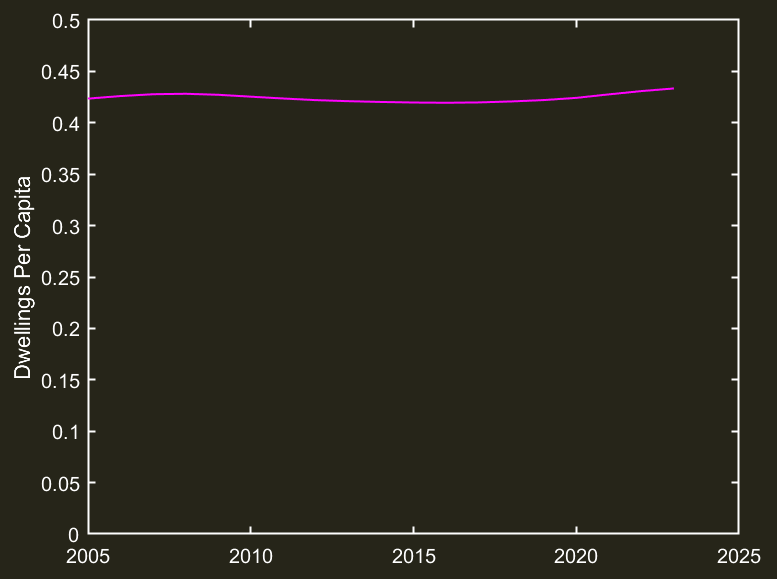
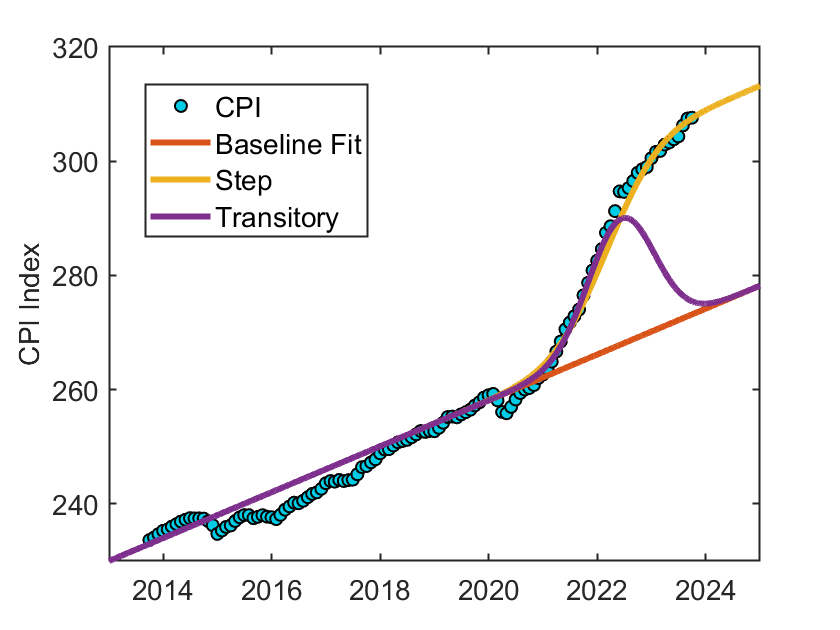
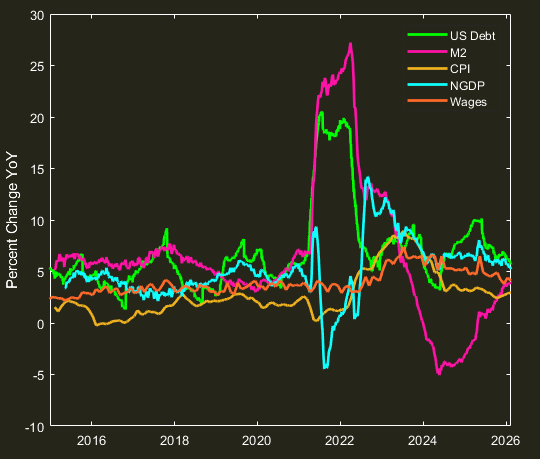
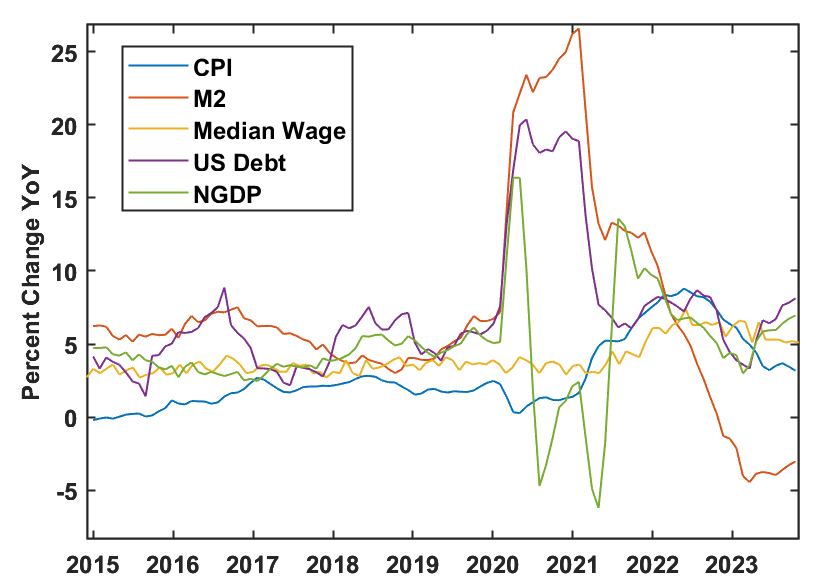
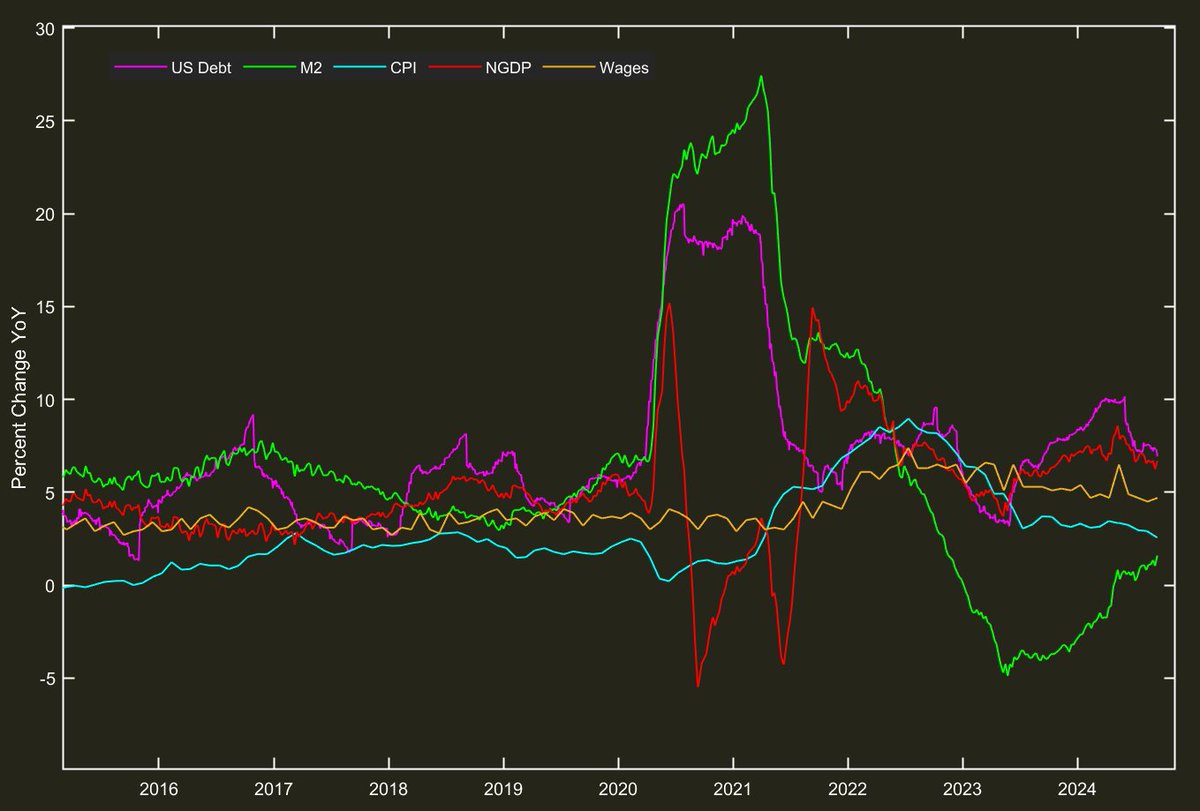 Just to quickly recap, during and following Covid, the Fed printed and distributed nearly 40% of all money at the time. This influx of money was an attempt to offset the drop in money velocity (how many times money changes hands) from the pandemic.
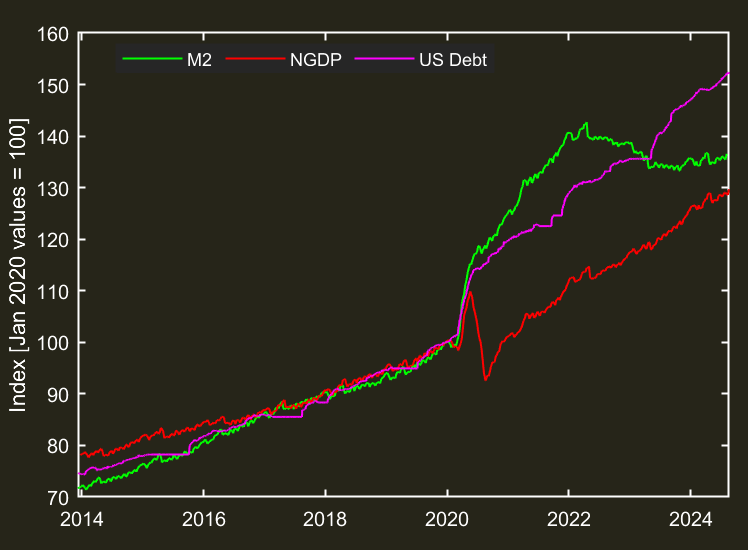
 I did a reverse image search in Google (take that $MSFT and Sony!), and quickly returned many likenesses of what is obviously a Sony Dualshock 4 wireless controller.
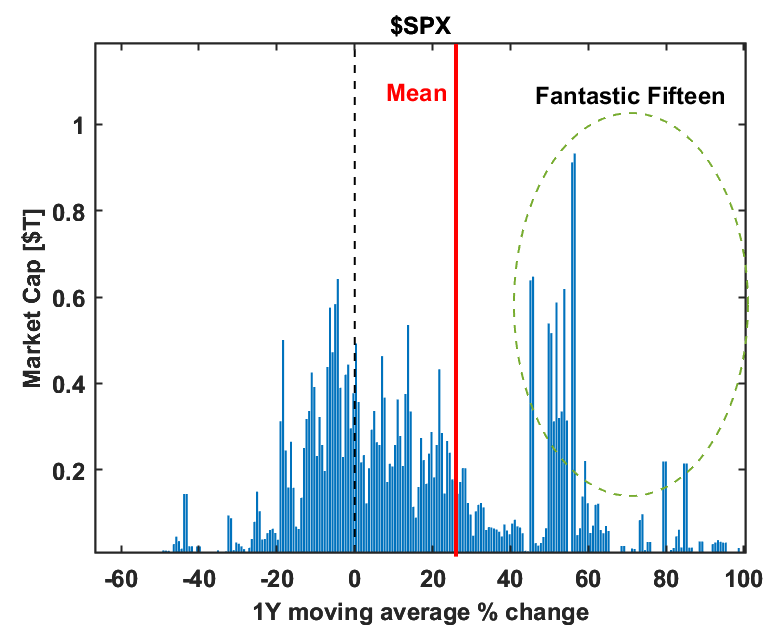 Above is a market cap weighted histogram of the 1Y % change over time for the $SPX. So for example, the large $1T bar near 55% means that $1T worth of companies in the $SPX increased by 55% this year.
 The next common one I see is actually a lot of different yes/no criteria. For example, percent of companies above their 20 day moving average. I saw percent of companies below 200 day moving average for awhile back in October. These are...okay...but they throw out a lot of info.