
There are not many places on earth where we have detailed cause-of-death data from before the era of widespread vaccination.
Massachusetts is one of those places.
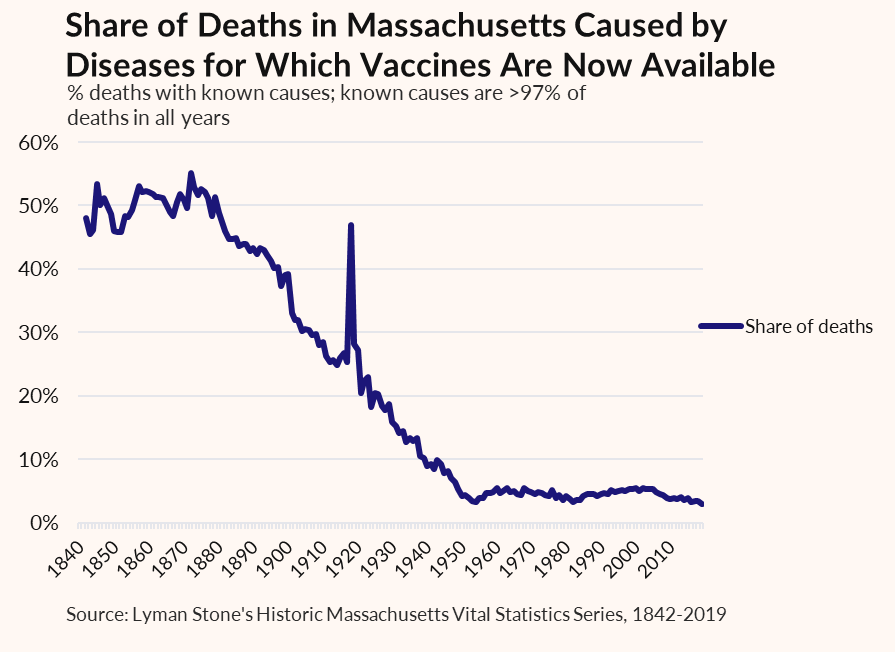
From 1842-1877, 70% of all deaths were from diseases which we today have vaccines to prevent.
Massachusetts is one of those places.
From 1842-1877, 70% of all deaths were from diseases which we today have vaccines to prevent.

cc @RichardHanania this feels like it's up your alley
huge pain in the butt to hand-copy all these historic vital stats, but I did it a few years back and have never regretted it!
huge pain in the butt to hand-copy all these historic vital stats, but I did it a few years back and have never regretted it!
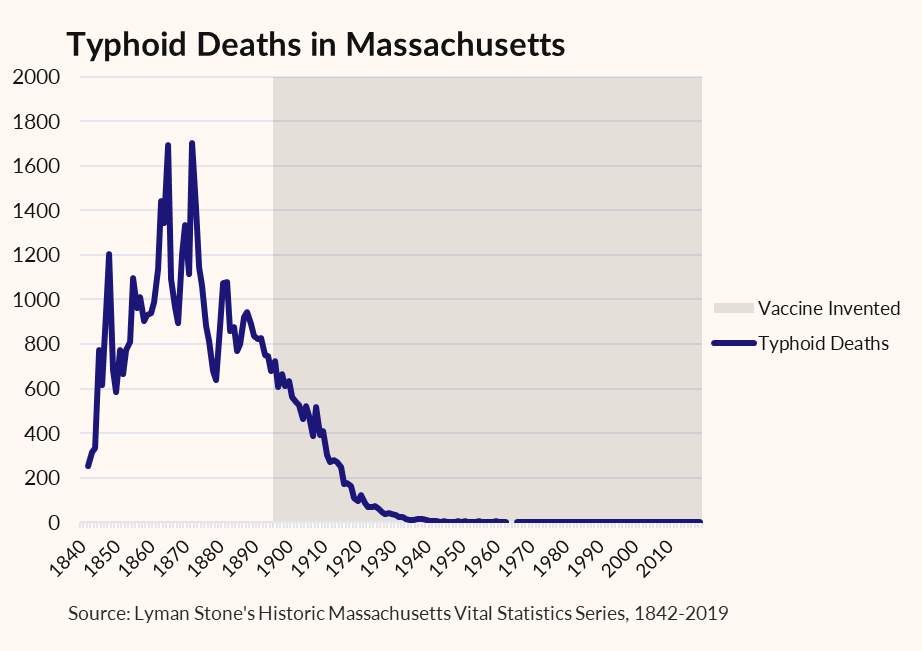
For example, here's typhoid. Vaccine available 1896. You could try to say there was a pre-vaccine decline, but it's hard to know for sure. Certainly absolutely no shot of falling to <500/yr pre-vaccine.
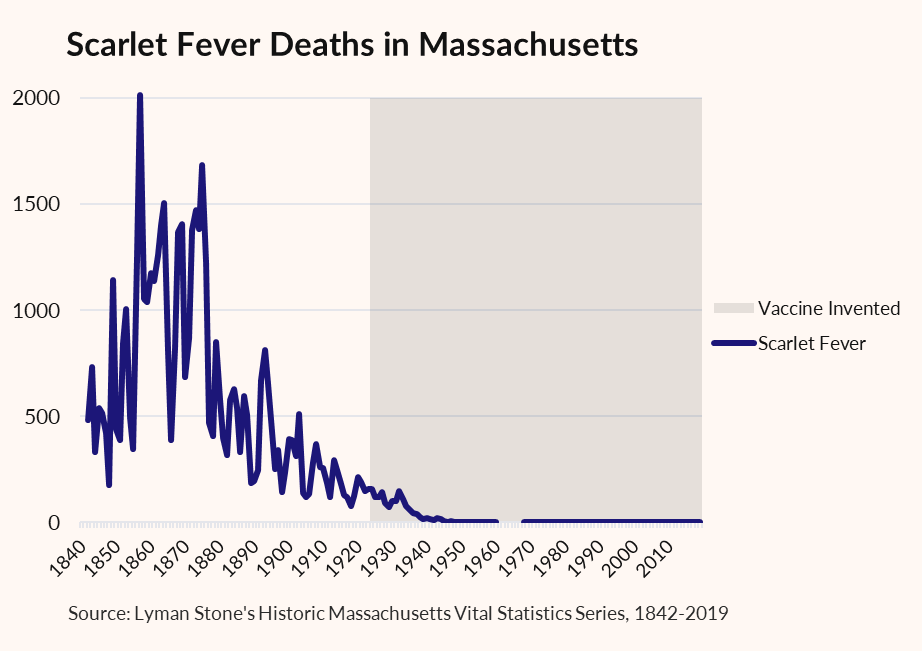
Here's scarlet fever deaths. Vaccine invented 1924, widespread availability by the early 1930s.
Scarlet fever pretty much only kills kids, so the figure falls over time partly because because Massachusetts births were falling. But you can see deaths drop to ~zero after vaccine.
Scarlet fever pretty much only kills kids, so the figure falls over time partly because because Massachusetts births were falling. But you can see deaths drop to ~zero after vaccine.
I could go on.
Vaccines obviously aren't the only factor improving health. Sanitation efforts and improved treatments had big effects too. But you don't go from vaccinatable deaths at 70% to 3% without vaccines mattering!
Vaccines obviously aren't the only factor improving health. Sanitation efforts and improved treatments had big effects too. But you don't go from vaccinatable deaths at 70% to 3% without vaccines mattering!
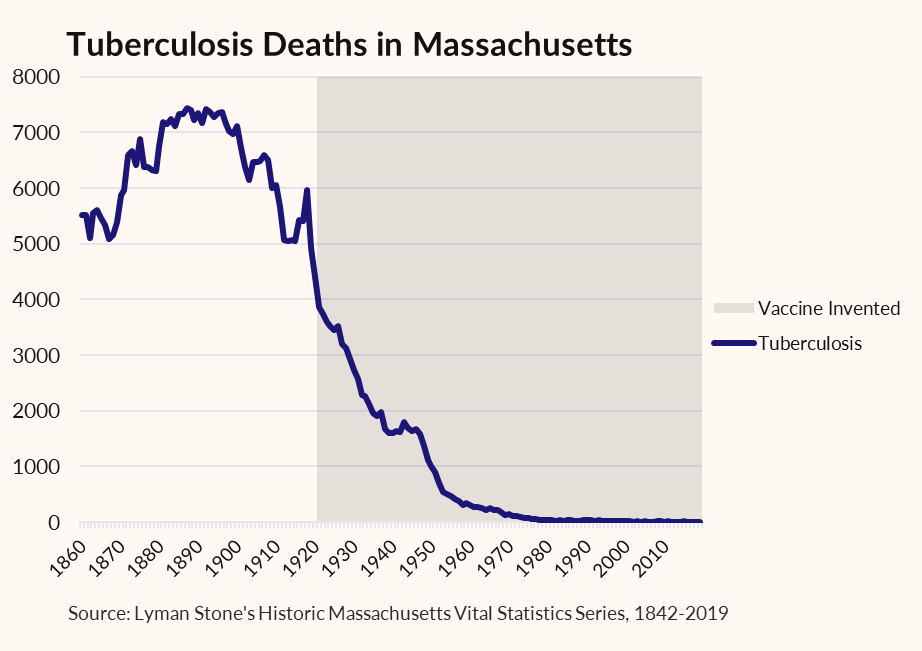
Okay, one more.
TB deaths were already declining when the vaccine was rolled out. And they didn't drop to super-low levels until antibiotics. But it's obvious vaccination helped a ton!
TB deaths were already declining when the vaccine was rolled out. And they didn't drop to super-low levels until antibiotics. But it's obvious vaccination helped a ton!
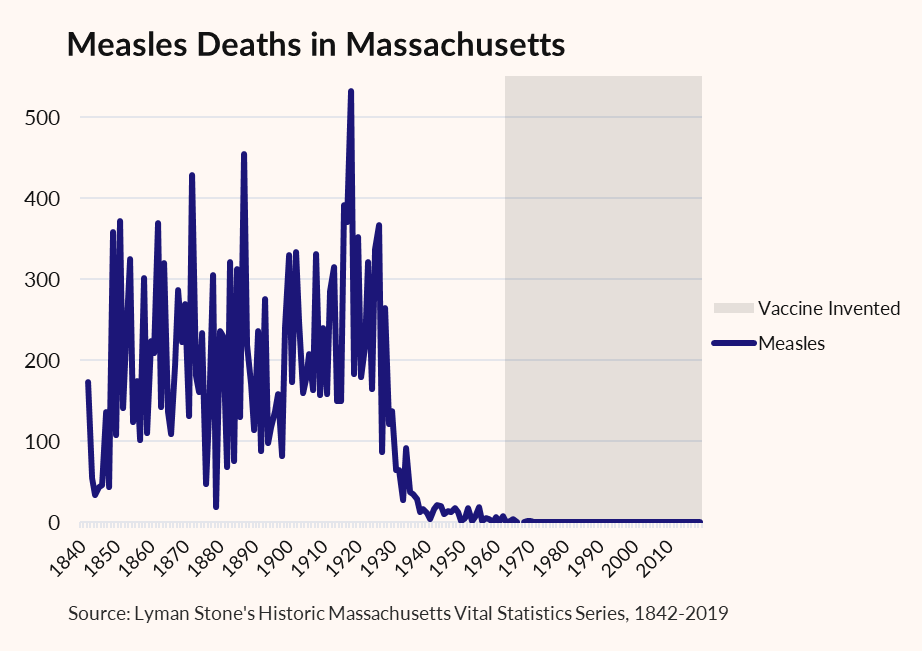
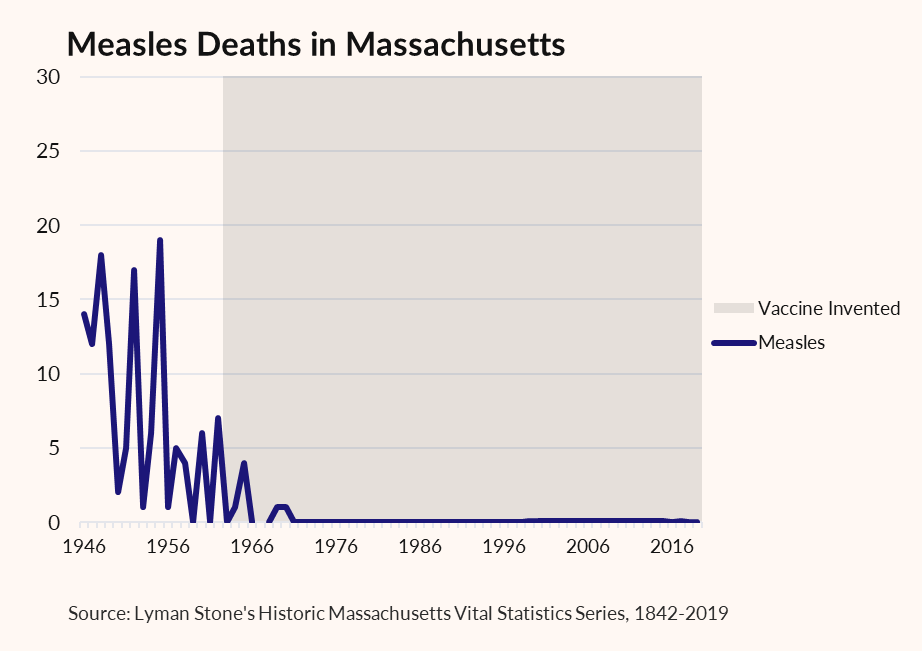
Measles is an interesting one.
Vaccine isn't available until 1963. Measles is viral, so antibiotics 1930 and later aren't a plausible explanation either.
But we can see that there's no chance of "staying at zero" without a vaccine.
Vaccine isn't available until 1963. Measles is viral, so antibiotics 1930 and later aren't a plausible explanation either.
But we can see that there's no chance of "staying at zero" without a vaccine.
I don't think vaccines are the entire cause of falling death rates from conditions for which we have vaccines.
But they're obviously part of it!
But they're obviously part of it!
Influenza is a weird one. First, the data starts in 1890 because it wasn't widely recognized as a discrete disease in MA's classification system before then. Second, there's the huge pandemic bump. I'm gonna ignore that. Third, vaccine development was a slow roll 1931-1950.

But by 1950-55 at the latest, influenza vaccination was relatively common if far from universal.
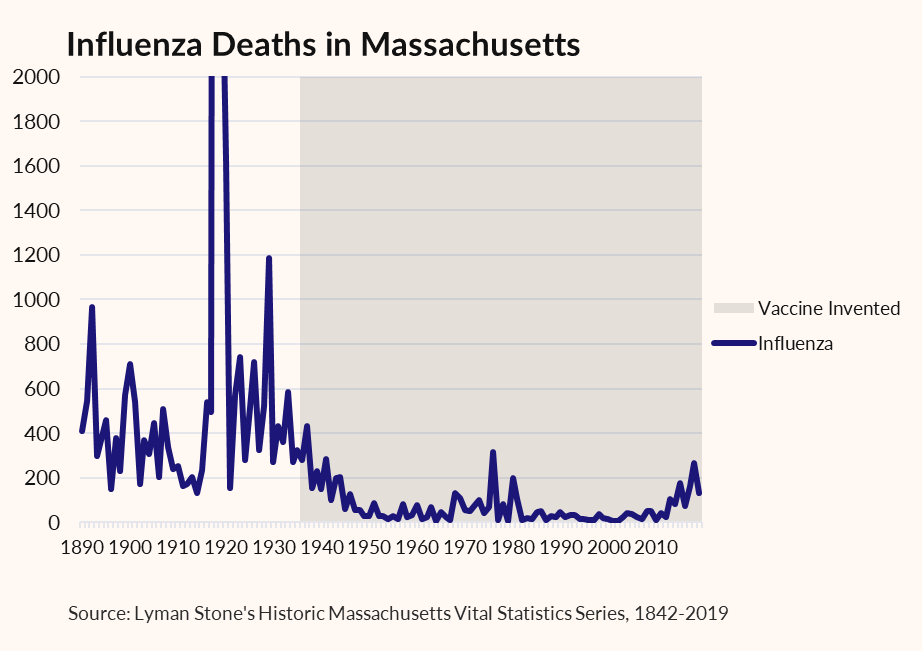
Again, I'm not saying vaccines caused 100% of improvements. But they're part of the story!
When you're moving fast you make mistakes. Here are some of mine:
1) First graph has an error. I double-counted tuberculosis deaths in many early years. Fixed. Trends are identical, but 1842-1877 average is now 50%, not 70%. Note that the actual graph of tuberculosis deaths IS correct.
2) Scarlet Fever turns out to be complex. 1924 vaccine was of limited effectiveness, discontinued 1944. It appears it was somewhat effective, but sulfanomides are probably the bigger story there.
3) A lot of people responding pointing to antibiotics. Yes I agree antibiotics are a HUGE part of the story. But also, basically 100% of people who say "We use too many vaccines" will also say "We use too many antibiotics," so this isn't much of a rebuttal.
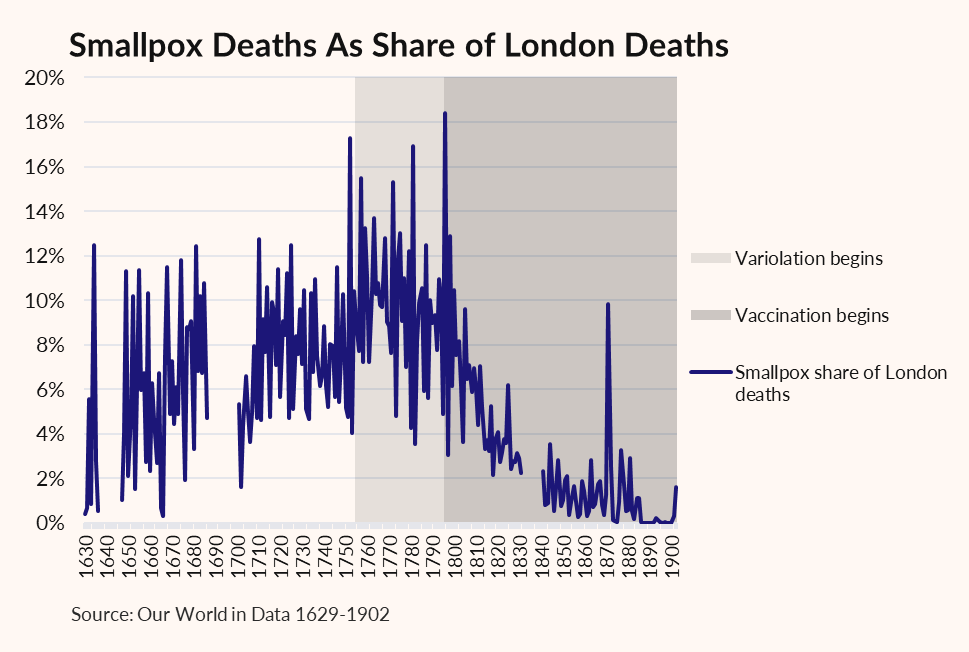
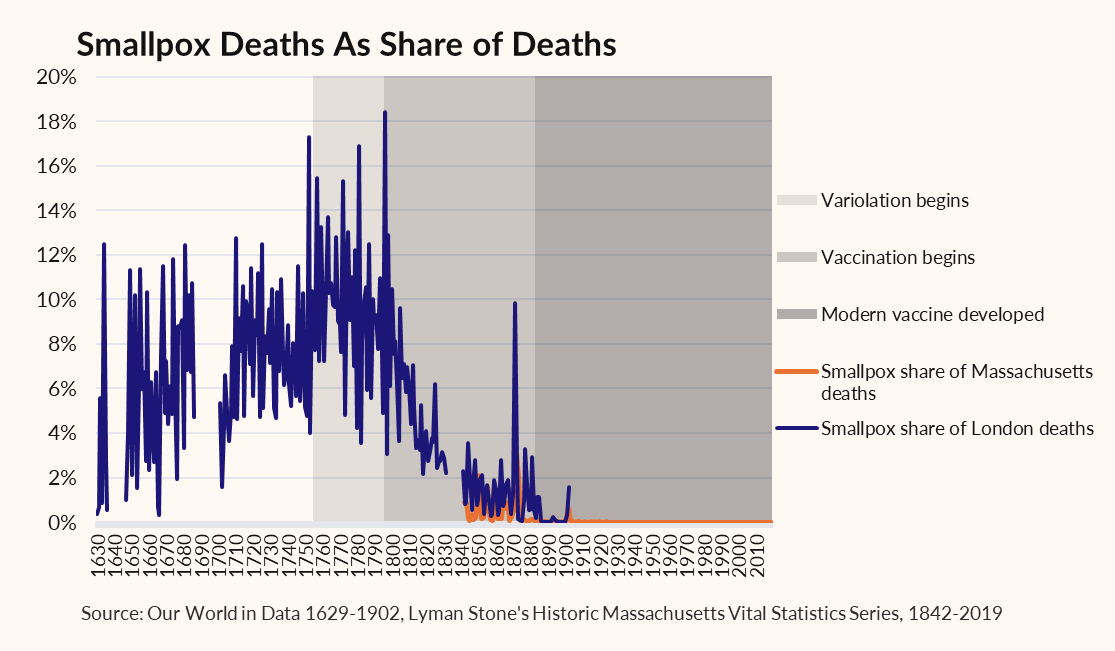
As an aside, this isn't my data, it's from @OurWorldInData , but I've added the labels for smallpox variolation and vaccination.
The other diseases all reflect vaccines developed during the period of modern improvements in sanitation and health.
Smallpox was much earlier:
The other diseases all reflect vaccines developed during the period of modern improvements in sanitation and health.
Smallpox was much earlier:
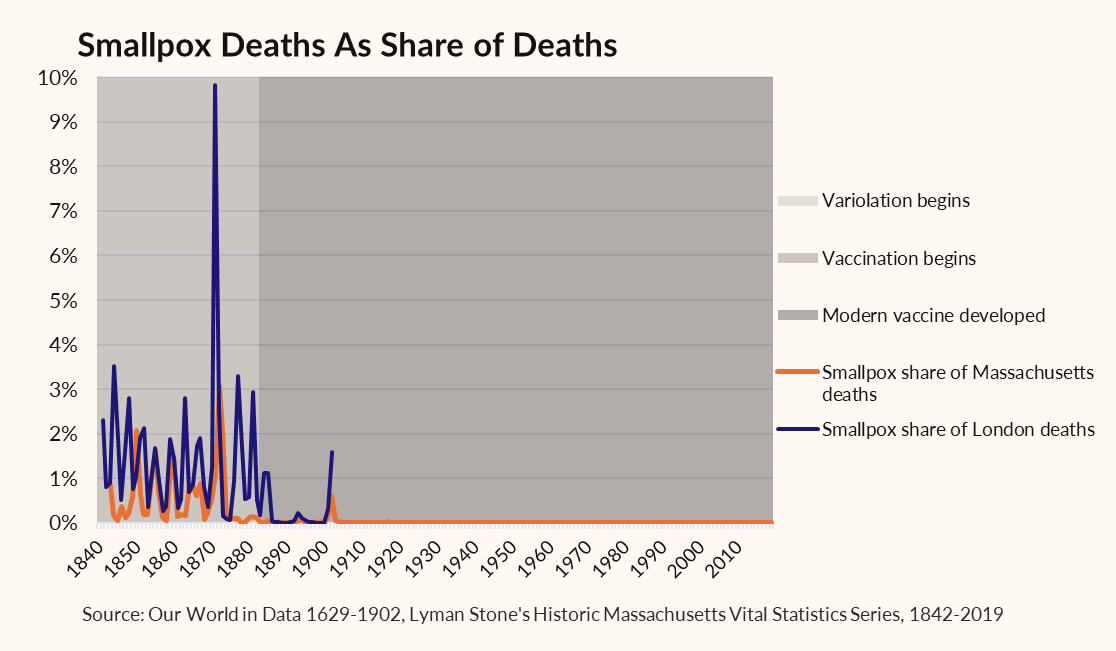
How here's the same graph, but with Massachusetts smallpox data added in.
Massachusetts was an early adopter of variolation AND of vaccination for smallpox. Even so, in both series you can see the improvement in the post-1880s vaccine in both time series!
Massachusetts was an early adopter of variolation AND of vaccination for smallpox. Even so, in both series you can see the improvement in the post-1880s vaccine in both time series!
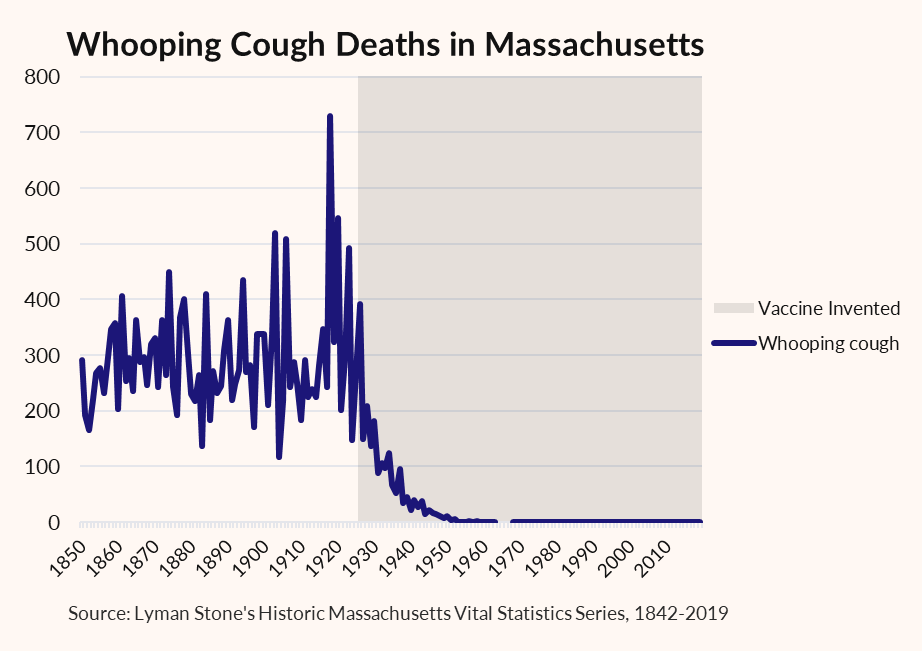
Here's whooping cough deaths in Massachusetts.
As an aside, whooping cough cases are once again on the rise, largely due to unvaccinated kids.
As an aside, whooping cough cases are once again on the rise, largely due to unvaccinated kids.
Cholera is an interesting case. Several cholera vaccines were developed 1870-1900. None got widespread usage. I'm actually not sure if cholera vaccination ever became common in America.
Moreover, cholera mostly kills children, with similar symptoms as other diseases.
Moreover, cholera mostly kills children, with similar symptoms as other diseases.
As a result 1) it's hard to know how reliable old stats are, 2) it's not clear how many people ever even got vaccinated in Massachusetts.
Anyways, here's all deaths of all cholera-or-maybe-like-cholera.
Anyways, here's all deaths of all cholera-or-maybe-like-cholera.
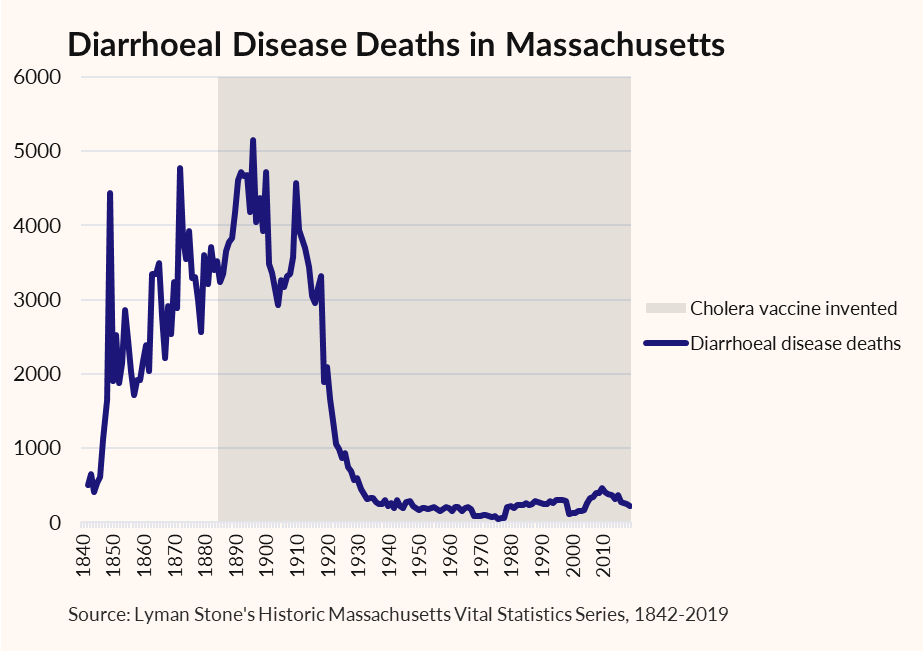
In this case it's pretty clear the existence of the cholera vaccine was irrelevant. Basically nobody used it in MA, and the real solution was water treatment and sewage infrastructure.
• • •
Missing some Tweet in this thread? You can try to
force a refresh


