Prévisions de COVID pour le Canada : NOV 23-DÉC 6, 2024
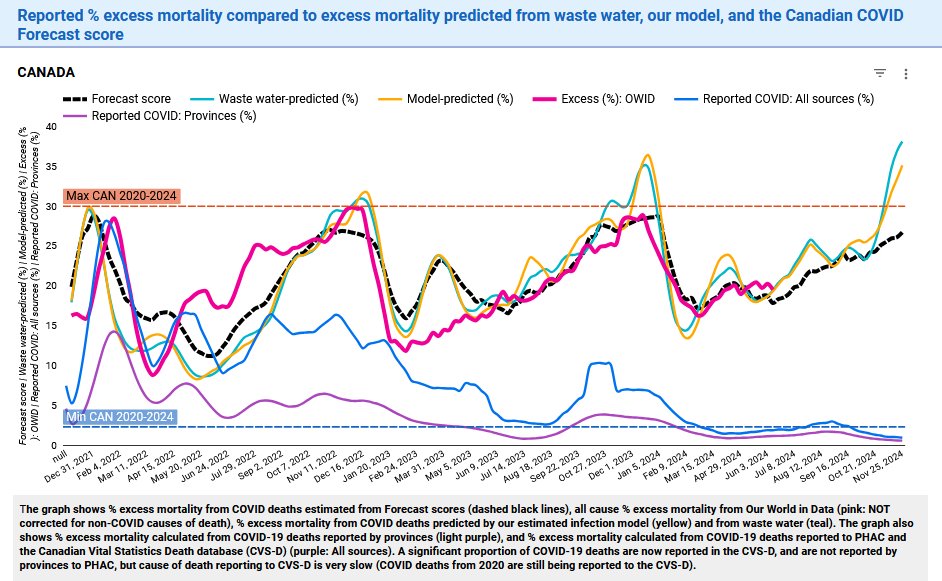
CANADA
GRAVE (stable)
Infections pendant cette période : 1 190 200-1 266 300
Environ 1 personne sur 43 est infectée
Par rapport au point le plus bas de la pandémie au Canada :
-Infections ~27X 🔺
-COVID longue ~28X 🔺
-Hospitalisations ~29X 🔺
-Décès ~26X 🔺
CANADA
GRAVE (stable)
Infections pendant cette période : 1 190 200-1 266 300
Environ 1 personne sur 43 est infectée
Par rapport au point le plus bas de la pandémie au Canada :
-Infections ~27X 🔺
-COVID longue ~28X 🔺
-Hospitalisations ~29X 🔺
-Décès ~26X 🔺

The english version of our regional forecast can be found here:
https://x.com/MoriartyLab/status/1861202809879740715
Prévisions de COVID pour le Canada : NOV 23-DÉC 6, 2024
TERRE-NEUVE ET LABRADOR
GRAVE (en hausse)
Infections pendant cette période : 10 600-11 300
Environ 1 personne sur 64 est infectée
Par rapport au point le plus bas de la pandémie au Canada :
-Infections ~17X🔺
-COVID longue ~19X🔺
-Hospitalisations ~20X🔺
-Décès ~15X🔺
TERRE-NEUVE ET LABRADOR
GRAVE (en hausse)
Infections pendant cette période : 10 600-11 300
Environ 1 personne sur 64 est infectée
Par rapport au point le plus bas de la pandémie au Canada :
-Infections ~17X🔺
-COVID longue ~19X🔺
-Hospitalisations ~20X🔺
-Décès ~15X🔺

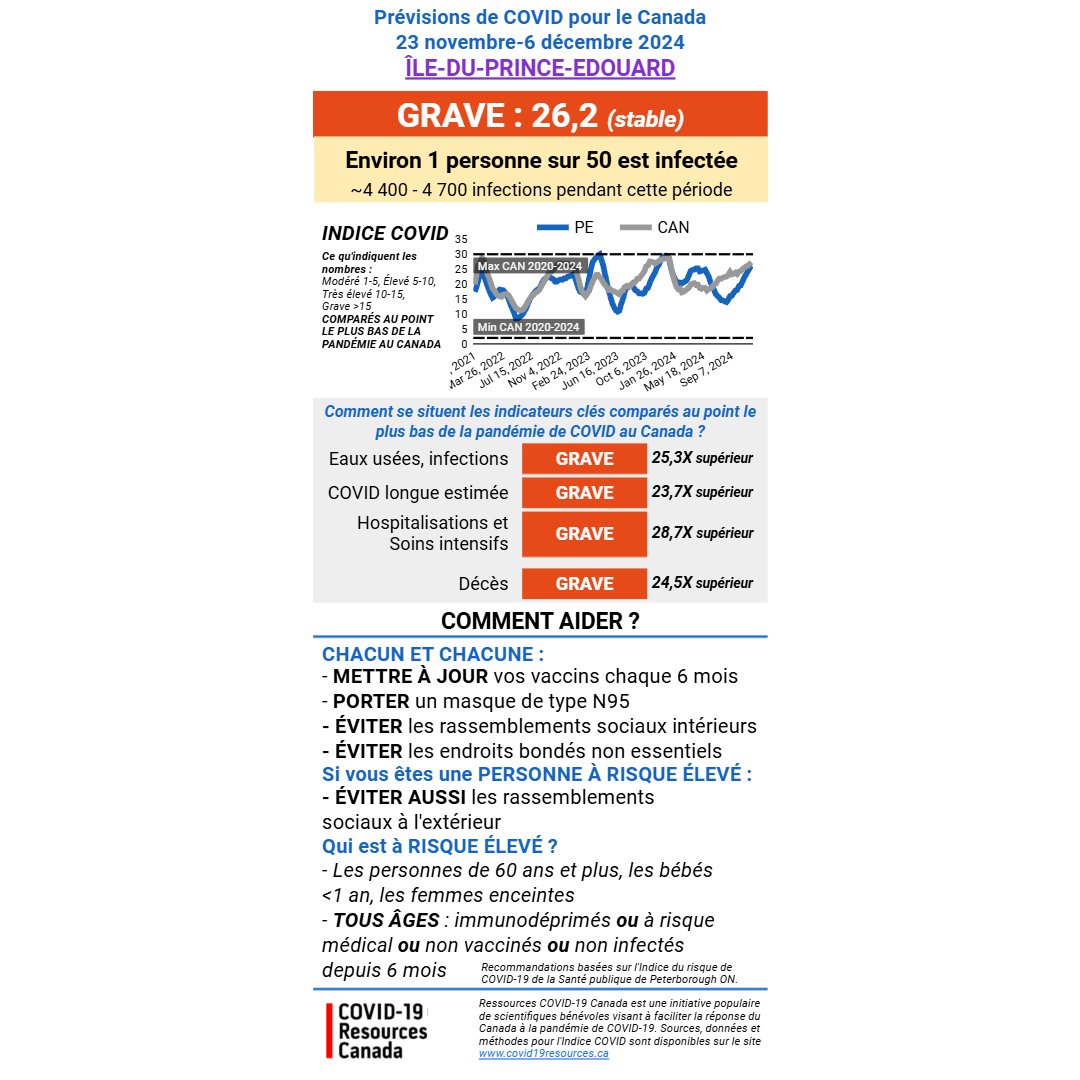
Prévisions de COVID pour le Canada : NOV 23-DÉC 6, 2024
ÎLE DU PRINCE ÉDOUARD
GRAVE (stable)
Infections pendant cette période : 4 400-4 700
Environ 1 personne sur 50 est infectée
Par rapport au point le plus bas de la pandémie au Canada :
-Infections ~25X🔺
-COVID longue ~24X🔺
-Hospitalisations ~29X🔺
-Décès ~25X🔺
ÎLE DU PRINCE ÉDOUARD
GRAVE (stable)
Infections pendant cette période : 4 400-4 700
Environ 1 personne sur 50 est infectée
Par rapport au point le plus bas de la pandémie au Canada :
-Infections ~25X🔺
-COVID longue ~24X🔺
-Hospitalisations ~29X🔺
-Décès ~25X🔺
Prévisions de COVID pour le Canada : NOV 23-DÉC 6, 2024
NOUVELLE-ÉCOSSE
GRAVE (stable)
Infections pendant cette période : 41 800-44 500
Environ 1 personne sur 32 est infectée
Par rapport au point le plus bas de la pandémie au Canada :
-Infections ~30X🔺
-COVID longue ~30X🔺
-Hospitalisations ~30X🔺
-Décès ~30X🔺
NOUVELLE-ÉCOSSE
GRAVE (stable)
Infections pendant cette période : 41 800-44 500
Environ 1 personne sur 32 est infectée
Par rapport au point le plus bas de la pandémie au Canada :
-Infections ~30X🔺
-COVID longue ~30X🔺
-Hospitalisations ~30X🔺
-Décès ~30X🔺

Prévisions de COVID pour le Canada : NOV 23-DÉC 6, 2024
NOUVEAU BRUNSWICK
GRAVE (stable)
Infections pendant cette période : 23 600-25 000
Environ 1 personne sur 44 est infectée
Par rapport au point le plus bas de la pandémie au Canada :
-Infections ~27X🔺
-COVID longue ~26X🔺
-Hospitalisations ~29X🔺
-Décès ~30X🔺
NOUVEAU BRUNSWICK
GRAVE (stable)
Infections pendant cette période : 23 600-25 000
Environ 1 personne sur 44 est infectée
Par rapport au point le plus bas de la pandémie au Canada :
-Infections ~27X🔺
-COVID longue ~26X🔺
-Hospitalisations ~29X🔺
-Décès ~30X🔺

Prévisions de COVID pour le Canada : OCT 26-OCT 08, 2024
QUÉBEC
GRAVE (stable)
Infections pendant cette période : 250 500-266 500
Environ 1 personne sur 44 est infectée
Par rapport au point le plus bas de la pandémie au Canada :
-Infections ~27X🔺
-COVID longue ~26X🔺
-Hospitalisations ~29X🔺
-Décès ~28X🔺
QUÉBEC
GRAVE (stable)
Infections pendant cette période : 250 500-266 500
Environ 1 personne sur 44 est infectée
Par rapport au point le plus bas de la pandémie au Canada :
-Infections ~27X🔺
-COVID longue ~26X🔺
-Hospitalisations ~29X🔺
-Décès ~28X🔺

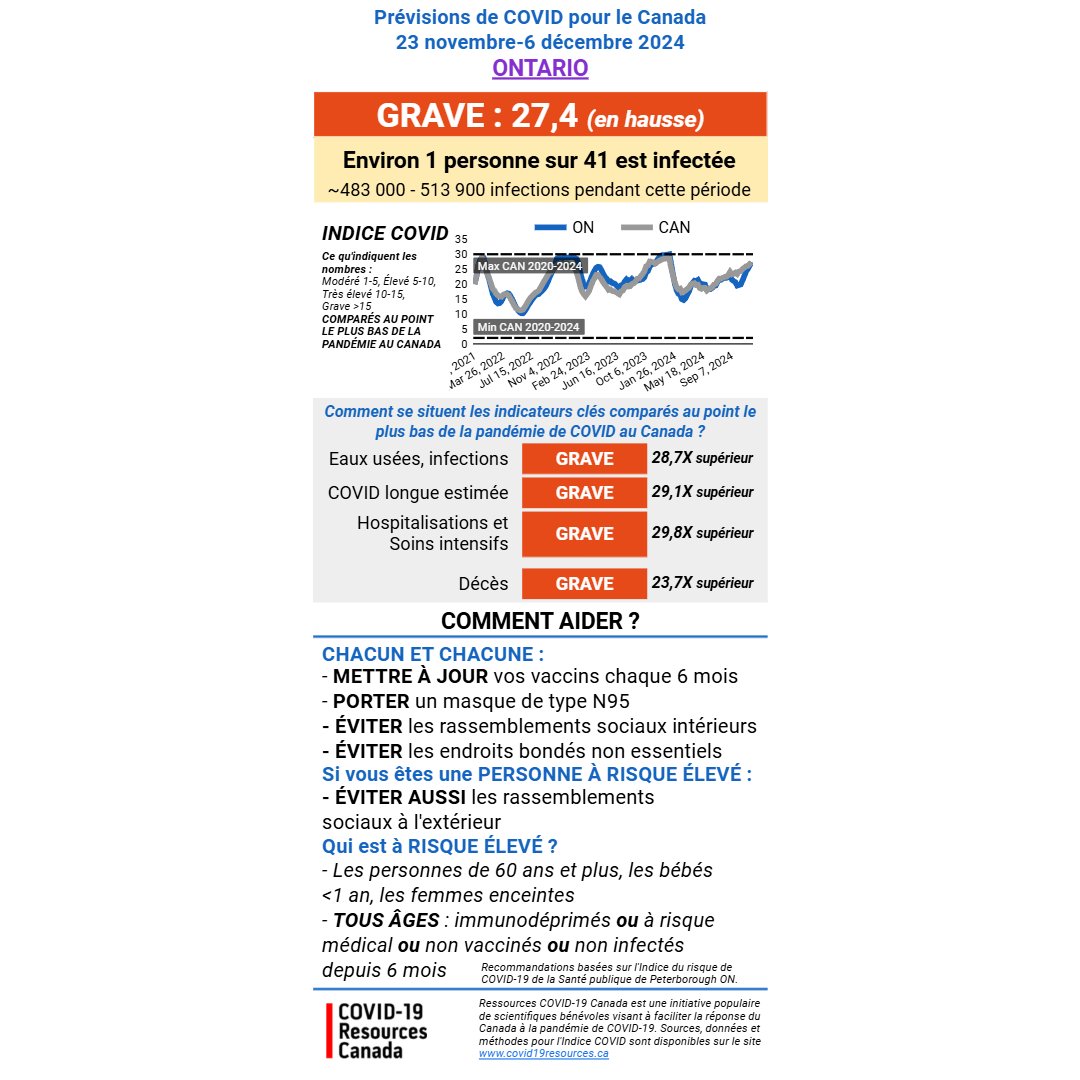
Prévisions de COVID pour le Canada : NOV 23-DÉC 6, 2024
ONTARIO
GRAVE (en hausse)
Infections pendant cette période : 483 000-513 900
Environ 1 personne sur 41 est infectée
Par rapport au point le plus bas de la pandémie au Canada :
-Infections ~29X🔺
-COVID longue ~29X🔺
-Hospitalisations ~30X🔺
-Décès ~24X🔺
ONTARIO
GRAVE (en hausse)
Infections pendant cette période : 483 000-513 900
Environ 1 personne sur 41 est infectée
Par rapport au point le plus bas de la pandémie au Canada :
-Infections ~29X🔺
-COVID longue ~29X🔺
-Hospitalisations ~30X🔺
-Décès ~24X🔺
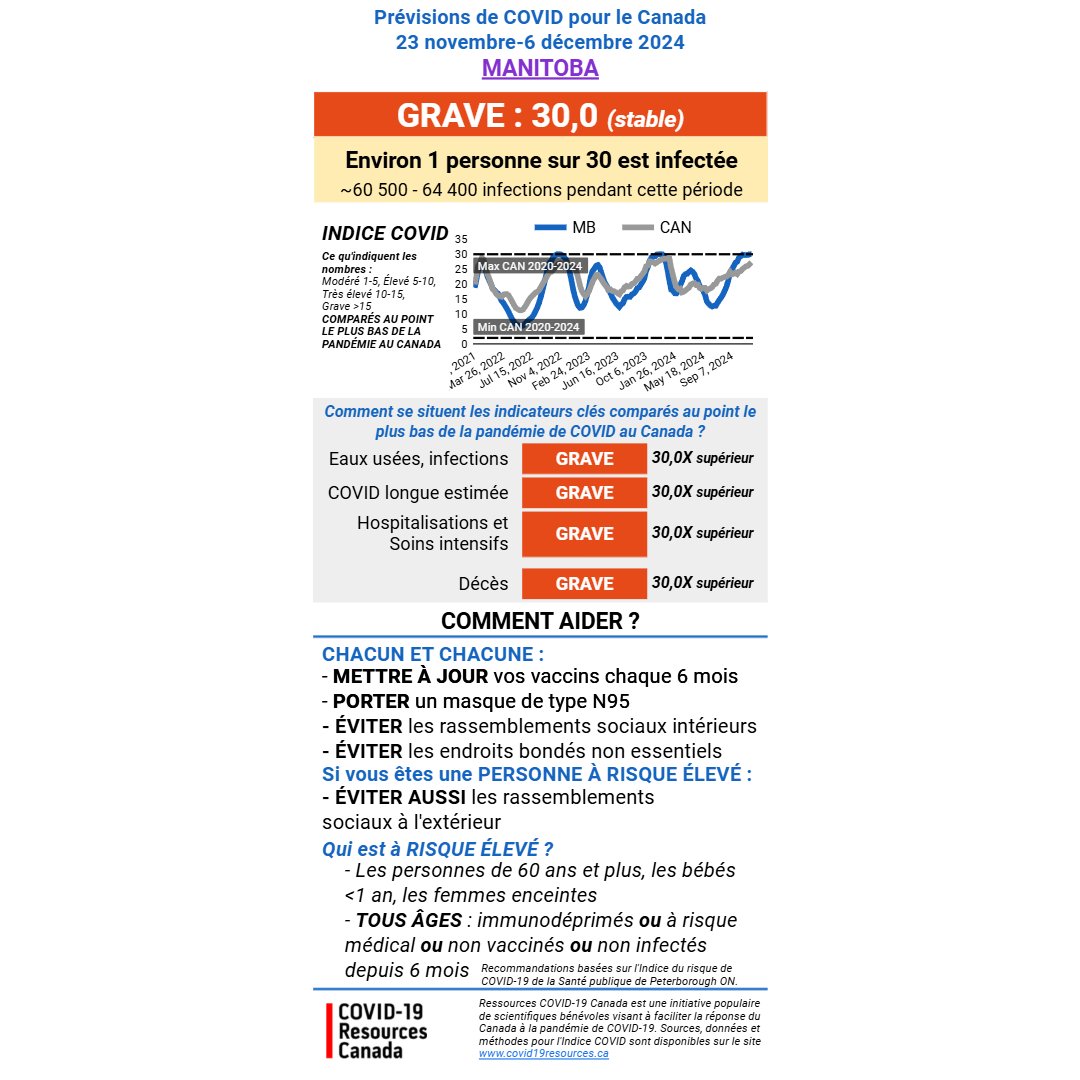
Prévisions de COVID pour le Canada : NOV 23-DÉC 6, 2024
MANITOBA
GRAVE (stable)
Infections pendant cette période : 60 500-64 400
Environ 1 personne sur 30 est infectée
Par rapport au point le plus bas de la pandémie au Canada :
-Infections ~30X🔺
-COVID longue ~30X🔺
-Hospitalisations ~30X🔺
-Décès ~30X🔺
MANITOBA
GRAVE (stable)
Infections pendant cette période : 60 500-64 400
Environ 1 personne sur 30 est infectée
Par rapport au point le plus bas de la pandémie au Canada :
-Infections ~30X🔺
-COVID longue ~30X🔺
-Hospitalisations ~30X🔺
-Décès ~30X🔺
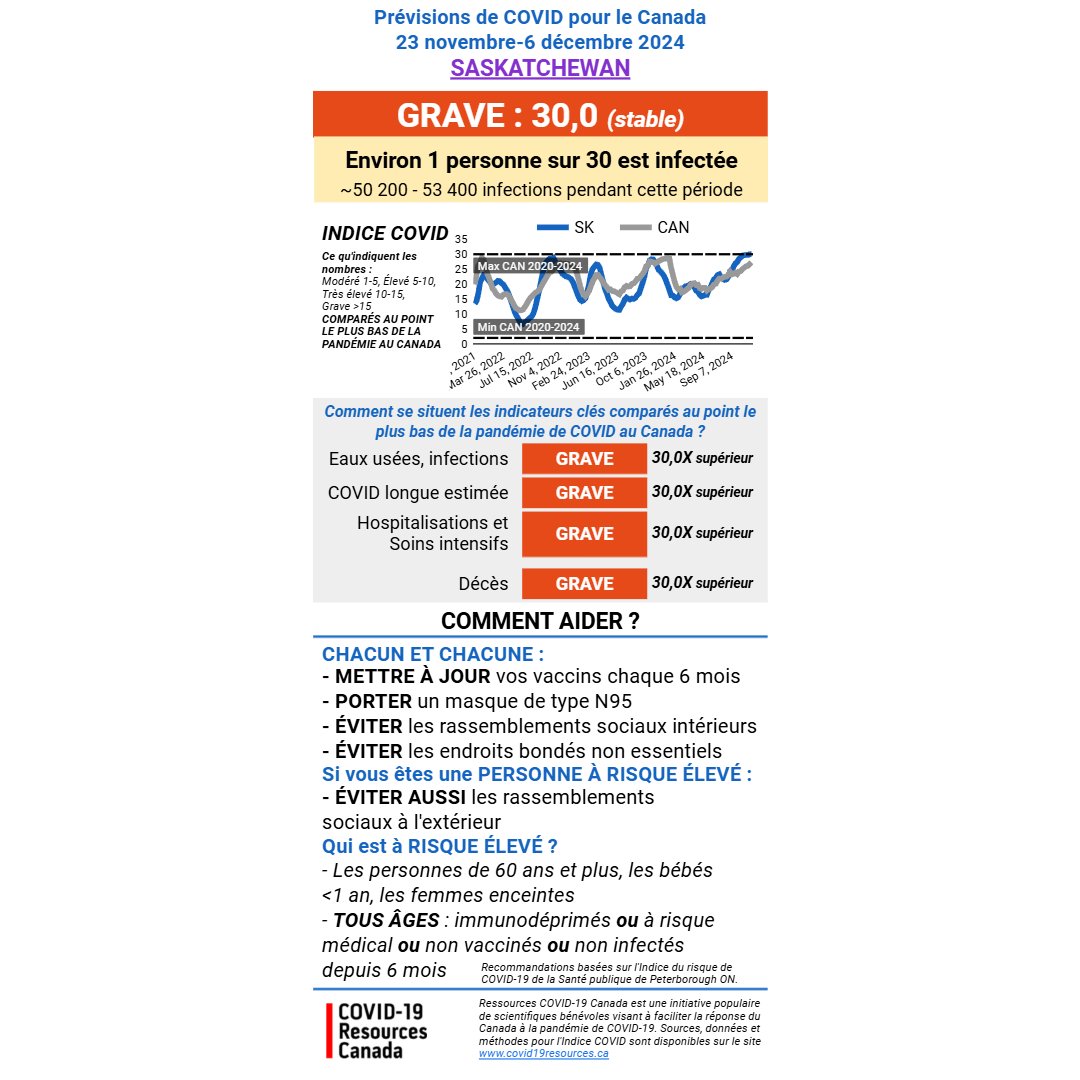
Prévisions de COVID pour le Canada : NOV 23-DÉC 6, 2024
SASKATCHEWAN
GRAVE (stable)
Infections pendant cette période : 50 200-53 400
Environ 1 personne sur 30 est infectée
Par rapport au point le plus bas de la pandémie au Canada :
-Infections ~30X🔺
-COVID longue ~30X🔺
-Hospitalisations ~30X🔺
-Décès ~30X🔺
SASKATCHEWAN
GRAVE (stable)
Infections pendant cette période : 50 200-53 400
Environ 1 personne sur 30 est infectée
Par rapport au point le plus bas de la pandémie au Canada :
-Infections ~30X🔺
-COVID longue ~30X🔺
-Hospitalisations ~30X🔺
-Décès ~30X🔺
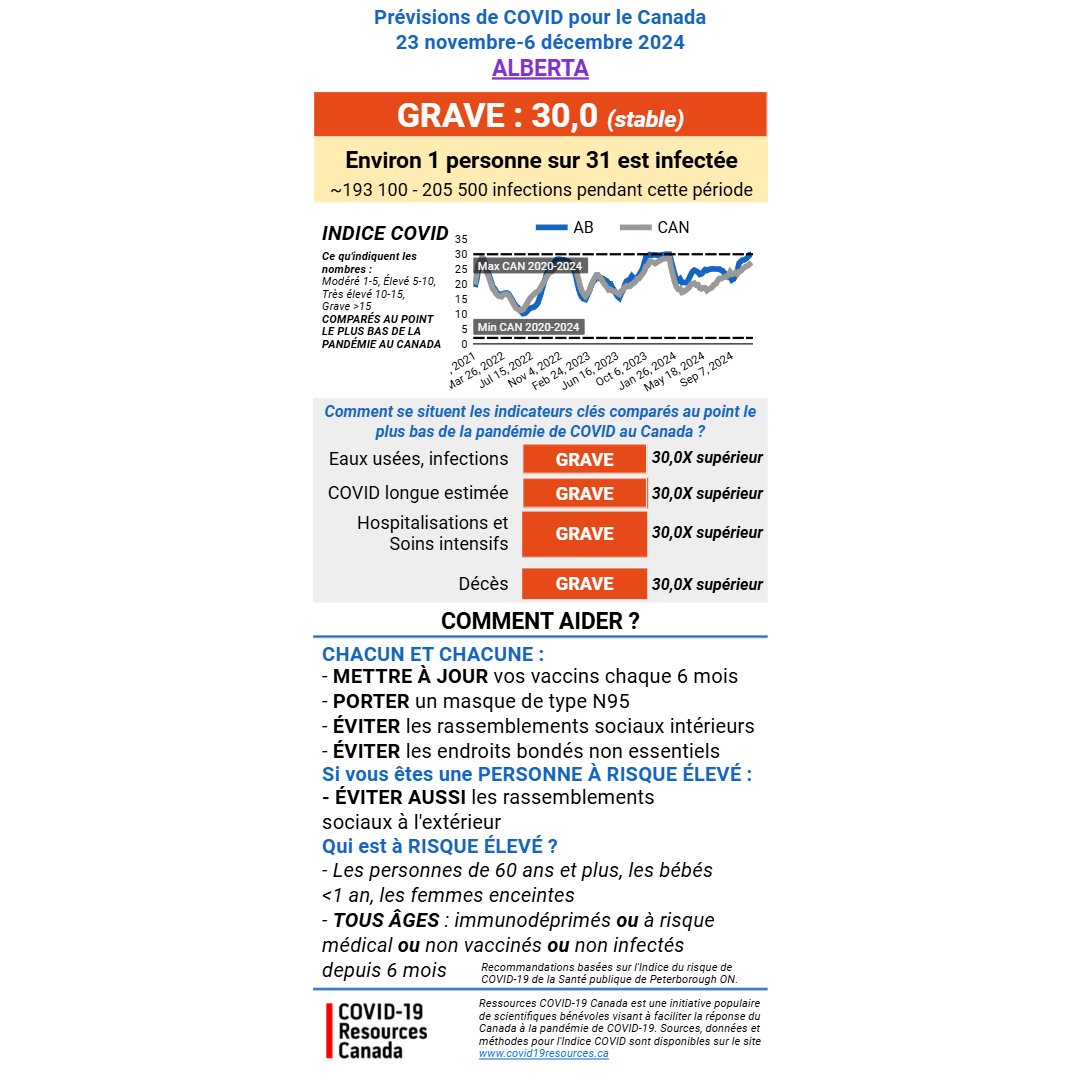
Prévisions de COVID pour le Canada : NOV 23-DÉC 6, 2024
ALBERTA
GRAVE (stable)
Infections pendant cette période : 193 100-205 500
Environ 1 personne sur 31 est infectée
Par rapport au point le plus bas de la pandémie au Canada :
-Infections ~30X🔺
-COVID longue ~30X🔺
-Hospitalisations ~30X🔺
-Décès ~30X🔺
ALBERTA
GRAVE (stable)
Infections pendant cette période : 193 100-205 500
Environ 1 personne sur 31 est infectée
Par rapport au point le plus bas de la pandémie au Canada :
-Infections ~30X🔺
-COVID longue ~30X🔺
-Hospitalisations ~30X🔺
-Décès ~30X🔺
Prévisions de COVID pour le Canada : NOV 23-DÉC 6, 2024
COLOMBIE BRITANNIQUE
GRAVE (en baisse)
Infections pendant cette période : 69 300-73 800
Environ 1 personne sur 100 est infectée
Par rapport au point le plus bas de la pandémie au Canada :
-Infections ~12X🔺
-COVID longue ~12X🔺
-Hospitalisations ~16X🔺
-Décès ~20X🔺
COLOMBIE BRITANNIQUE
GRAVE (en baisse)
Infections pendant cette période : 69 300-73 800
Environ 1 personne sur 100 est infectée
Par rapport au point le plus bas de la pandémie au Canada :
-Infections ~12X🔺
-COVID longue ~12X🔺
-Hospitalisations ~16X🔺
-Décès ~20X🔺

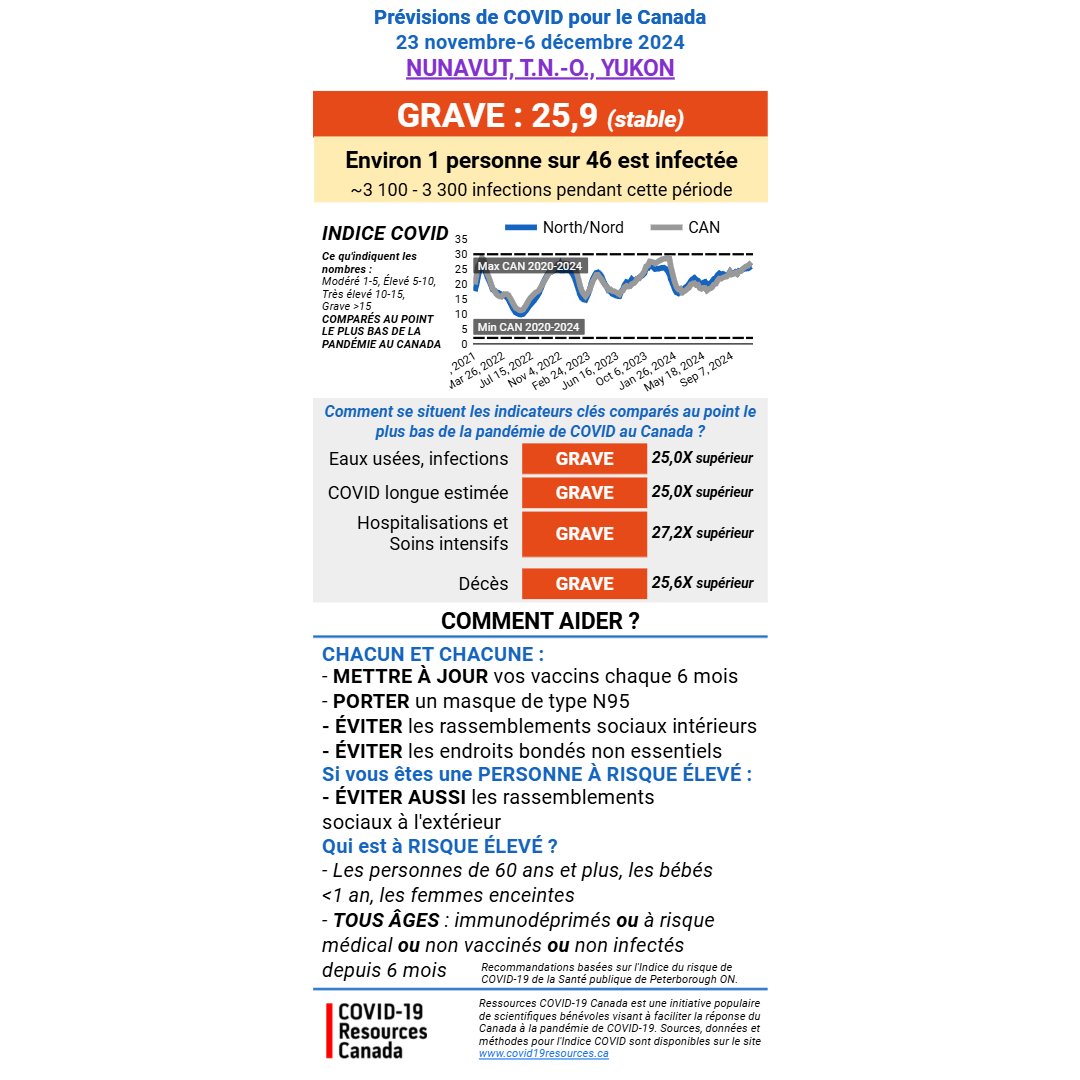
Prévisions de COVID pour le Canada : NOV 23-DÉC 6, 2024
NUNAVUT, TNO, YUKON
GRAVE (stable)
Infections pendant cette période : 3 100-3 300
Environ 1 personne sur 46 est infectée
Par rapport au point le plus bas de la pandémie au Canada :
-Infections ~25X🔺
-COVID longue ~25X🔺
-Hospitalisations ~27X🔺
-Décès ~26X🔺
NUNAVUT, TNO, YUKON
GRAVE (stable)
Infections pendant cette période : 3 100-3 300
Environ 1 personne sur 46 est infectée
Par rapport au point le plus bas de la pandémie au Canada :
-Infections ~25X🔺
-COVID longue ~25X🔺
-Hospitalisations ~27X🔺
-Décès ~26X🔺
L’aperçu national sur la COVID-19 au Canada se trouve ici :
https://x.com/MoriartyLab/status/1861201990279196927
Pour obtenir des liens vers des ressources, des explications sur les méthodes de prévision et des prévisions passées, veuillez consulter notre fil de discussion épinglé ici :
https://x.com/MoriartyLab/status/1753992466825347172
N'oubliez pas que les prévisions reflètent non seulement les données récentes, mais aussi les chiffres attendus pour les deux semaines à venir, sur la base des tendances moyennes sur cinq semaines.
La prochaine prévision sera disponible le 8 décembre 2024.
Merci à @netgaines @CircaLiz @BattlingBeaver @truthseeker_dl @Allene__Scott pour la saisie des données, les graphiques, et la traduction.
Merci à toute l'équipe de @covid_19_canada pour les commentaires hebdomadaires et pour la poursuite de notre travail.
#EnsembleNousPouvons
@threadreaderapp unroll
• • •
Missing some Tweet in this thread? You can try to
force a refresh