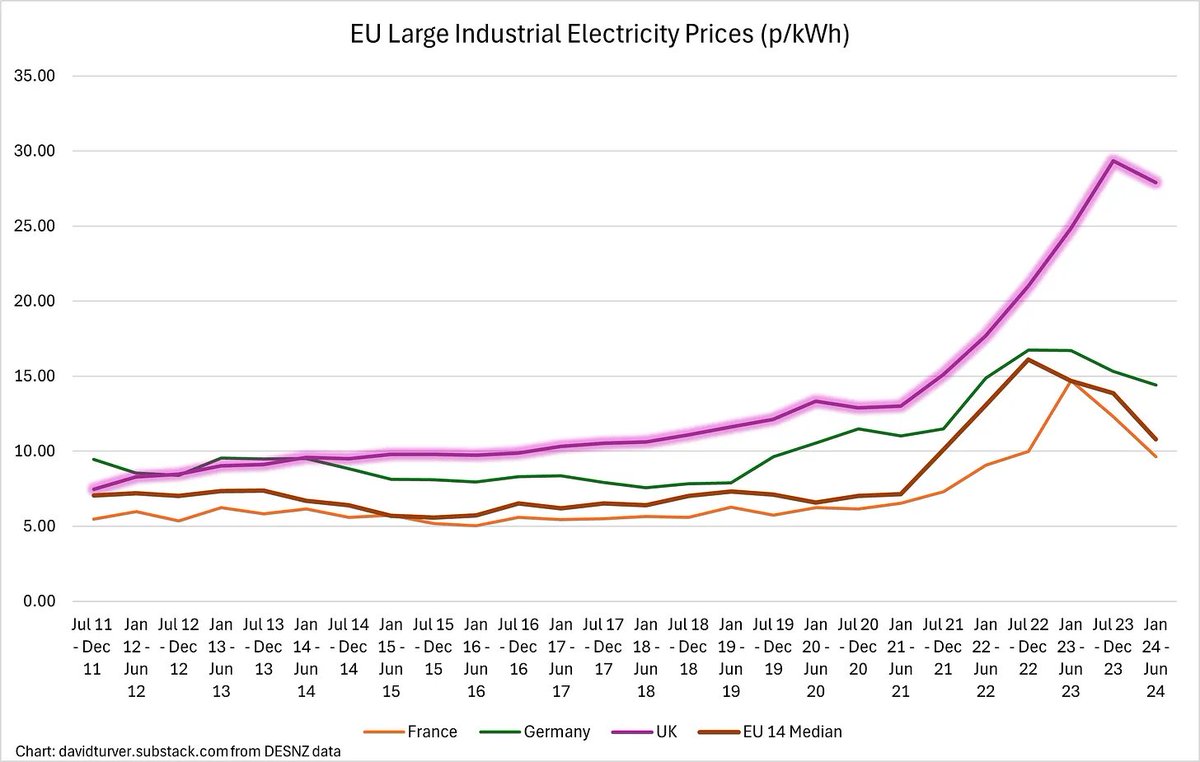
New data came out yesterday comparing energy prices across Europe for Jan-Jun 2024. The UK has by far the highest industrial electricity prices in Europe. This thread explores why that might be and how we fare in domestic markets too. (1/n)
For medium UK industrial users, prices are 188% higher than the EU14 median. For large & v large users the relative position is worse with UK prices >150% above EU14 median prices. Bear in mind, in 2023 UK prices were also 4X those of the US & 2.6X Korea. (2/n)
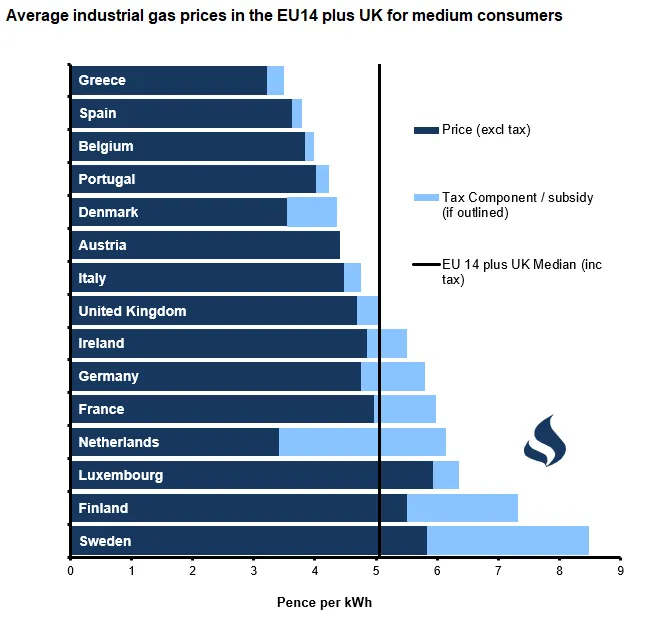
Renewables advocates always blame gas for our high prices. But UK industrial gas prices are around the EU14 median. This looks OK, until you realise that UK gas prices are some 5X those in the US & Canada (3/n)
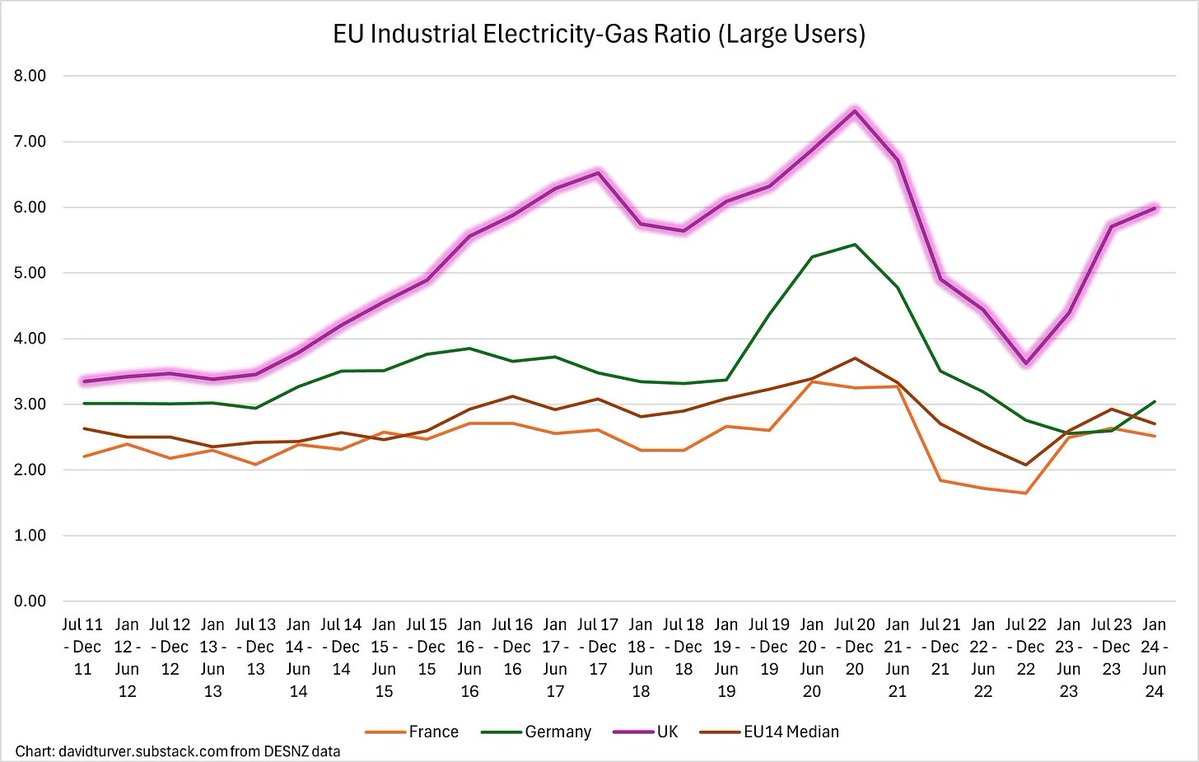
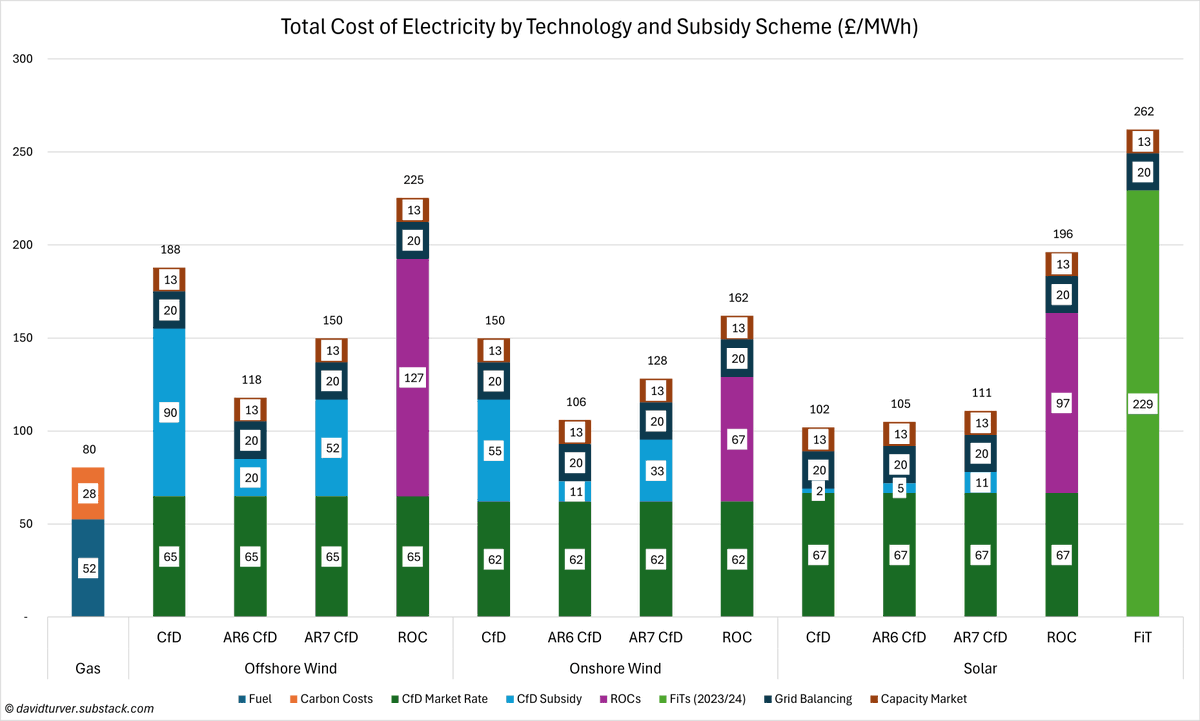
The UK electricity to gas price ratio at 6 is much higher than the EU14 median. It can't be gas driving electricity prices. Renewables subsidies and their associated costs such as grid balancing, capacity market, storage, grid expansion + carbon taxes must be the culprit (4/n)
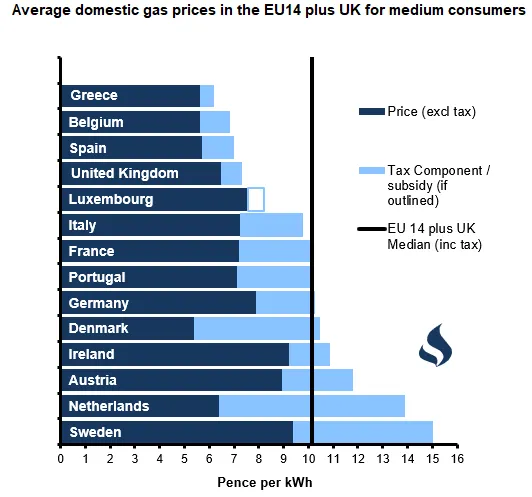
We fare much better on domestic gas prices with UK well below the UK median (5/n)
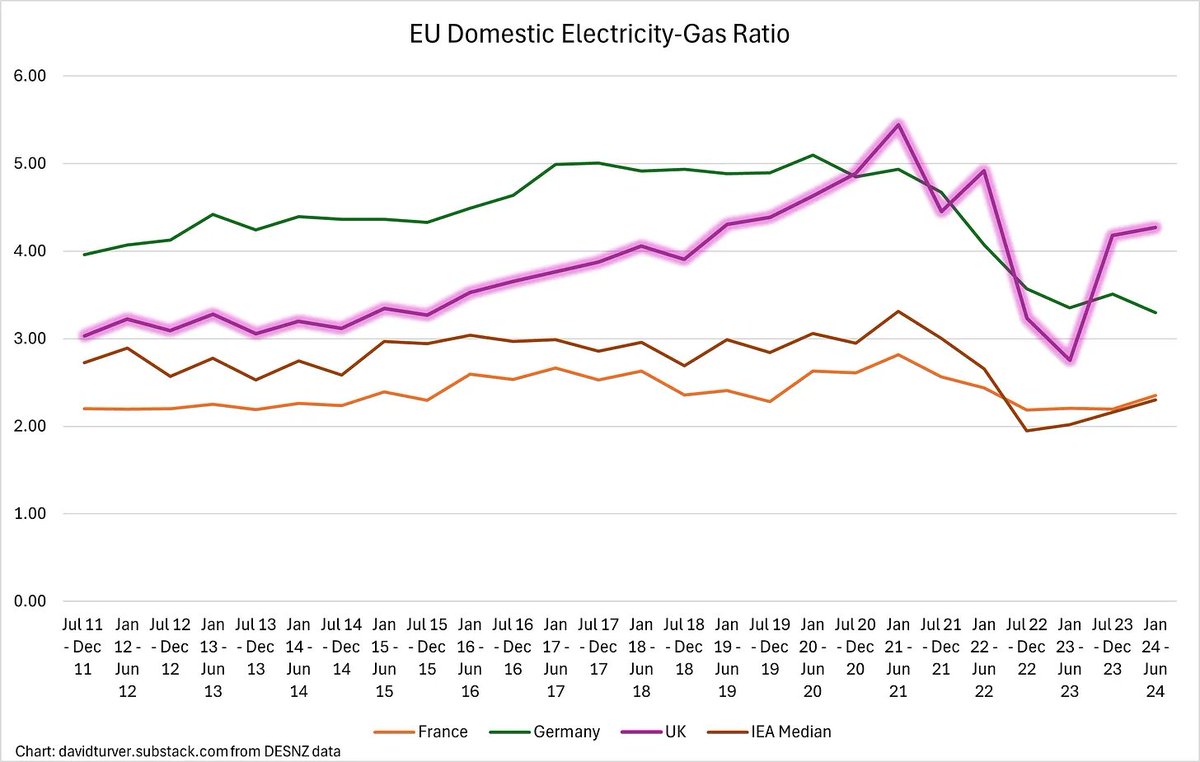
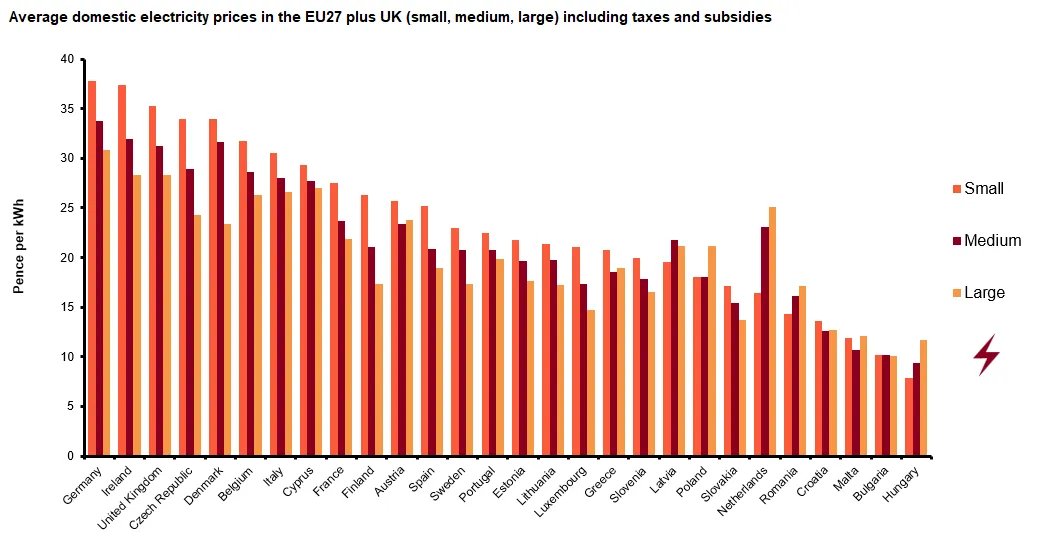
But domestic electricity prices are the third most expensive, behind Germany and Ireland (6/n)
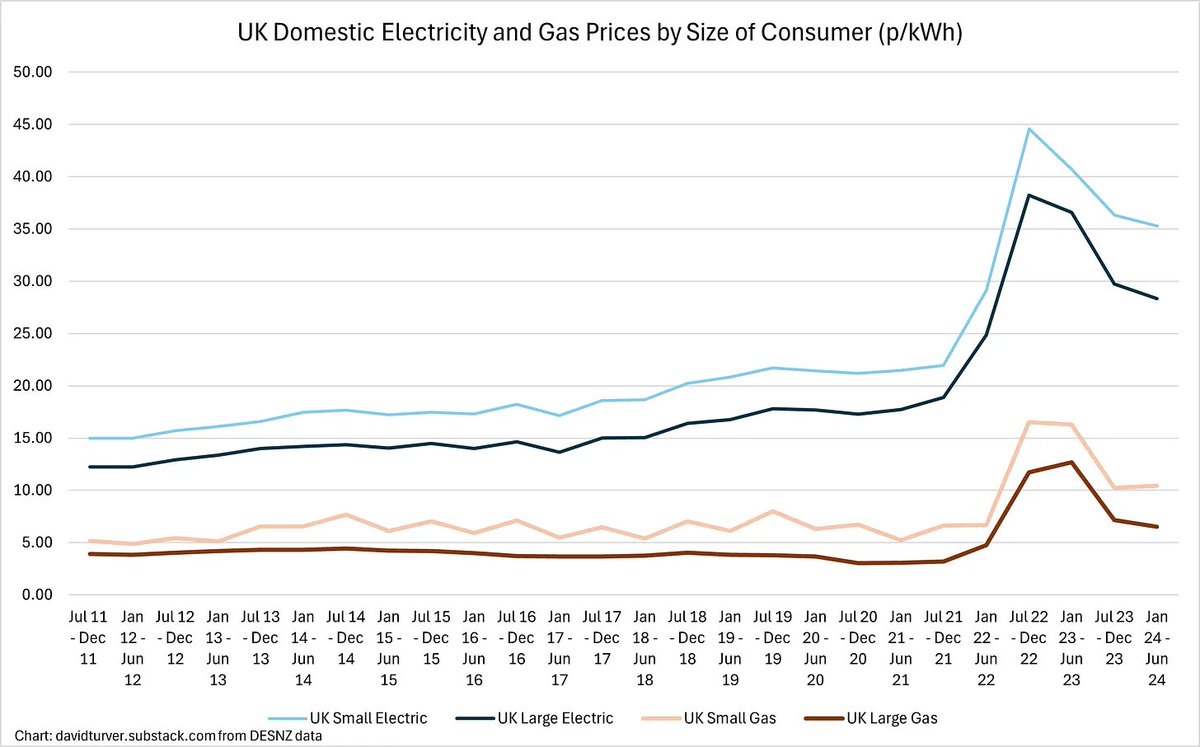
Domestic electricity costs >4X domestic gas, whereas the EU14 median for the ratio is just over 2. Again, it's not gas driving UK electricity prices (7/n)
The gap between prices for small and large domestic users of both gas and electricity is widening, indicating the poor are paying much more for their electricity through high standing charges, a great deal of which is extra network costs to connect remote renewables (8/n).
We cannot go on like this. Such expensive energy is an existential threat to the economy. Successive governments have claimed to be "climate leaders" but instead we are winning the gold medal in the electricity price Olympics. We need to ditch Net Zero now. (9/n)
If you enjoyed this thread please like, share and sign up for free to read the full article here (10/10):
COP29 has finished with an agreement to provide $300bn/yr of public funds, up from $100bn/yr but much less than the demand of $1trn/yr. Starmer has also committed UK to an emissions cut of 81% by 2035. Just how effective are these COP meetings? A thread 🧵(1/n)
First up, global emissions have soared off the chart, so the $100bn/yr has made no difference. Last year emissions rose by more than UK emissions that now make up just 0.81% of the total. (2/n)
Digging into per capita emissions, UK now emits just more than half China emissions per person. UK emissions now lower than the global average too. Miliband might claim global climate leadership, but the world isn't following. (3/n)
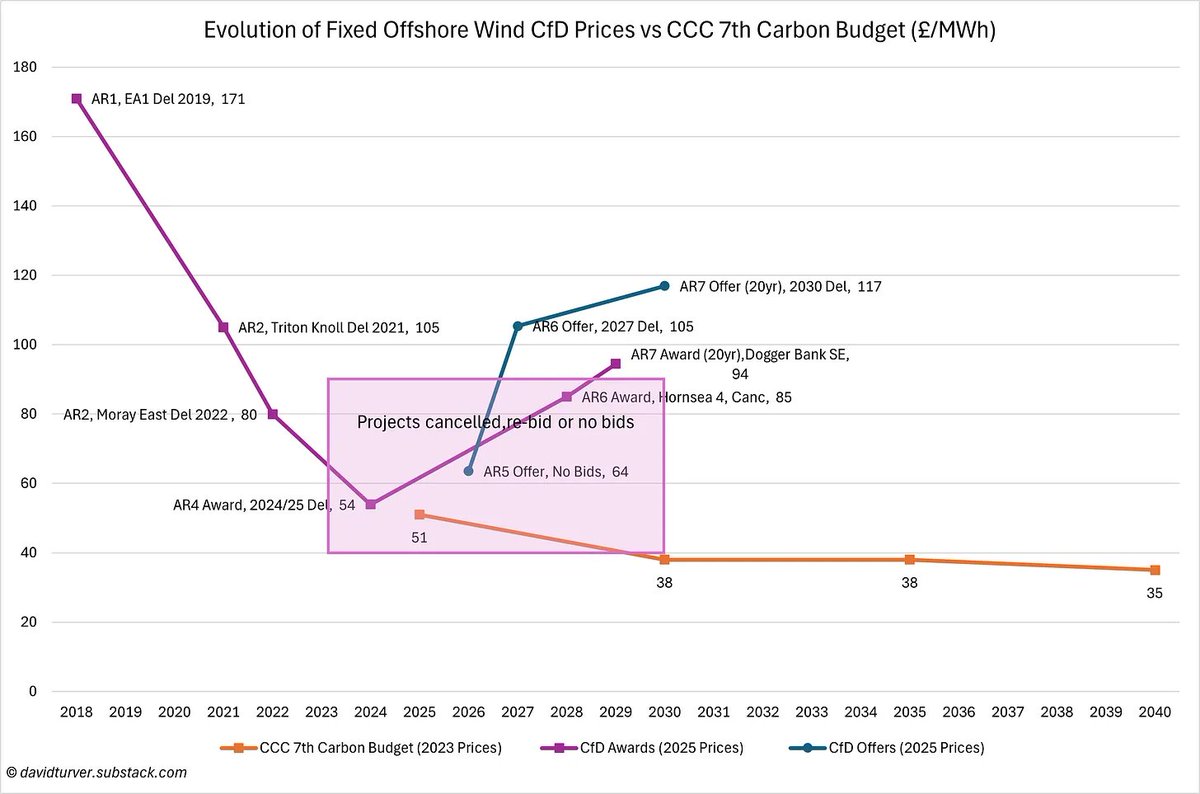
Let's start by looking at offshore wind. You may CfDs were awarded to 7GW of offshore wind projects in AR4 and this was hailed as a great victory and there were claims that wind was 9 times cheaper than gas (2/n)
Of those 7GW, there have been 2.7GW of capacity reductions & 1.4GW of contracts have been terminated leaving just 2.9GW in progress with none yet in operation. Some of the capacity reductions (e.g. Hornsea Project 3) have been awarded new contracts at higher prices (3/n)
We hear that the "climate crisis" is urgent & cannot wait for nuclear power to come online because renewables are so quick to deploy, but permitting is an issue. But is it really true? Prepare to be enlightened (1/n)
The Renewable Energy Planning Database (REPD) lists 1,000's of renewables projects dating back decades. Looking at the projected granted permission from 2008 to 2020 we can select those that haven't started construction and not operational (see above) (2/n)
4.6GW of onshore wind projects granted planning permission are yet to start construction. Some 237 projects in total. For130 of them planning permission appears to have expired. A further 48 have no planning expiry date but permission expired >4 years ago. (3/n)
A new paper demonstrates that when it comes to Net Zero, our think tanks all think alike. But when everyone is thinking alike, no one is thinking at all. Time to make think tanks think again. A thread 🧵(1/n)
The paper in question comes from @CPSThinkTank. It accepts the premise of Net Zero and claims that if we tinker with it using the 20 ideas in the paper, we can make Net Zero palatable (2/n)
First, they want to decouple gas from electricity markets without explaining how that would be done. The paper is seemingly unaware that CfDs and FiTs are already decoupled in that generators get the strike price regardless of wholesale prices. (3/n)
NESO's plan for a Net Zero grid by 2030 is so fantastical, it requires Mad Miliband to believe six impossible things before breakfast. A thread 🧵(1/n)
First up, we have to believe that spending £44-48bn/yr or £264-290bn by 2030 is achievable. This is over 4X the rate from 2020-2024. The Government can't fund it, and we won't stand for it in our bills (2/n)
Then they would have us believe that spending £260-290bn to deliver only an extra 11% of electricity will be cheaper. But they rely on gas prices being 30% more than OBR forecasts and the cost of carbon goes up ~4X by 2030. (3/n)
The Climate Change Committee has been in the headlines again, demanding we cut emissions by 81% from 1990 levels by 2035. What does this mean in a global context and do the proposed measures add up? A 🧵(1/n)
This chart from OWID sets global emissions in context. Global emissions have risen the UK's fell. Global emissions grew by 333m tonnes in 2022, more than the UK total of 319m tonnes. We now represent 0.86% of the global total. Claims of climate leadership are risible. (2/n)
If we hit the CCC's target, UK emissions will be 0.3% of the 2022 total. A rounding error. The CCC's claim to be following the latest science is ridiculous. (3/n)