beowulf888 Profile picture
Dec 2 16 tweets 5 min read Read on X
48-1/ COVID update for epidemiological weeks 47-48 of 2024—but since this is the season of URT infections, and COVID-19 is on hiatus, this week's update will also look at the other respiratory viruses that are making us sick at the moment.
48-2/ Today is the fifth anniversary of the COVID-19 pandemic. The symptoms of patient zero, a 55-year-old male, began on 1 December 2019. He wasn't hospitalized until the following 8 Dec. But by the end of Dec, 41 people were hospitalized with a novel form of pneumonia. Image
48-3/ On 28 Dec 2019, Dr. Lili Ren, a virologist at Union Medical College in Beijing submitted a complete sequence of SARS-CoV-2 to GenBank, but it failed to include the proper annotations & wasn't made public. Not until 10 Jan that a sequence was available on GenBank & GISAID.
48-4/ Initially, the virus was christened 2019-nCoV (short for "2019 Novel Coronavirus").
.
The name SARS-CoV-2 (short for "Severe Acute Respiratory Syndrome Coronavirus 2") was officially assigned by the International Committee on Taxonomy of Viruses (ICTV) on February 11, 2020
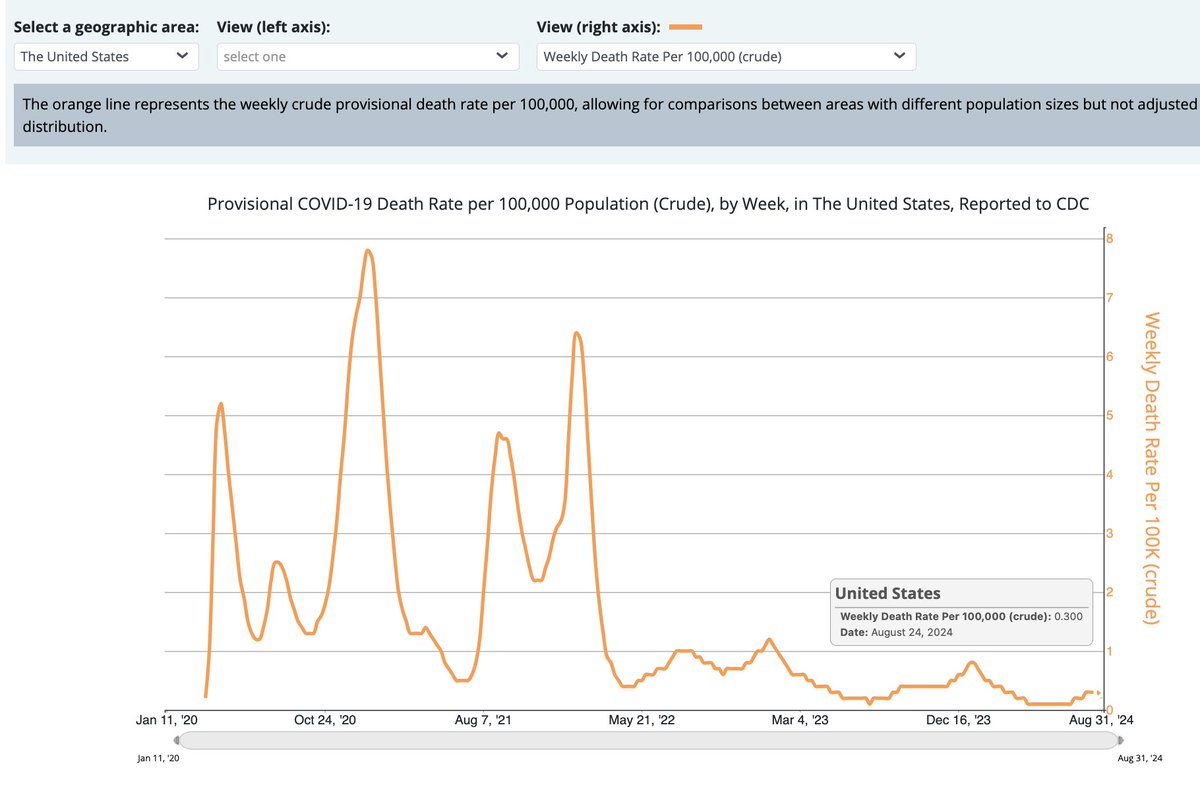
48-5/ Of course, SARS2 quickly became a worldwide pandemic. Official deaths totaled 7 million over the first 4 years. However, excess deaths suggest that COVID cases and deaths were undercounted and that actual deaths were between 19 and 36 million. Image
Image
48-6/ Vaccines and convalescent immunity have turned SARS-CoV-2/COVID-19 into an endemic disease. COVID is now killing fewer people than Malaria is—and, in the US, it's dropped to 14th place on the CDC's top 15 causes of death. Image
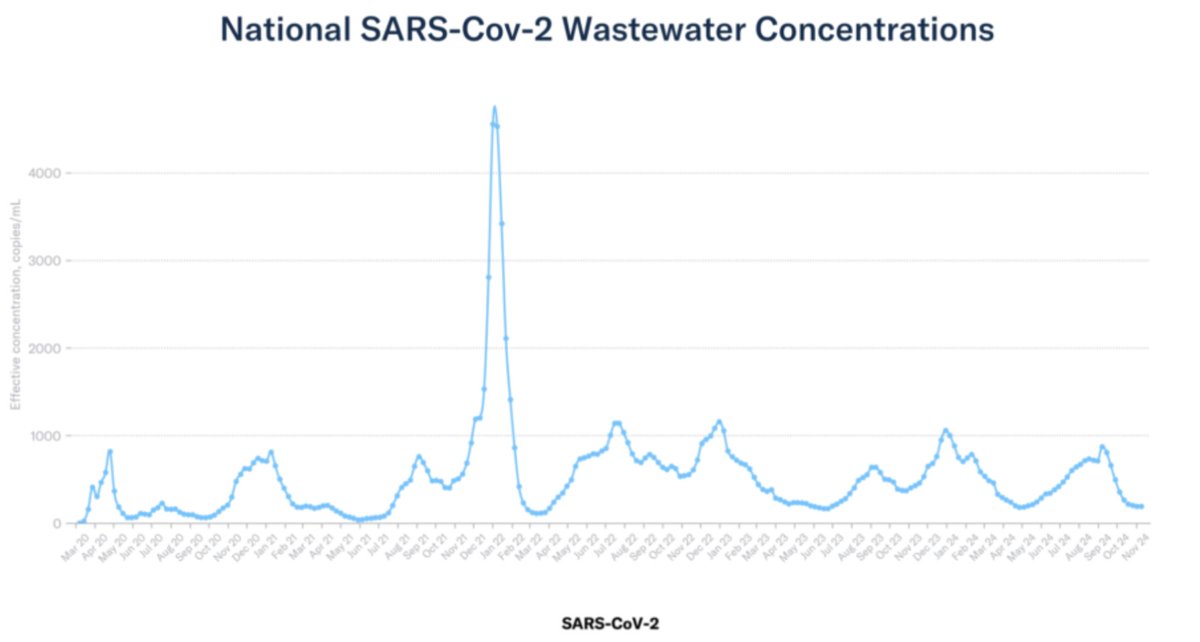
48-7/ Although there's a steady background rate of infections, COVID is mostly on hiatus in the US. Biobot's wastewater numbers show COVID is at it's usual post-Omicron interwave low. ED visits, hospitalizations, and deaths are at all very low. Image
Image
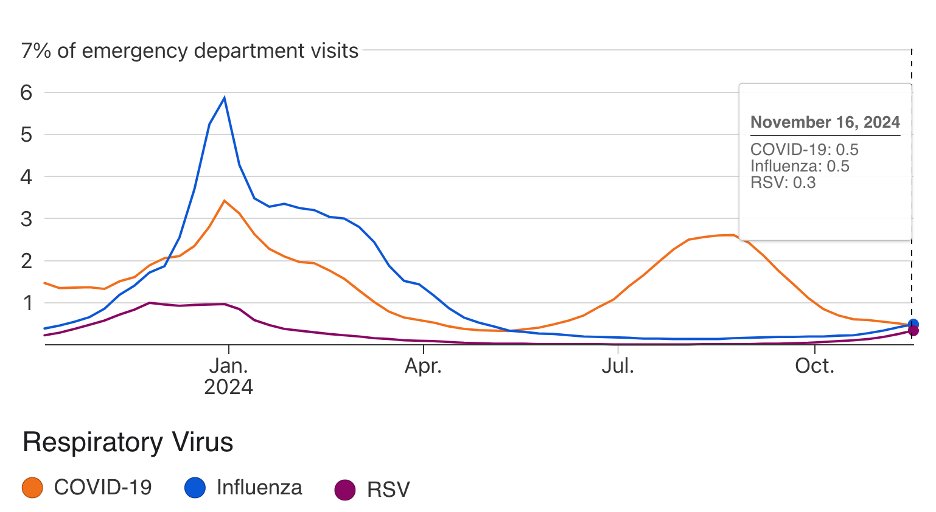
48-8/ Although the last data from the CDC is 16 Nov, as a percentage of emergency department visits, influenza probably surpassed COVID last week. RSV is on the upward trend, too. Image
48-9/ Biofire's proprietary Syndromic Trends application tells a somewhat different story. Of the top 6 respiratory viruses, RSV is on a steep upward curve. And Rhinoviruses are surging. COVID may be showing a slight upward incline. But OC-43 has shown a steep increase, too. Image
48-10/ I was curious what Biofire had to say about other Coronaviruses. NL63 and HKU1 are also on the rise. Image
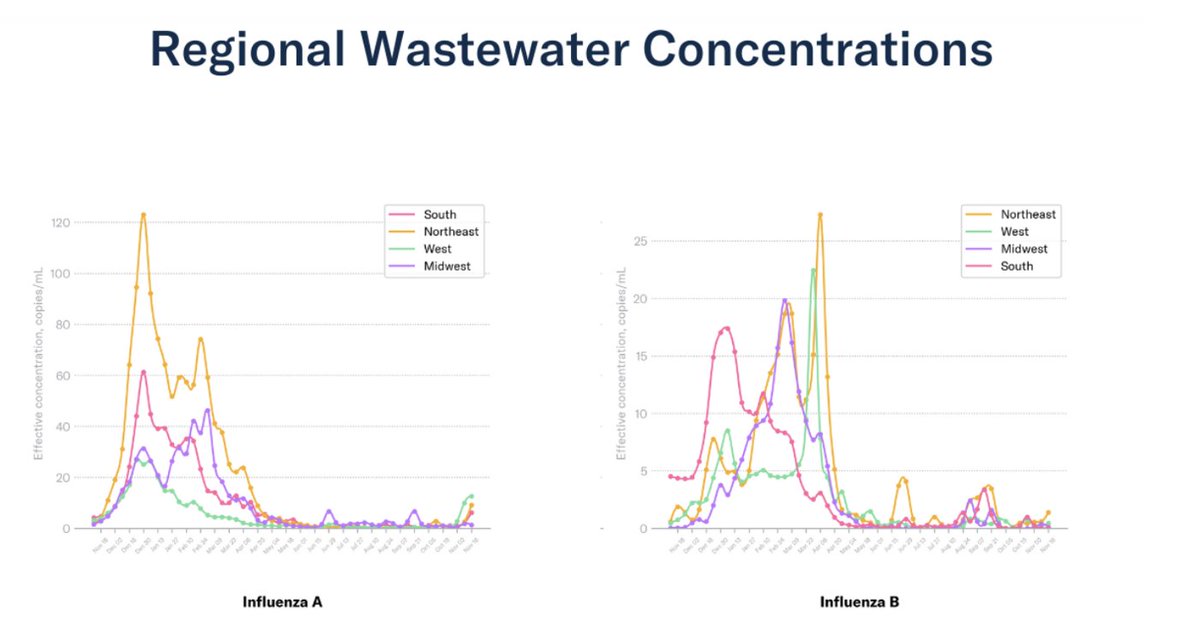
48-11/ After starting about a month late this year, flu season is revving up. Biobot shows upticks influenza A and B in wastewater. Image
Image
48-12/ And in A(H5) news, although there have been no known human cases of bird flu due to drinking raw milk (or pasteurized milk, for that matter), H5N1 was detected in a raw milk producer's products. CA banned their distribution.
latimes.com/environment/st…
48-13/ And Canadian health officials haven't been able to trace the source of the H5N1 that infected the BC child (who has been in critical care for the past 3 weeks). The sequence is closest to an A(H5) clade found in geese, though.
cidrap.umn.edu/avian-influenz…
48-14/ I missed this story last week. A California child contracted A(H5). Symptoms were mild, though. The CDC doesn't say whether this was contracted from birds or farm animals. But I think this is the 1st non-dairy worker to catch A(H5) in US this year?

cdc.gov/media/releases…
48-15/ That's it for this update. See you in two weeks.

/end
@threadreaderapp unroll

• • •

Missing some Tweet in this thread? You can try to force a refresh
 

Keep Current with beowulf888

beowulf888 Profile picture

Stay in touch and get notified when new unrolls are available from this author!

Read all threads

This Thread may be Removed Anytime!

PDF

Twitter may remove this content at anytime! Save it as PDF for later use!

Try unrolling a thread yourself!

how to unroll video
  1. Follow @ThreadReaderApp to mention us!

  2. From a Twitter thread mention us with a keyword "unroll"
@threadreaderapp unroll

Practice here first or read more on our help page!

More from @beowulf888

Nov 19
46-1/ COVID update for epidemiological weeks 45-46 of 2024.

I wanted to move these updates over to the blue skies beyond Muskland, but ThreadReader doesn't work over there yet. Also, I bookmark a lot of interesting posts, but that's not a feature over there. So here we go...
46-2/ COVID wastewater numbers remain low, but SARS2 is still circulating. XEC's growth rate has plateaued in the US (and it might be dropping), so I don't think the next wave will be an XEC.x wave. But... Image
Image
46-3/ But Ben Murrell's model seems to indicate that XEC still has wave potential—h/t to @BenjMurrell (at least, I think that's his TwiXter handle). Cov-Spectrum shows It's taking off in the UK and Germany. But UK cases are still dropping. From this, I conclude that XEC is... Image
Image
Image
Read 26 tweets
Nov 4
44-1/ COVID update for epidemiological weeks 43-44 of 2024.
National COVID wastewater numbers dropped fast, but have probably leveled out. From the 1 Nov Biobot report... Image
Image
44-2/ I'll point out again: COVID interwave ww concentrations are order of magnitude higher than flu and RSV ww concentrations (peak Flu A is that little red X under COVID)—perhaps due to differences in their viral shedding? But SARS2 is always circulating relatively high levels. Image
44-3/ I point this out because SARS2 is behaving differently from other respiratory viruses, and its continued transmission during the interwave periods may contribute to its a-seasonal behavior.
Read 34 tweets
Oct 22
42-1/ COVID update for epidemiological weeks 41-42 of 2024.

COVID is down down down—at least in the US. And my bad, Biobot hasn't switched to a monthly report. They still seem to be reporting weekly. My neuro-atypical mind missed the dropdown report menu button. Image
Image
42-2/ COVID ED visits are following the downward wastewater trend. Although there may be delays in tabulation, weekly deaths (per 100k) may clock in at the lowest any time since the start of the pandemic. Hospitalizations dropping, too. Image
Image
42-3/ Lots of scary stories in the MSM that XEC will bring on the next COVID wave RSN (Real Soon Now). Its frequency is growing, but so far it hasn't stopped the downward trend in cases (at least in the US). Its frequency *is* growing fast, though. Image
Image
Read 12 tweets
Oct 7
40-1/ COVID update for epidemiological weeks 37-40 of 2024. Note: I skipped my last biweekly update for personal reasons. This will summarize the past month of COVID activity—plus some updates on H5N1 and some other pathogens of concern.

So, back to the COVID data mines...
40-2/ The KP.3.x wave is receding. Biobot released their update for September (I guess they're only publishing monthly updates now). Their data indicates that the SARS2 wastewater activity is still high but falling. However... Image
Image
40-3/ ...if we look at the three largest cities in the US (NY, LA, and Chicago), the viral CpmL concentrations are almost back to usual interwave levels. O/c Biobot utilizes sewersheds from all over the US, and we've seen that COVID waves don't peak synchronously across counties. Image
Image
Image
Read 33 tweets
Sep 10
36-1/ COVID update for epidemiological weeks 35-36 of 2024.

Biobot hasn't released a new report in 4 wks. I'll use the CDC wastewater chart even though I think it runs "hot" compared to Biobot. With the exception of the Midwest the KP wave peaked the 1st or 2nd week of Aug. Image
36-2/ ED visits seem to have peaked as well—although the 5-17 age cohort is lagging other age groups—probably due to the opening of schools across the US. But crude death rate rose to .3/100K the 3rd week of August. They may be dropping now (or not yet).
Image
Image
36-3/ Age-adjusted deaths look a little better at .2/100K, but IMHO a death is a death. When referring to US death rates, from here on out I will only use the crude death rate. Age-adjustment is useful for comparing how we do against other countries w/ different demographics. Image
Read 15 tweets
Aug 26
34-1/ COVID update for epidemiological weeks 33-34 of 2024.

Were the Paris Olympics a superspreader event? Lots of claims that it was—but I can't find any data to support this. As of week 33 France's Sentinelles network shows Paris region's cases falling for last 8 weeks. Image
34-2/ O/c, Sentinelle tracks aggregated ARI numbers—COVID isn't broken out of the stats—but if COVID cases had increased due to the Olympics, they weren't high enough to impact the overall ARI numbers. Worth noting that the summer KP.x wave seems to have minimally affected FR. Image
34-3/ And was the DNC in Chicago a superspreader event? Several DNC attendees tweeted pics of positive COVID tests and they set off a meme stampede that the DNC was a superspreader event. I'm still waiting for the Chicago wastewater numbers from last week. But... Image
Read 15 tweets

Did Thread Reader help you today?

Support us! We are indie developers!


This site is made by just two indie developers on a laptop doing marketing, support and development! Read more about the story.

Become a Premium Member ($3/month or $30/year) and get exclusive features!

Become Premium

Don't want to be a Premium member but still want to support us?

Make a small donation by buying us coffee ($5) or help with server cost ($10)

Donate via Paypal

Or Donate anonymously using crypto!

Ethereum

0xfe58350B80634f60Fa6Dc149a72b4DFbc17D341E copy

Bitcoin

3ATGMxNzCUFzxpMCHL5sWSt4DVtS8UqXpi copy

Thank you for your support!

Follow Us!

:(