
PMC COVID-19 Forecasting Model, Dec 9, 2024
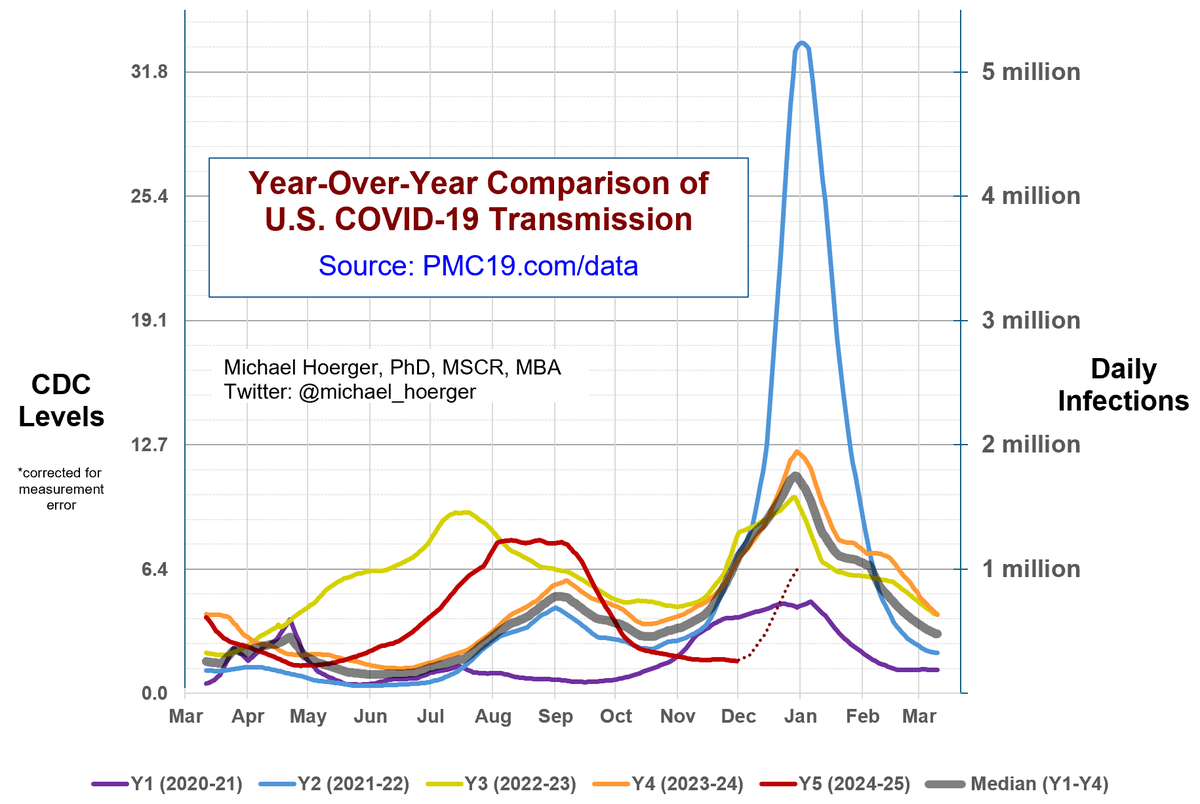
My over/under for how many daily Covid infections the U.S. will see by the end of the year is 750,000.
Our model has us hitting about 1 million daily by New Year's Eve. The model accounts for historical variation and current trends, but not the atypical state of subvariant evolution. If winter transmission picks up more like usual, such as if LP.8.1. takes off, 1 million is likely spot on.
However, if LP.8.1. does not take off, 700K is probably a better estimate. If the CDC numbers are flat next Friday, take 200k of the model's Dec peak, putting it closer to 800k. If flat in their next two reports, expect closer to 600k. These low-end predictions are greatly at odds with the prior winters of the pandemic and would support a broader change in strategy in how public health agencies advice the public on "winter virus season."
There is more uncertainty now than any time in the past 2.5 years, IMO. The data coming in are very slow, volatile to retroactive corrections, and variable by region. Examples:
🔹Biobot (20% weight in our model) did not report last Wednesday, and still has not reported.
🔹Several technical issues with the CDC dashboard (80% model weight), such as some likely minor coding errors two reports ago.
🔹Walgreens shows an increasing national average in testing positivity
🔹WastewaterSCAN shows a moderate increase in the Midwest and huge increase in the Northeast, but their estimates often change considerably in hindsight
🔹The CDC has Covid ED visits rising as of late Nov, transmission forecasted to be increasing in 28 states and declining in 3 states.
Stay tuned, and if the peak in the remainder of 2024 is at the smaller end, encourage others to track transmission more closely in early 2025, where we could see concerning transmission.
Info for new readers:
For those unfamiliar with the PMC model, find full weekly reports for the past 14+ months at pmc19.com/data
The models combine data from IHME, Biobot, and CDC to use wastewater to estimate case levels (r = .93 to .96) and forecast levels the next month based on typical levels for that date and recent patterns of changes in transmission the past 4 weeks. Our work has been cited in top scientific journals and media outlets, which are fully sourced in a detailed technical appendix at pmc19.com/data/PMC_COVID…
Examples include JAMA Onc, JAMA-NO, BMC Public Health, Time, People, TODAY, the Washington Post, the Institute for New Economic Thinking, Salon, Forbes, the New Republic, Fox, CBS, and NBC. See pgs 11-13 at the above link.
We will have a pre-print out in the next month documenting very compelling evidence for the validity of using wastewater to estimate case rates. Forecasting is challenging in the context of the current viral evolution, but the real-time estimates of cases are impressively accurate to the best we can evaluate it.
• • •
Missing some Tweet in this thread? You can try to
force a refresh


