
PMC COVID-19 Dashboard, Dec 16, 2024
🧵1 of 8
🔹1 in 64 (1.6%) actively infectious in the U.S.
🔹750,000 new daily infections and rising
🔹Highest % increase in transmission in nearly 3 years
🔹10th wave is the "silent surge," coming on late out of nowhere
The video will walk you through each of the graphs on the dashboard and covered in this thread.
Info for new readers:
For those unfamiliar with the PMC model, find full weekly reports for the past 14+ months at pmc19.com/data
The models combine data from IHME, Biobot, and CDC to use wastewater to estimate case levels (r = .93 to .96) and forecast levels the next month based on typical levels for that date and recent patterns of changes in transmission the past 4 weeks.
Our work has been cited in top scientific journals and media outlets, which are fully sourced in a detailed technical appendix at pmc19.com/data/PMC_COVID…
Examples include JAMA Onc, JAMA-NO, BMC Public Health, Time, People, TODAY, the Washington Post, the Institute for New Economic Thinking, Salon, Forbes, the New Republic, Fox, CBS, and NBC. See pgs 11-13 at the above link.
We will have a pre-print out in the next month documenting very compelling evidence for the validity of using wastewater to estimate case rates. Forecasting is challenging in the context of the current viral evolution, but the real-time estimates of cases are impressively accurate to the best we can evaluate it.
PMC COVID-19 Dashboard, Dec 16, 2024
🧵2 of 8
🔹10th wave taking off (U.S.)
🔹5 million infections expected this week
🔹>250,000 post-infection conditions (#LongCovid) expected to develop from this week's infections
🔹Higher transmission than 73% of the pandemic
Info for new readers (as noted in Tweet 1):
For those unfamiliar with the PMC model, find full weekly reports for the past 14+ months at pmc19.com/data
The models combine data from IHME, Biobot, and CDC to use wastewater to estimate case levels (r = .93 to .96) and forecast levels the next month based on typical levels for that date and recent patterns of changes in transmission the past 4 weeks.
Our work has been cited in top scientific journals and media outlets, which are fully sourced in a detailed technical appendix at pmc19.com/data/PMC_COVID…
Examples include JAMA Onc, JAMA-NO, BMC Public Health, Time, People, TODAY, the Washington Post, the Institute for New Economic Thinking, Salon, Forbes, the New Republic, Fox, CBS, and NBC. See pgs 11-13 at the above link.
We will have a pre-print out in the next month documenting very compelling evidence for the validity of using wastewater to estimate case rates. Forecasting is challenging in the context of the current viral evolution, but the real-time estimates of cases are impressively accurate to the best we can evaluate it.

PMC COVID-19 Dashboard, Dec 16, 2024
🧵3 of 8
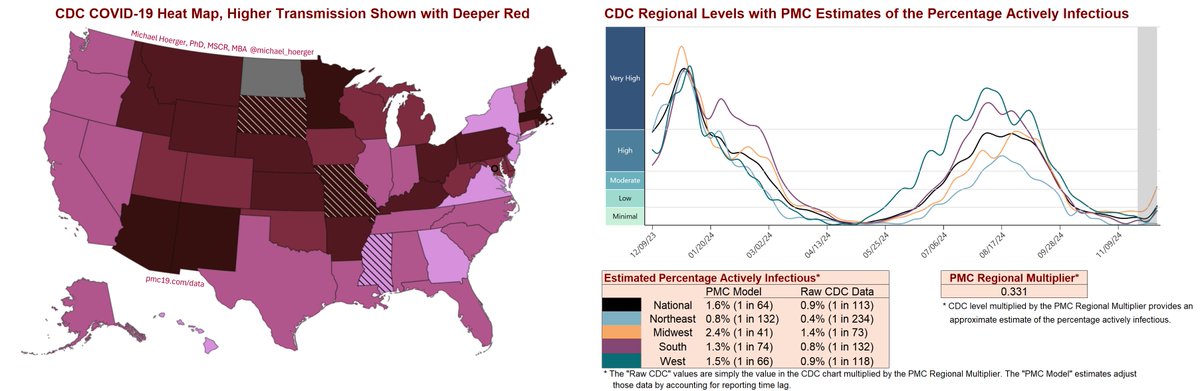
Areas of the U.S. depicted in darker red have higher transmission, as of 9 days ago. The map uses CDC data and is simply the CDC "cool blue" map recolored in more traditional red, which is best practices.
The line graph shows transmission increasing by region.
CDC map:
cdc.gov/nwss/rv/COVID1…
CDC regional graph:
cdc.gov/nwss/rv/COVID1…
Info for new readers (as noted in Tweet 1):
For those unfamiliar with the PMC model, find full weekly reports for the past 14+ months at pmc19.com/data
The models combine data from IHME, Biobot, and CDC to use wastewater to estimate case levels (r = .93 to .96) and forecast levels the next month based on typical levels for that date and recent patterns of changes in transmission the past 4 weeks.
Our work has been cited in top scientific journals and media outlets, which are fully sourced in a detailed technical appendix at pmc19.com/data/PMC_COVID…
Examples include JAMA Onc, JAMA-NO, BMC Public Health, Time, People, TODAY, the Washington Post, the Institute for New Economic Thinking, Salon, Forbes, the New Republic, Fox, CBS, and NBC. See pgs 11-13 at the above link.
We will have a pre-print out in the next month documenting very compelling evidence for the validity of using wastewater to estimate case rates. Forecasting is challenging in the context of the current viral evolution, but the real-time estimates of cases are impressively accurate to the best we can evaluate it.
🧵3 of 8
Areas of the U.S. depicted in darker red have higher transmission, as of 9 days ago. The map uses CDC data and is simply the CDC "cool blue" map recolored in more traditional red, which is best practices.
The line graph shows transmission increasing by region.
CDC map:
cdc.gov/nwss/rv/COVID1…
CDC regional graph:
cdc.gov/nwss/rv/COVID1…
Info for new readers (as noted in Tweet 1):
For those unfamiliar with the PMC model, find full weekly reports for the past 14+ months at pmc19.com/data
The models combine data from IHME, Biobot, and CDC to use wastewater to estimate case levels (r = .93 to .96) and forecast levels the next month based on typical levels for that date and recent patterns of changes in transmission the past 4 weeks.
Our work has been cited in top scientific journals and media outlets, which are fully sourced in a detailed technical appendix at pmc19.com/data/PMC_COVID…
Examples include JAMA Onc, JAMA-NO, BMC Public Health, Time, People, TODAY, the Washington Post, the Institute for New Economic Thinking, Salon, Forbes, the New Republic, Fox, CBS, and NBC. See pgs 11-13 at the above link.
We will have a pre-print out in the next month documenting very compelling evidence for the validity of using wastewater to estimate case rates. Forecasting is challenging in the context of the current viral evolution, but the real-time estimates of cases are impressively accurate to the best we can evaluate it.
PMC COVID-19 Dashboard, Dec 16, 2024
🧵4 of 8
The year-over-year graph shows how atypical the present winter wave is, especially with the extended late lull, which creates uncertainty.
The forecast anticipates 1.3 million daily infections as we enter 2025. This is an increase relative to last week's forecast, largely because of the sudden steep increase in transmission, the highest % increase in nearly 3 years.
The best-case scenario would be closer to 800,000 daily. There could be retroactive downward corrections to the most recent data. Biobot (20% of model weight) is not reporting, and they could bring in lower numbers. Transmission could also level off atypically.
The worst-case scenario would be closer to 1.8 million daily infections. This could occur if the late-lull combines with risky population behavior for December (travel, large gatherings, more indoor time) to play "catch up." LP.8.1. could also play a factor.
Info for new readers (as noted in Tweet 1):
For those unfamiliar with the PMC model, find full weekly reports for the past 14+ months at pmc19.com/data
The models combine data from IHME, Biobot, and CDC to use wastewater to estimate case levels (r = .93 to .96) and forecast levels the next month based on typical levels for that date and recent patterns of changes in transmission the past 4 weeks.
Our work has been cited in top scientific journals and media outlets, which are fully sourced in a detailed technical appendix at pmc19.com/data/PMC_COVID…
Examples include JAMA Onc, JAMA-NO, BMC Public Health, Time, People, TODAY, the Washington Post, the Institute for New Economic Thinking, Salon, Forbes, the New Republic, Fox, CBS, and NBC. See pgs 11-13 at the above link.
We will have a pre-print out in the next month documenting very compelling evidence for the validity of using wastewater to estimate case rates. Forecasting is challenging in the context of the current viral evolution, but the real-time estimates of cases are impressively accurate to the best we can evaluate it.

PMC COVID-19 Dashboard, Dec 16, 2024
🧵5 of 8
I offered a sneak peek earlier. Here's what to expect on Christmas Day if the model holds. We will update as data come in. Vaccinations, masking, air purifiers, & serial pooled rapid testing reduce risk.
🧵5 of 8
I offered a sneak peek earlier. Here's what to expect on Christmas Day if the model holds. We will update as data come in. Vaccinations, masking, air purifiers, & serial pooled rapid testing reduce risk.
https://x.com/michael_hoerger/status/1868407551878152519
PMC COVID-19 Dashboard, Dec 16, 2024
🧵6 of 8
Covid transmission is projected to be very high around New Year's Eve.
At a party of 25 without testing or isolation, it's a coin toss of getting a Covid exposure.
Flight? All but guaranteed.
✅Vax
✅Mask
✅Air purifiers
✅Test
✅Reduce contacts.
Info for new readers (as noted in Tweet 1):
For those unfamiliar with the PMC model, find full weekly reports for the past 14+ months at pmc19.com/data
The models combine data from IHME, Biobot, and CDC to use wastewater to estimate case levels (r = .93 to .96) and forecast levels the next month based on typical levels for that date and recent patterns of changes in transmission the past 4 weeks.
Our work has been cited in top scientific journals and media outlets, which are fully sourced in a detailed technical appendix at pmc19.com/data/PMC_COVID…
Examples include JAMA Onc, JAMA-NO, BMC Public Health, Time, People, TODAY, the Washington Post, the Institute for New Economic Thinking, Salon, Forbes, the New Republic, Fox, CBS, and NBC. See pgs 11-13 at the above link.
We will have a pre-print out in the next month documenting very compelling evidence for the validity of using wastewater to estimate case rates. Forecasting is challenging in the context of the current viral evolution, but the real-time estimates of cases are impressively accurate to the best we can evaluate it.

PMC COVID-19 Dashboard, Dec 16, 2024
🧵7 of 8
If you have used our Covid dashboard on the website or social media in the past year, please complete our quick survey.
tulane.co1.qualtrics.com/jfe/form/SV_0o…
Results will support a fast-track grant resubmission by showing that this information informs decision making. The grant is specifically intended to fund Covid mitigation supplies (educational booklets, masks, DIY fit-testing kits, air purifiers, Covid tests) to people with cancer who are at very high risk of severe outcomes from Covid infections. It's the COVI-CAN 3 study.
In talking with other Covid-aware advocacy groups, we believe the survey will also provide great preliminary data for other project proposals, so please reach out if we can be of help to your cause. 🙏

PMC COVID-19 Dashboard, Dec 16, 2024
🧵8 of 8
Please share the web dashboard, video, images, and summaries across all social media platforms. 🙏
With the wave coming on strong out of nowhere, we need to get the word out quickly. #SilentSurge
pmc19.com/data
🧵8 of 8
Please share the web dashboard, video, images, and summaries across all social media platforms. 🙏
With the wave coming on strong out of nowhere, we need to get the word out quickly. #SilentSurge
pmc19.com/data

• • •
Missing some Tweet in this thread? You can try to
force a refresh


