Apollo with another HUGE call today:
Not only does Apollo see less rate cuts in 2025, but they are now calling for potential rate HIKES.
Today, Apollo officially said they see a 40% chance of rate HIKES returning in 2025.
Has the "Fed pivot" been canceled again?
(a thread)
Not only does Apollo see less rate cuts in 2025, but they are now calling for potential rate HIKES.
Today, Apollo officially said they see a 40% chance of rate HIKES returning in 2025.
Has the "Fed pivot" been canceled again?
(a thread)
The Fed officially made their 3rd interest rate cut of 2024 for 25 basis points.
This marks a total of 100 basis points of rate cuts in 2024 as inflation reaccelerates.
With all key metrics of inflation nearing or above 3%, a new question arises.
Are rate hikes coming back?
This marks a total of 100 basis points of rate cuts in 2024 as inflation reaccelerates.
With all key metrics of inflation nearing or above 3%, a new question arises.
Are rate hikes coming back?

Apollo makes the case that the economy is strong and growth has been robust.
Over the past 2 quarters, US GDP growth has been 3.0% and 2.8%.
The Atlanta Fed expects GDP growth in the fourth quarter to be 3.2%, well above the CBO’s 2% estimate of long-run US growth.
Over the past 2 quarters, US GDP growth has been 3.0% and 2.8%.
The Atlanta Fed expects GDP growth in the fourth quarter to be 3.2%, well above the CBO’s 2% estimate of long-run US growth.

Apollo notes that the strong economy, combined with the potential for lower taxes, higher tariffs, and restrictions on immigration, could spark inflation.
PCE inflation could rise by over 140 basis points due to tariffs, according to Deutsche Bank.
Higher prices are coming.
PCE inflation could rise by over 140 basis points due to tariffs, according to Deutsche Bank.
Higher prices are coming.

Recent data shows that inflation is already heading higher again.
3-month annualized core CPI inflation is now back up to an alarming 4%.
6-month annualized core CPI fell to 2.5% before rebounding back toward 3% now.
This is BEFORE tariffs and tax cuts are imposed.
3-month annualized core CPI inflation is now back up to an alarming 4%.
6-month annualized core CPI fell to 2.5% before rebounding back toward 3% now.
This is BEFORE tariffs and tax cuts are imposed.

PCE inflation, the Fed's preferred inflation measure, is trending sharply higher.
1-month annualized core PCE inflation is now at 3.5%+.
1-month, 3-month, and 6-month annualized core PCE inflation are ALL back on the rise here.
Tomorrow's data will show November's numbers.
1-month annualized core PCE inflation is now at 3.5%+.
1-month, 3-month, and 6-month annualized core PCE inflation are ALL back on the rise here.
Tomorrow's data will show November's numbers.

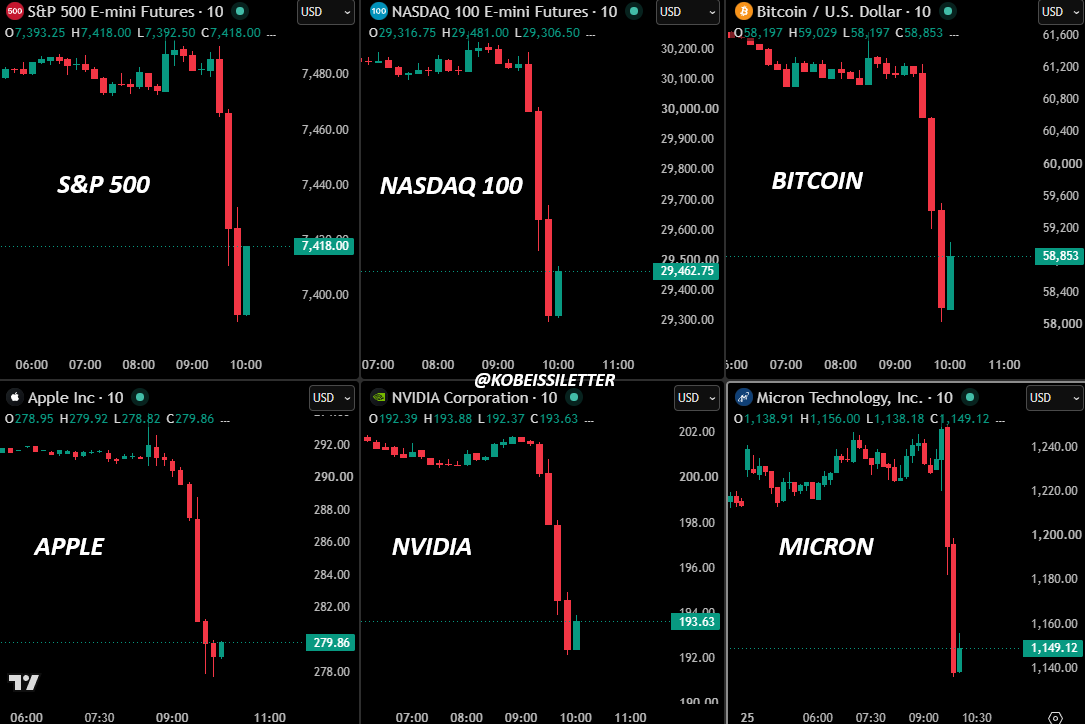
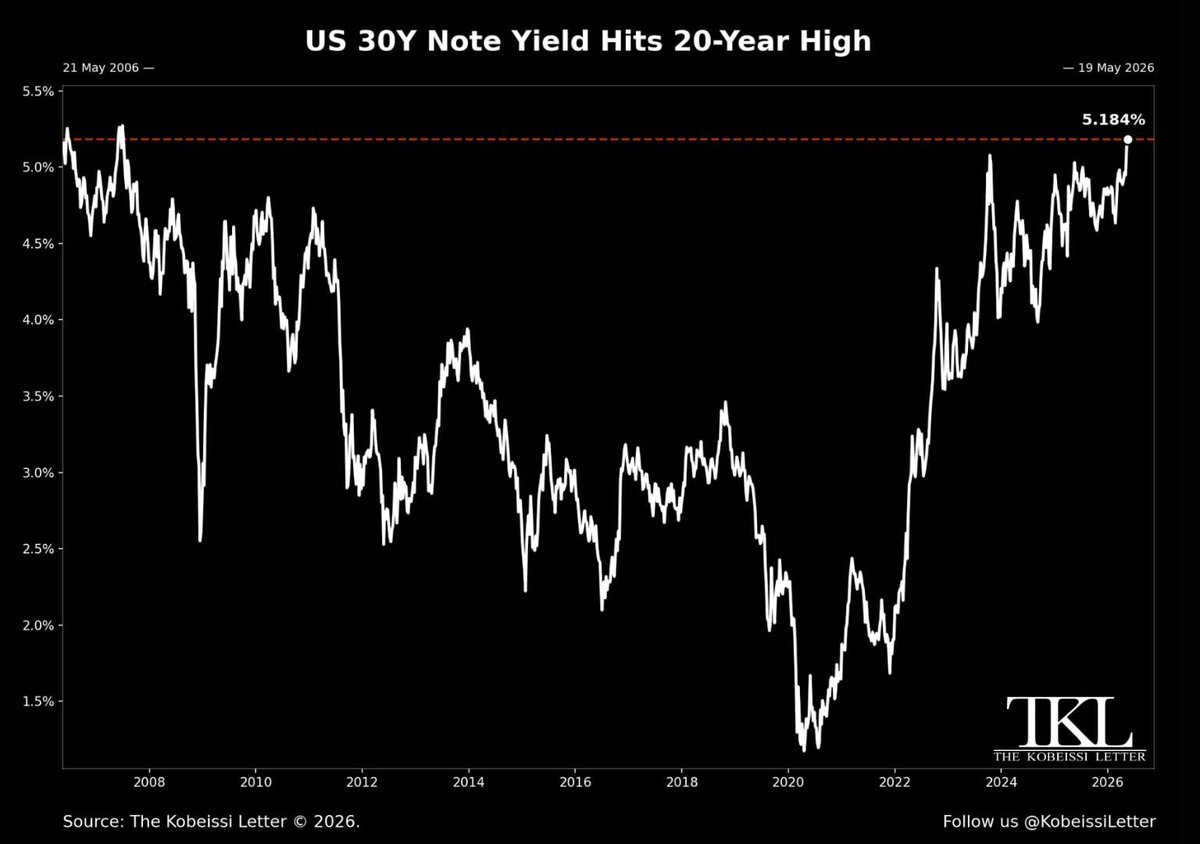
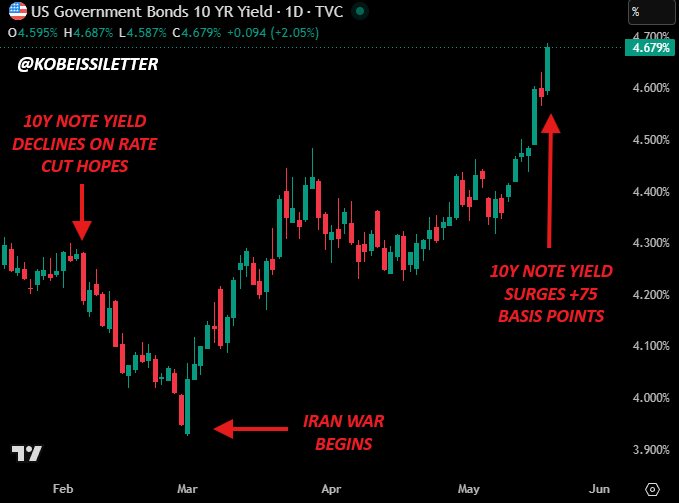
Meanwhile, bond markets are trading like rate hikes already started.
In what Fed Chair Powell has called normal market "fluctuations," something does not add up.
The 10-year note yield is now up ~90 basis points since rate cuts began in September.
Markets are not convinced.
In what Fed Chair Powell has called normal market "fluctuations," something does not add up.
The 10-year note yield is now up ~90 basis points since rate cuts began in September.
Markets are not convinced.

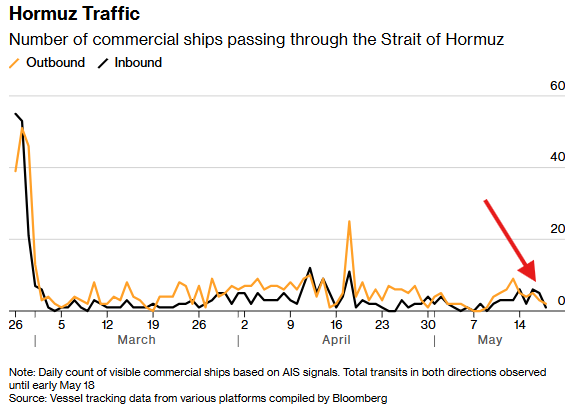
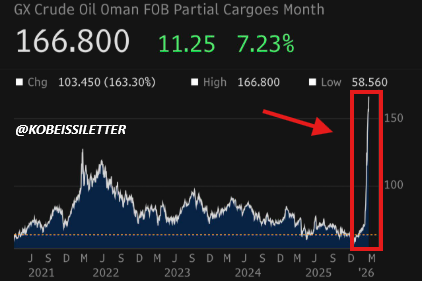
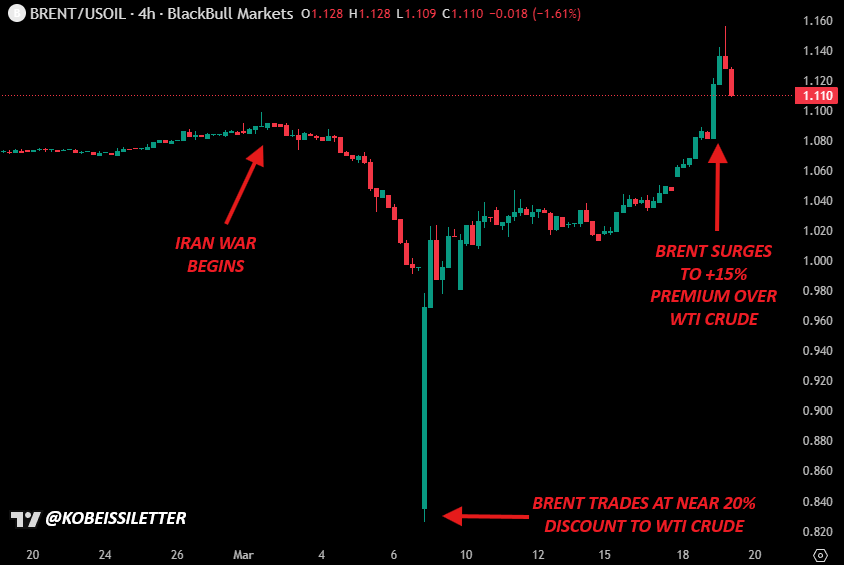
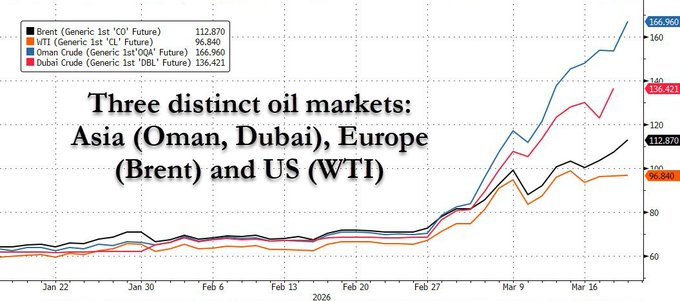
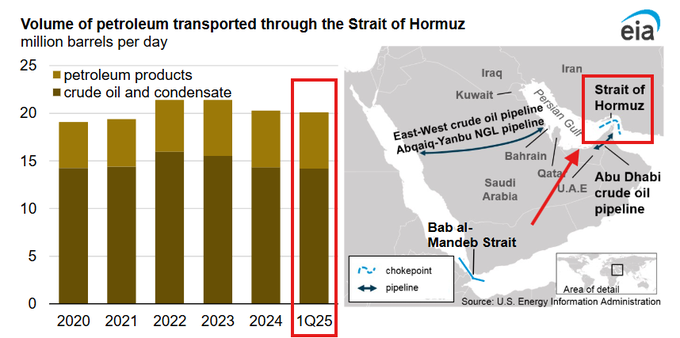
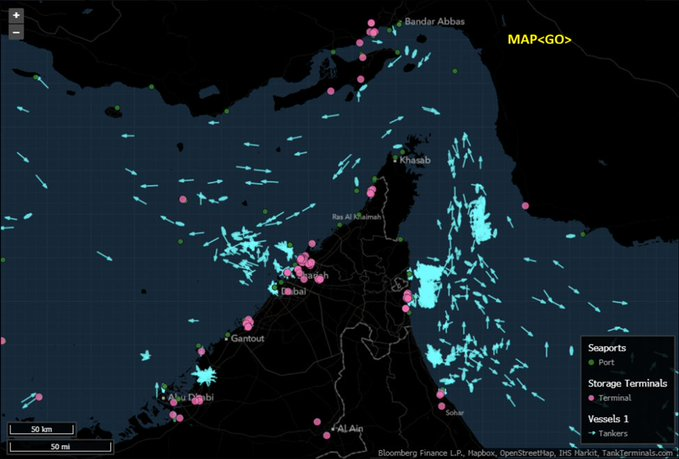
Meanwhile, oil prices are surging adding to the case for higher inflation in 2025.
Our premium clients bought the dip into $67, as shown in our alert below.
With inflation rebounding, we are trading.
Subscribe at the link below to access our analysis:
thekobeissiletter.com/subscribe
Our premium clients bought the dip into $67, as shown in our alert below.
With inflation rebounding, we are trading.
Subscribe at the link below to access our analysis:
thekobeissiletter.com/subscribe

All while the US now has a record $36.2 TRILLION of Federal Debt.
Deficit spending has been highly inflationary and this is coupled with a potential government shutdown.
Treasury yields are rising as the US government is forced to issue trillions in bonds for deficit spending.
Deficit spending has been highly inflationary and this is coupled with a potential government shutdown.
Treasury yields are rising as the US government is forced to issue trillions in bonds for deficit spending.

The Fed is clearly concerned despite the calm image they are trying to paint.
They raised their PCE inflation target from 2.1% up to 2.5% by the end of 2025.
15 out of 19 Fed officials view inflation risks weighted to the upside.
In September, just 3 officials felt this way.
They raised their PCE inflation target from 2.1% up to 2.5% by the end of 2025.
15 out of 19 Fed officials view inflation risks weighted to the upside.
In September, just 3 officials felt this way.

So, what does this all mean for investors and for your portfolio?
As we have been forecasting, we expect more volatility in 2025.
These swings will be tradable.
Subscribe now at the link below to gain instant access to our alerts and analysis:
thekobeissiletter.com/subscribe
As we have been forecasting, we expect more volatility in 2025.
These swings will be tradable.
Subscribe now at the link below to gain instant access to our alerts and analysis:
thekobeissiletter.com/subscribe
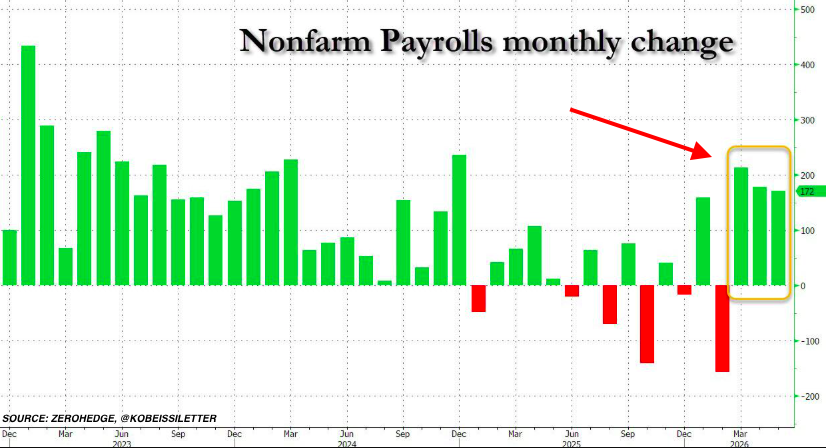
Lastly, the million Dollar question is if the labor market
can hold up with tighter financial conditions in 2025.
If not, we risk stagflation, the Fed's nightmare.
In fact, stagflation may already be here.
Follow us @KobeissiLetter for real time analysis as this develops.
can hold up with tighter financial conditions in 2025.
If not, we risk stagflation, the Fed's nightmare.
In fact, stagflation may already be here.
Follow us @KobeissiLetter for real time analysis as this develops.

• • •
Missing some Tweet in this thread? You can try to
force a refresh