Big investors & corporations are hoarding cash like NEVER before
This is unlike anything we've seen
A thread 🧵
This is unlike anything we've seen
A thread 🧵

2/ Money market funds currently offer yields of around 5%
Which is one of the highest levels in the last 20 years
A 5% return may not sound spectacular
But in today’s environment, it’s compelling
Which is one of the highest levels in the last 20 years
A 5% return may not sound spectacular
But in today’s environment, it’s compelling

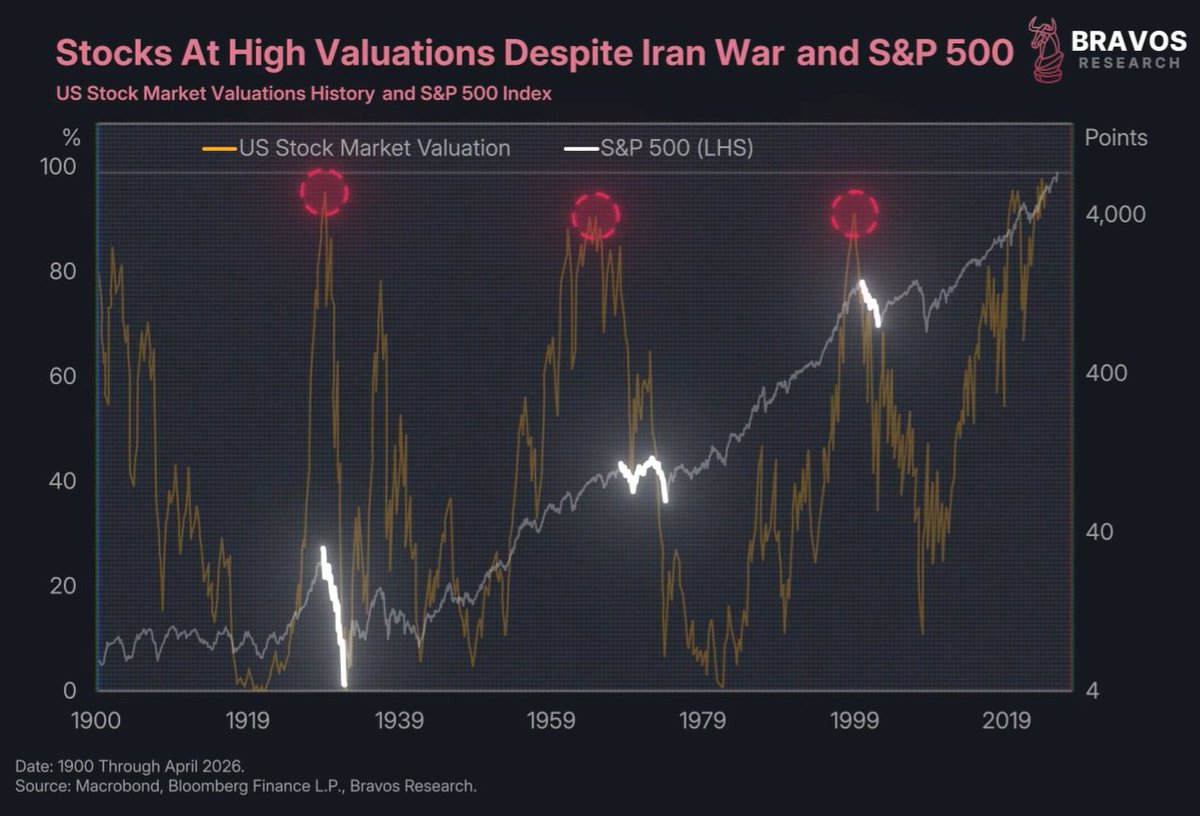
3/ Compare that 5% cash yield to the S&P 500’s earnings yield
Which is currently around 3%
And you can see that cash yield is 2% higher than the S&P 500’s earnings yield
The latter of which basically measures the ROI from holding stocks
Which is currently around 3%
And you can see that cash yield is 2% higher than the S&P 500’s earnings yield
The latter of which basically measures the ROI from holding stocks

4/ Historically, stocks outperformed cash
But today, cash offers better return
This rare setup flips the traditional investing script
With stocks yielding less than cash, investors like Buffett may see stocks as a weak long-term play
But today, cash offers better return
This rare setup flips the traditional investing script
With stocks yielding less than cash, investors like Buffett may see stocks as a weak long-term play

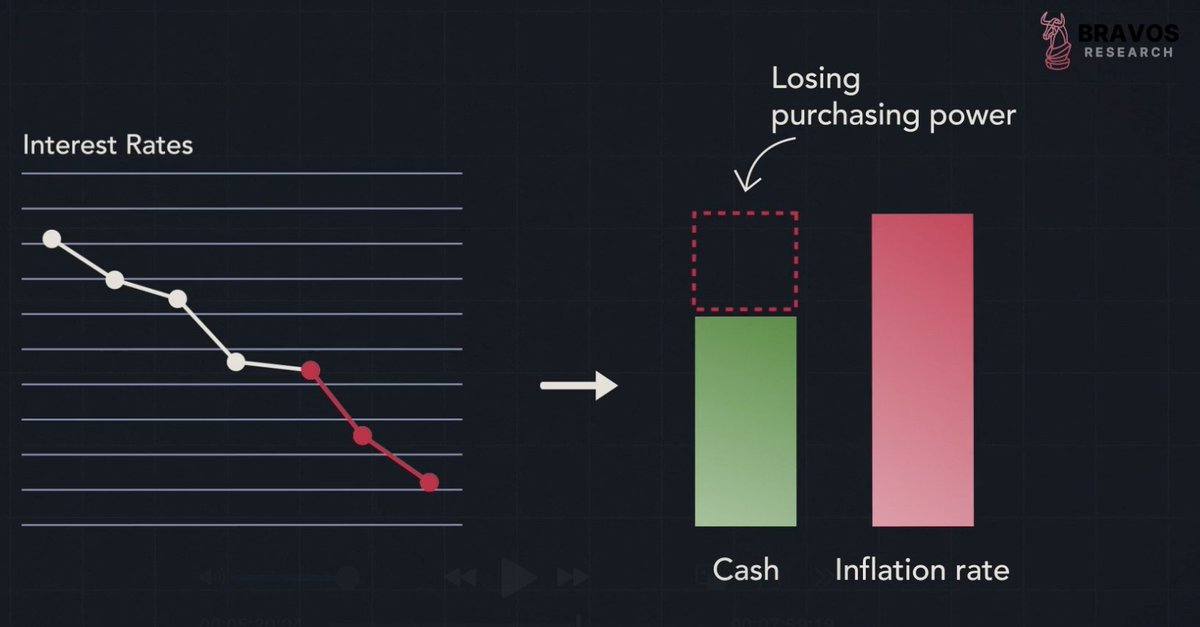
5/ Add low inflation, and cash becomes even more appealing, thanks to positive real interest rates
Positive real interest rates occur when cash yields outpace inflation, preserving purchasing power
This shift is significant after decades of negative real rates, where inflation ate away at cash returns
Positive real interest rates occur when cash yields outpace inflation, preserving purchasing power
This shift is significant after decades of negative real rates, where inflation ate away at cash returns

6/ Negative real interest rates—very common over the last 30 years—encouraged spending and investing
Today’s positive rates mark a fundamental shift, changing how both businesses and individuals allocate capital
Today’s positive rates mark a fundamental shift, changing how both businesses and individuals allocate capital

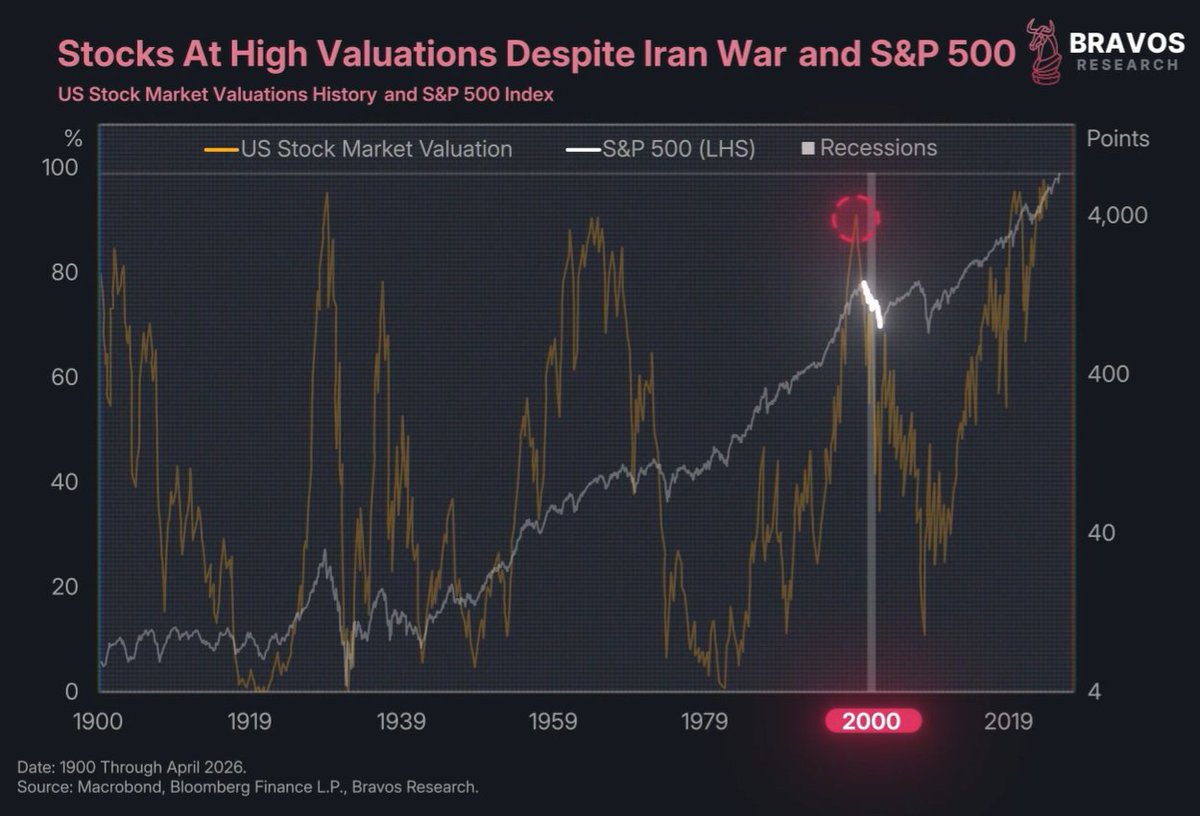
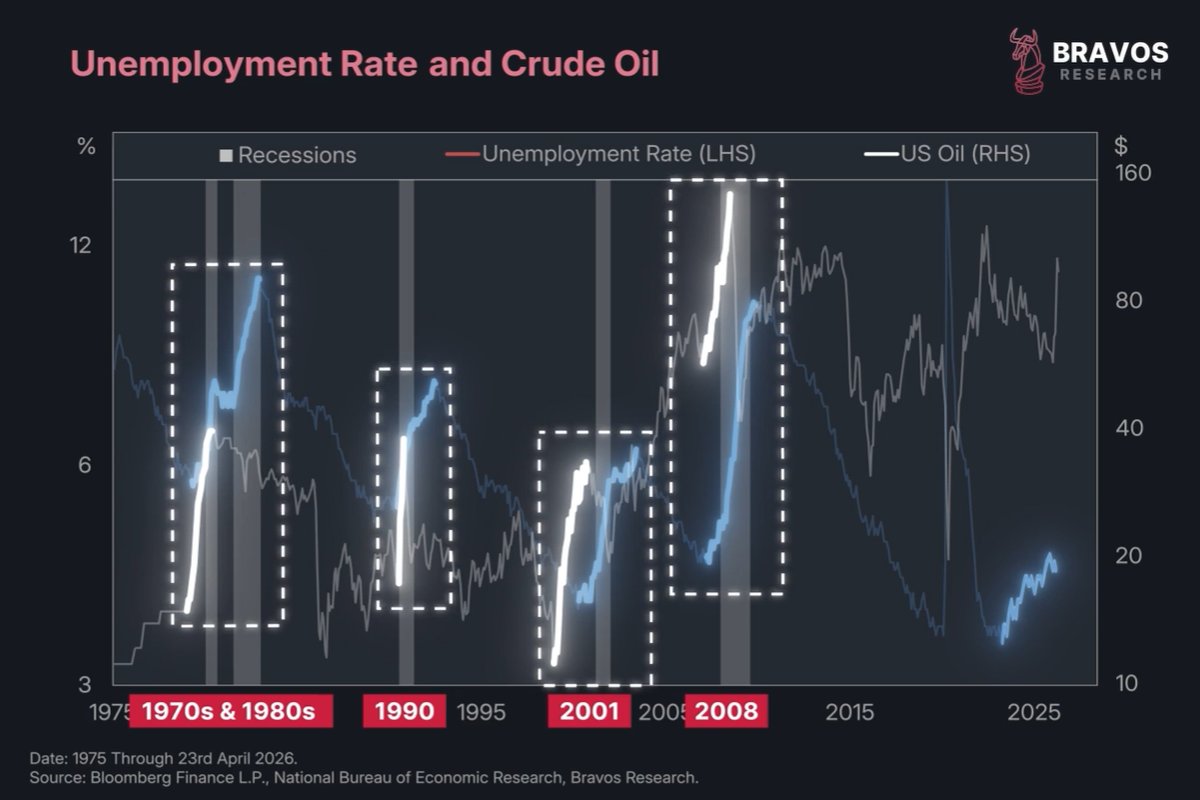
7/ Real interest rates, adjusted for inflation, are now around +2%
Historically, such levels have often been followed by US recessions
Why?
Because they create conditions that favor saving over spending
Historically, such levels have often been followed by US recessions
Why?
Because they create conditions that favor saving over spending

8/ When real rates are positive, households and businesses prioritize saving over investing or consuming
This reduces demand, raises unemployment, and slows economic growth
Which are classic precursors to a recession
This reduces demand, raises unemployment, and slows economic growth
Which are classic precursors to a recession

9/ Economist John Maynard Keynes summed it up well:
“The propensity to save will defeat its own purpose”
So basically saying high savings reduce demand, slowing the economy
“The propensity to save will defeat its own purpose”
So basically saying high savings reduce demand, slowing the economy

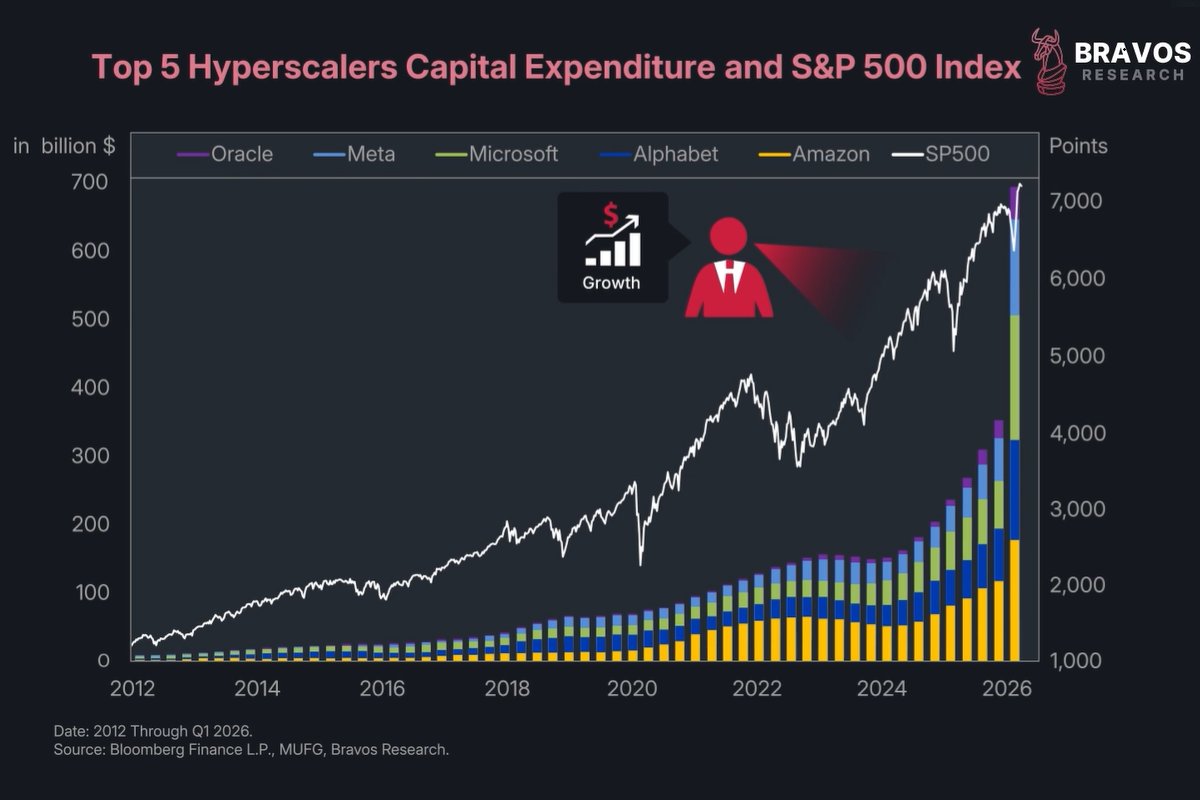
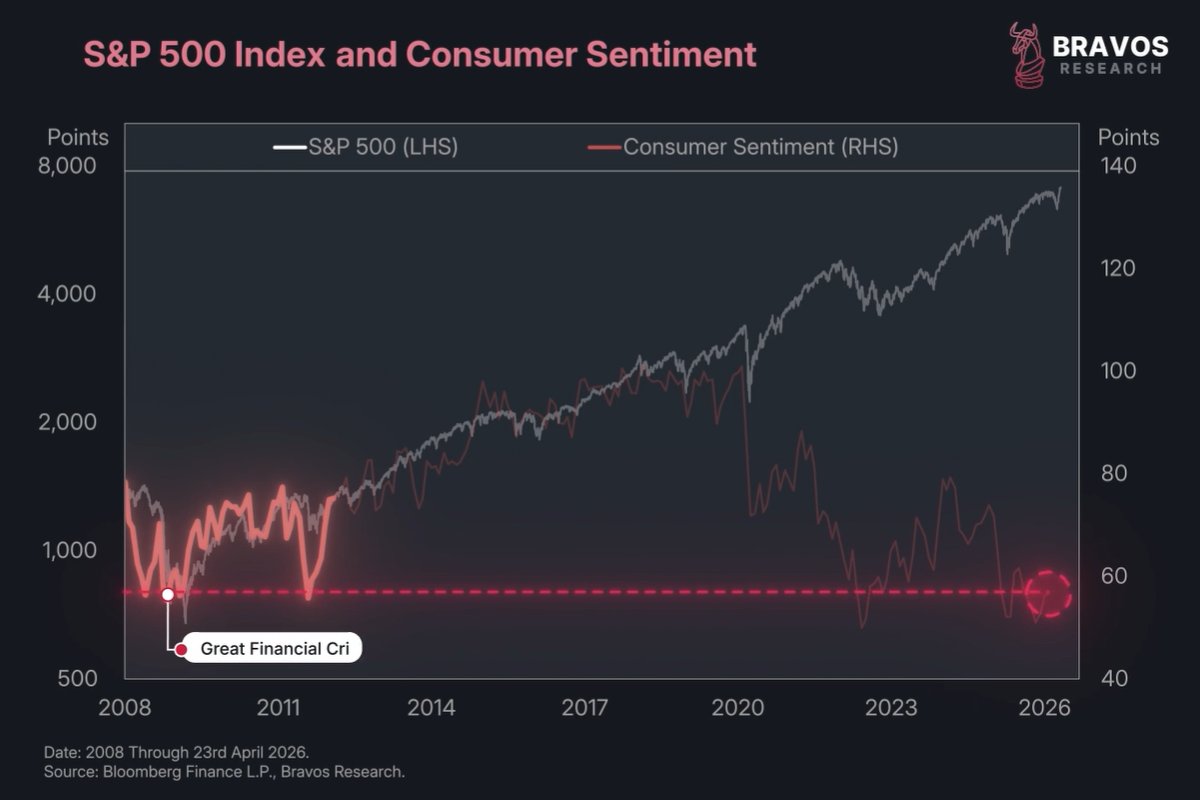
10/ Indeed, corporations are hoarding cash instead of investing today
Large time deposits have surged in recent years
Mirroring patterns seen before the 2008 financial crisis
Large time deposits have surged in recent years
Mirroring patterns seen before the 2008 financial crisis

11/ But not all economists agree with Keynes
Milton Friedman argued that savings are crucial for long-term growth
And fuel investments that drive productivity and innovation
Milton Friedman argued that savings are crucial for long-term growth
And fuel investments that drive productivity and innovation

12/ Indeed, a company or individual that has saved up enough money will be able to take on larger new projects that require a certain starting capital
Something that it wouldn't be able to do without saving
And this can fuel economic prosperity
This is a core concept behind the theory of the business cycle
Something that it wouldn't be able to do without saving
And this can fuel economic prosperity
This is a core concept behind the theory of the business cycle
13/ Savings can lay the foundation for recovery
During downturns, cash piles up
Once conditions improve, this cash is deployed into major investments, fueling the next economic boom
This is called “pent-up demand”
During downturns, cash piles up
Once conditions improve, this cash is deployed into major investments, fueling the next economic boom
This is called “pent-up demand”
14/ This “pent-up demand” is a critical part of the business cycle
The question is: when will today’s $6.5 trillion in cash reserves start flowing back into the economy?
Historically, cash in money market funds is only deployed during or after economic downturns
The question is: when will today’s $6.5 trillion in cash reserves start flowing back into the economy?
Historically, cash in money market funds is only deployed during or after economic downturns

15/ The trigger?
Negative real interest rates, which makes holding cash unattractive
Negative real rates occur when cash yields fall below inflation, eroding purchasing power
This pushes investors to redeploy funds into higher-yielding assets, kickstarting economic growth
Negative real interest rates, which makes holding cash unattractive
Negative real rates occur when cash yields fall below inflation, eroding purchasing power
This pushes investors to redeploy funds into higher-yielding assets, kickstarting economic growth
16/ But historically, rates only turn negative during or after recessions
When the Fed aggressively cuts rates to stimulate the economy
They’ve never gone negative without a recession first
When the Fed aggressively cuts rates to stimulate the economy
They’ve never gone negative without a recession first

17/ Find such key insights with 3 actionable investment strategy videos every week
And also get access to real-time buy and sell alerts at:
bit.ly/BravosResearch
And also get access to real-time buy and sell alerts at:
bit.ly/BravosResearch
18/ Thanks for reading!
If you enjoyed this thread, please ❤️ and 🔁 the first tweet below
And follow @bravosresearch for more market insights, finance and investment strategies
If you enjoyed this thread, please ❤️ and 🔁 the first tweet below
And follow @bravosresearch for more market insights, finance and investment strategies
https://x.com/bravosresearch/status/1870531600955359716
• • •
Missing some Tweet in this thread? You can try to
force a refresh