Tech has doubled since October 2022
Between 1995 and 1999, Tech doubled every 2 years
Are we following the same footsteps of the Dot Com bubble?
A thread 🧵
Between 1995 and 1999, Tech doubled every 2 years
Are we following the same footsteps of the Dot Com bubble?
A thread 🧵

2/ Between 1995 and 1999, the NASDAQ 100, the US tech stock index, 2x in price every 2 years
Returns like that seem absurd, but here’s the thing:
The Nasdaq 100 has delivered similar returns recently
Returns like that seem absurd, but here’s the thing:
The Nasdaq 100 has delivered similar returns recently

3/ Since bottoming in late 2022, the Nasdaq 100 has 2x in price again

4/ If you overlay the late-1990s price action onto the last 2 years, they are actually quite a close match
The key difference?
In the late ‘90s, the Nasdaq 100 sustained gains for multiple years
Could we be on the verge of another multi-year melt-up today?
The key difference?
In the late ‘90s, the Nasdaq 100 sustained gains for multiple years
Could we be on the verge of another multi-year melt-up today?

5/ In the 1990s, the tech boom was fueled by optimism about the internet
Today, AI is driving similar enthusiasm
It’s a theme that feels just as revolutionary
Today, AI is driving similar enthusiasm
It’s a theme that feels just as revolutionary

6/ On valuations, the Nasdaq 100 is about as expensive today as it was in October 1998
Which was loser to the end of the Dot-com boom than the beginning
But from that point, the Nasdaq 100 still climbed another 234% before peaking
Which was loser to the end of the Dot-com boom than the beginning
But from that point, the Nasdaq 100 still climbed another 234% before peaking

7/ We can see that on this chart that shows us what's called the PE ratio of the NASDAQ 100
This is a way for us to gauge how expensive this index is at any given point in time
The Nasdaq 100’s current PE ratio is 30
Which were levels we last saw during the Dot-com mania of the late ‘90s
This is a way for us to gauge how expensive this index is at any given point in time
The Nasdaq 100’s current PE ratio is 30
Which were levels we last saw during the Dot-com mania of the late ‘90s

8/ In fact, when you compare Nasdaq 100’s PE ratio to the rest of the US stock market using the S&P 500’s PE ratio, you see a similar gap like the late 1990s
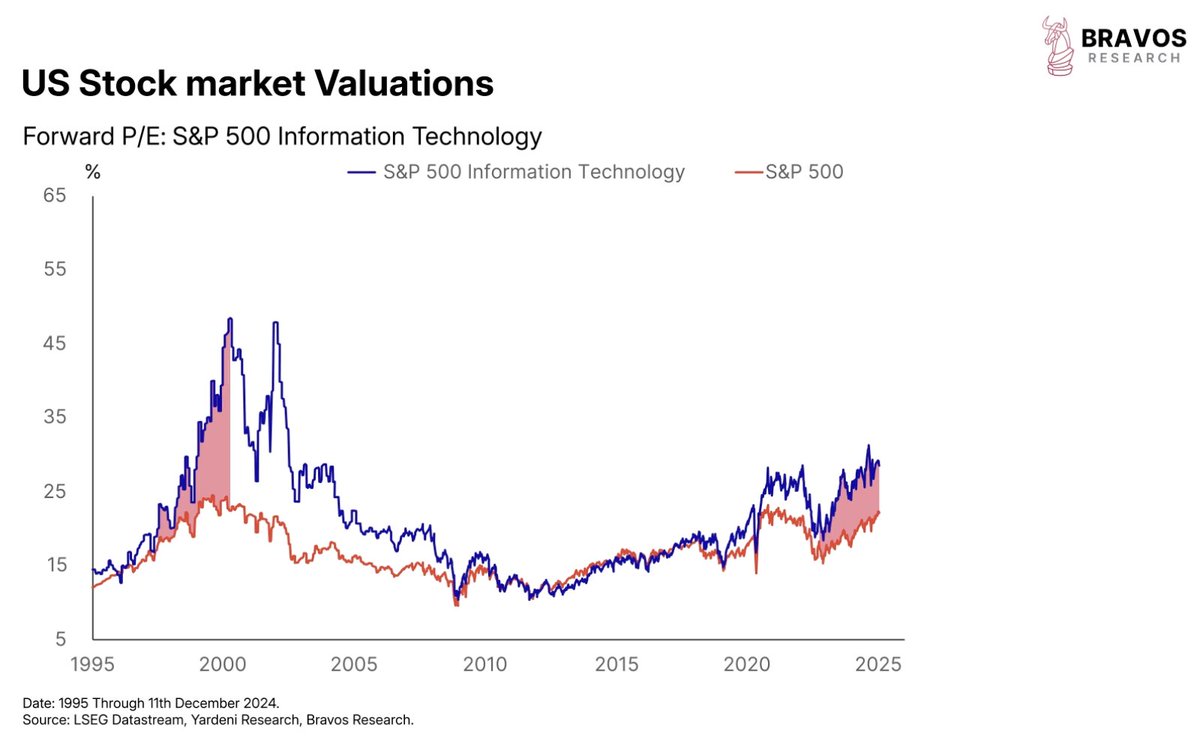
9/ This valuation gap is why many experts are bearish on tech
But back in the ‘90s, the gap grew much larger
When viral narratives like the internet—or AI—take hold, there’s no telling how much further this can stretch
To maximize opportunities in such markets and get real-time Trade Alerts visit:
bit.ly/BravosResearch
But back in the ‘90s, the gap grew much larger
When viral narratives like the internet—or AI—take hold, there’s no telling how much further this can stretch
To maximize opportunities in such markets and get real-time Trade Alerts visit:
bit.ly/BravosResearch

10/ It can be dangerous when the market begins to get too complacent like this though
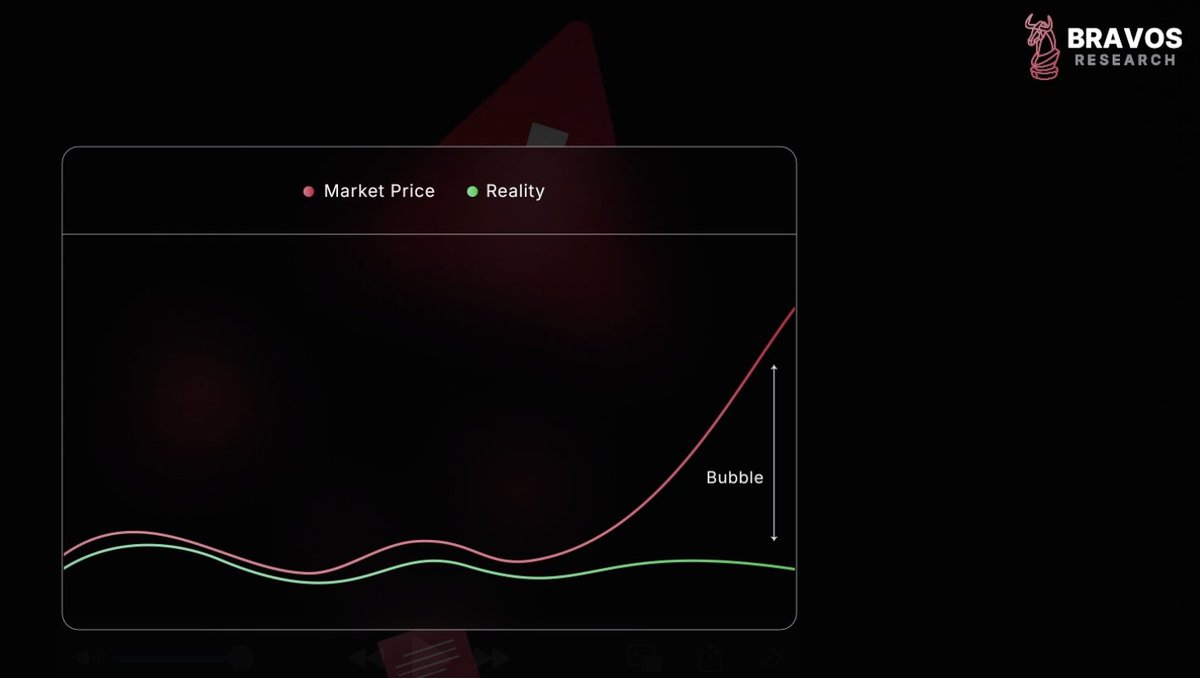
Prices can diverge from fundamentals in what’s call a ‘Bubble’
These bubbles are often fueled by viral narratives
And AI optimism in tech today is starting to feel similar
Prices can diverge from fundamentals in what’s call a ‘Bubble’
These bubbles are often fueled by viral narratives
And AI optimism in tech today is starting to feel similar
11/ Take this chart for example that shows long-term earnings expectations for tech stocks
It’s basically how high the earnings expectations of Wall Street analysts are on technology stocks looking out 5 years
It’s basically how high the earnings expectations of Wall Street analysts are on technology stocks looking out 5 years

12/ In the late ‘90s, analysts predicted 30% annual growth for tech - a massive number
For context, that’s growth markets rarely achieve in even a single year
After the bubble burst though, expectations dropped to more realistic levels of around 13%
For context, that’s growth markets rarely achieve in even a single year
After the bubble burst though, expectations dropped to more realistic levels of around 13%

13/ Today, analysts expect 25% annual growth for tech over the next 5 years
Again, this is quite high, and in our view, it’s unlikely to materialize
Again, this is quite high, and in our view, it’s unlikely to materialize

14/ So yes, tech may be disconnecting from fundamentals
But as George Soros famously said: “When I see a bubble forming, I rush in to buy, adding fuel to the fire”
If you can't fight it, join it
But as George Soros famously said: “When I see a bubble forming, I rush in to buy, adding fuel to the fire”
If you can't fight it, join it

15/ Here’s why the argument for tech still holds:
The Nasdaq 100 has outperformed the S&P 500 by over 400% since its inception
Since 2002 alone, tech has beaten the broader market by 230%
The Nasdaq 100 has outperformed the S&P 500 by over 400% since its inception
Since 2002 alone, tech has beaten the broader market by 230%
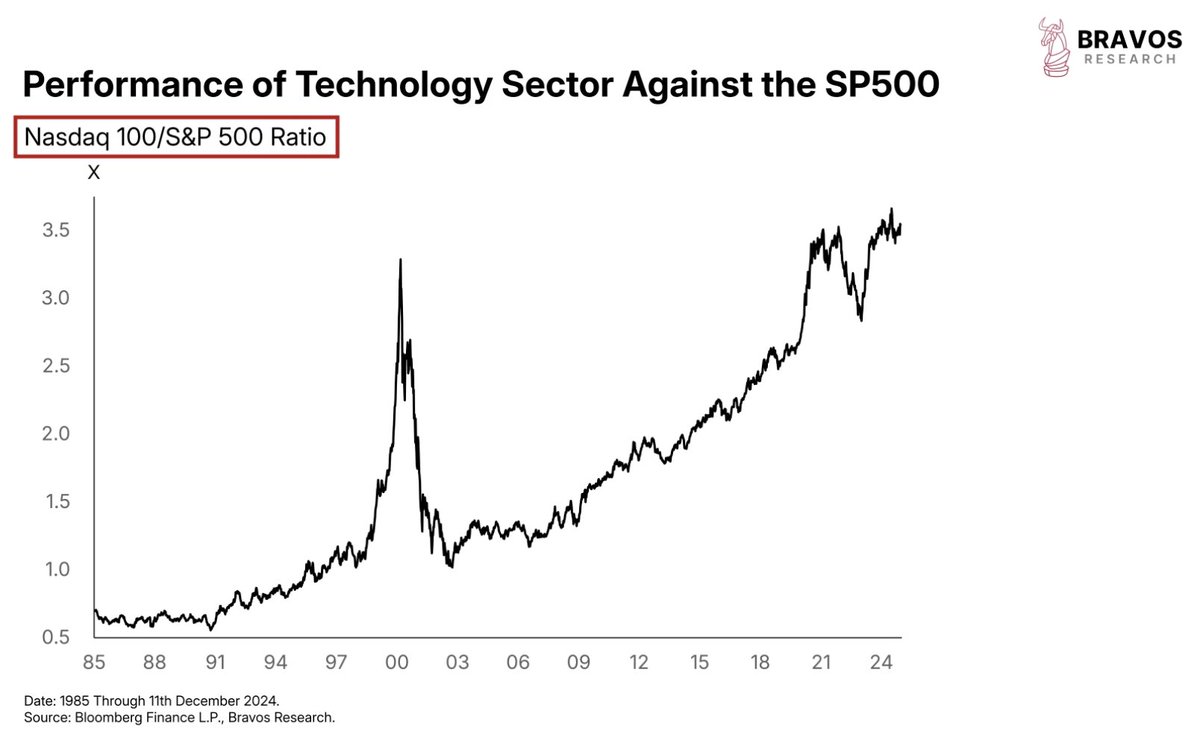
16/ That said, recent performance hasn’t been as impressive
Tech surged in early 2023 after ChatGPT triggered the AI optimism
But since June 2023, tech’s performance has stagnated against the market
Tech surged in early 2023 after ChatGPT triggered the AI optimism
But since June 2023, tech’s performance has stagnated against the market

17/ To some, this stagnation signals a topping process
Indicating that tech stocks are ready to collapse under their own weight and revert to reality
Indicating that tech stocks are ready to collapse under their own weight and revert to reality

18/ But to others, this is the tech sector setting up a base to move up higher and continue its euphoric performance

19/ A similar thing happened in 1999:
After a huge run in late-1998, tech consolidated for almost a year before resuming its uptrend into 2000
After a huge run in late-1998, tech consolidated for almost a year before resuming its uptrend into 2000

20/ This is what we’ve communicated to our clients
We’ve been neutral on tech since 2023
But recent moves suggest tech may be gearing up to outperform again
Get access to 3 weekly Investment Strategy videos at:
bit.ly/BravosResearch
We’ve been neutral on tech since 2023
But recent moves suggest tech may be gearing up to outperform again
Get access to 3 weekly Investment Strategy videos at:
bit.ly/BravosResearch

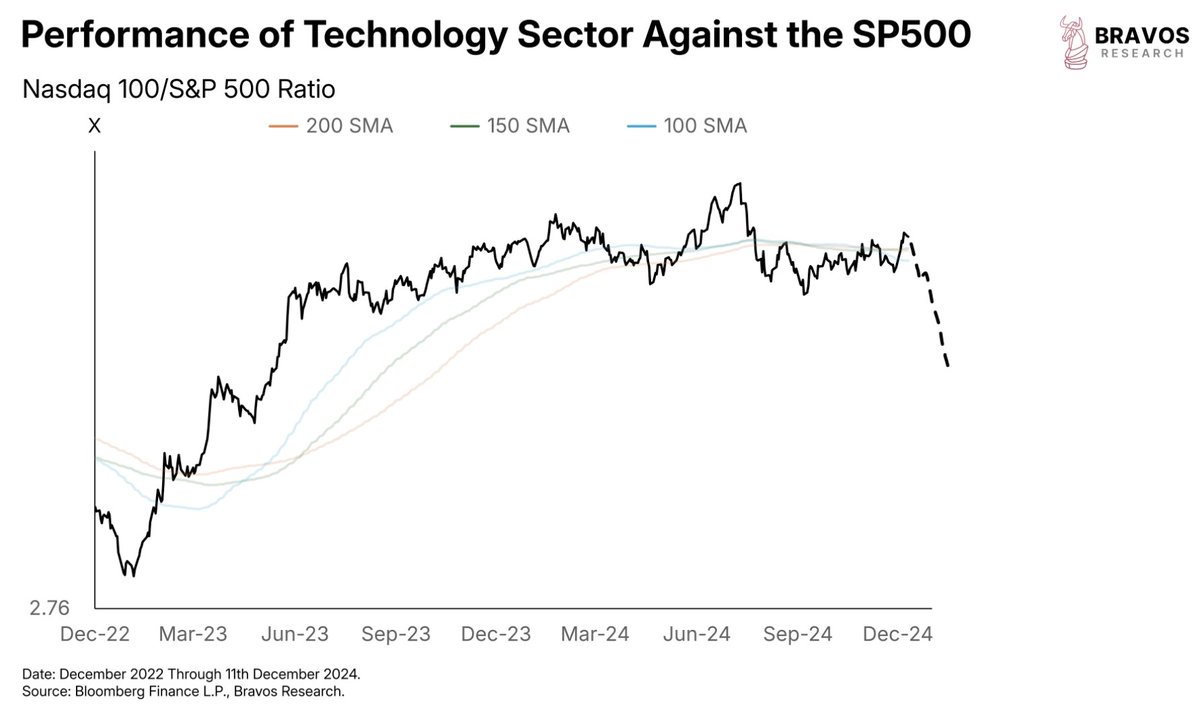
21/ If you look at this chart with moving averages of the Nasdaq 100 relative to the S&P 500, you’ll see:
They’ve clustered tightly over the last few months as tech formed a base
This clustering is technically a bullish signal, especially after the breakout we just saw
They’ve clustered tightly over the last few months as tech formed a base
This clustering is technically a bullish signal, especially after the breakout we just saw

22/ At Bravos Research, we’ve flipped bullish on tech stocks
We’re actively scanning for long trades in the sector
And already have trades on names like Amazon, which are up over 15%
We’re actively scanning for long trades in the sector
And already have trades on names like Amazon, which are up over 15%

23/ But we’re staying flexible
If this ratio falls back below key moving averages, it’ll be a red flag
Flexibility is the cornerstone of our strategy at Bravos Research
If this ratio falls back below key moving averages, it’ll be a red flag
Flexibility is the cornerstone of our strategy at Bravos Research
24/ In 2024, we’ve done 104 trades:
68 wins, 36 losses
You can check our track record for FREE on our website
If you want to be on top of markets in 2025, try our service at:
bit.ly/BravosResearch
68 wins, 36 losses
You can check our track record for FREE on our website
If you want to be on top of markets in 2025, try our service at:
bit.ly/BravosResearch
25/ Thanks for reading!
If you enjoyed this thread, please ❤️ and 🔁 the first tweet below
And follow @bravosresearch for more market insights, finance and investment strategies
If you enjoyed this thread, please ❤️ and 🔁 the first tweet below
And follow @bravosresearch for more market insights, finance and investment strategies
https://x.com/bravosresearch/status/1870880805800562849
• • •
Missing some Tweet in this thread? You can try to
force a refresh