It's official:
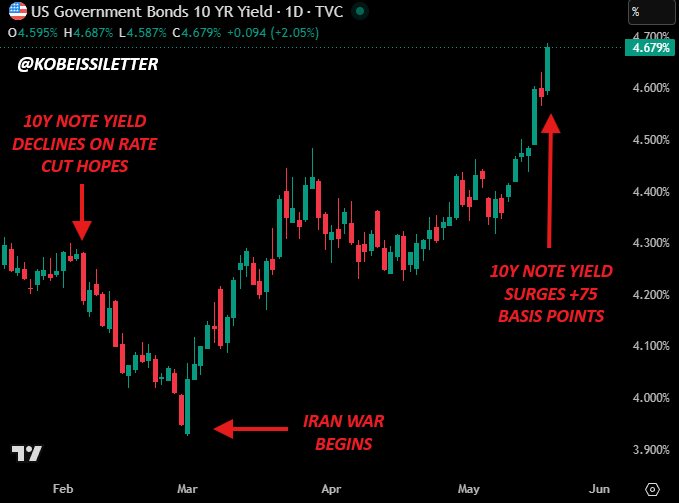
The 10-year note yield is now up 100 basis points since the "Fed pivot" began in September.
In other words, while the Fed has CUT rates by 100 bps, rates in the market have RISEN by 100 bps.
Is this the biggest market to Fed disconnect in history?
(a thread)
The 10-year note yield is now up 100 basis points since the "Fed pivot" began in September.
In other words, while the Fed has CUT rates by 100 bps, rates in the market have RISEN by 100 bps.
Is this the biggest market to Fed disconnect in history?
(a thread)
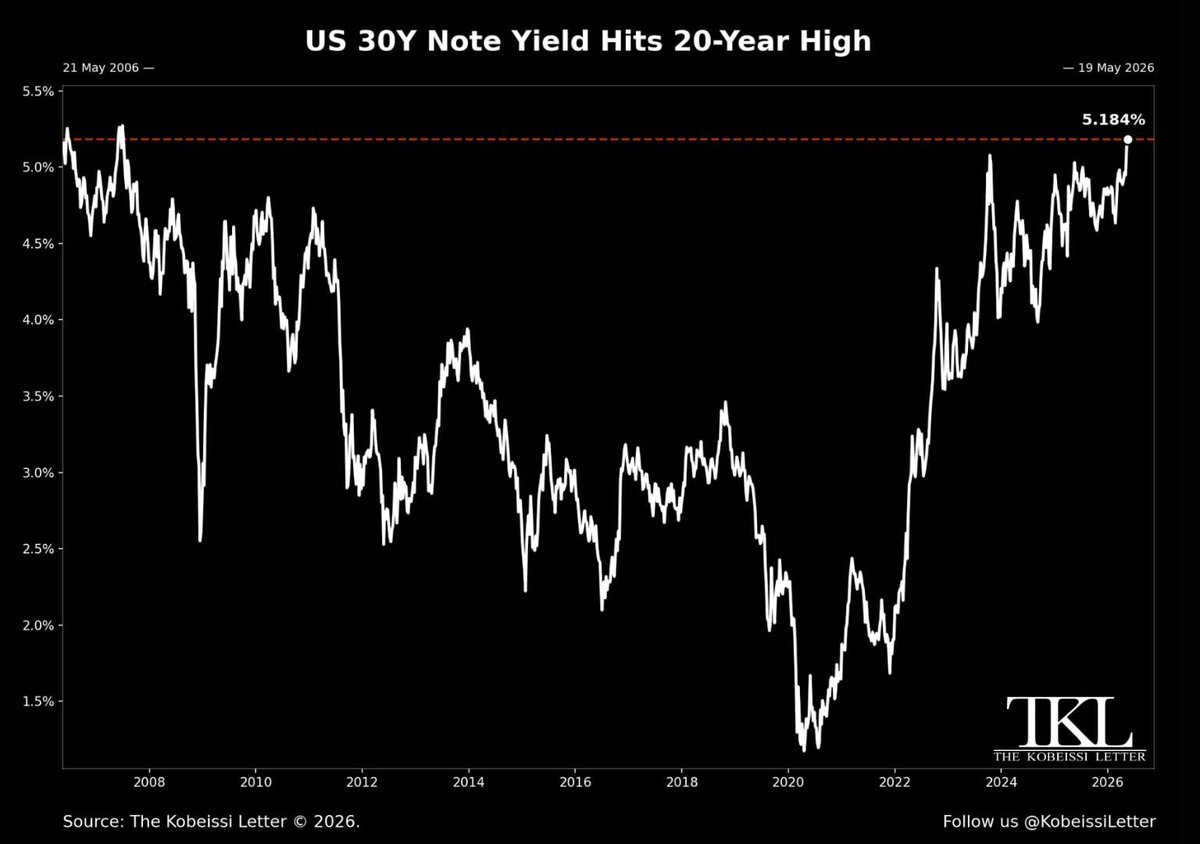
Since Fed rate cuts began in September, the 10-year note yield has risen from 3.60% to 4.60%.
This puts yields at their highest since May 2024, even as the Fed aggressively cuts rates.
Rates are rising after the Fed began cuts with a 50 bps cut for the first time since 2008.
This puts yields at their highest since May 2024, even as the Fed aggressively cuts rates.
Rates are rising after the Fed began cuts with a 50 bps cut for the first time since 2008.

As a result, the average interest rate on a 30-year mortgage in the United States is now at 7.10%.
To put this into perspective, just 3 months ago the average rate bottomed at 6.15%.
Buying the median priced home at $420,400 now costs an average of ~$400 more PER MONTH.
To put this into perspective, just 3 months ago the average rate bottomed at 6.15%.
Buying the median priced home at $420,400 now costs an average of ~$400 more PER MONTH.

So why are interest rates rising as the Fed cuts rates?
The main reason is that markets have realized that inflation is back on the rise.
3-month annualized core CPI is nearing 4% while PCE, PPI, and CPI inflation are all rising again.
This is BEFORE tariffs and tax cuts.
The main reason is that markets have realized that inflation is back on the rise.
3-month annualized core CPI is nearing 4% while PCE, PPI, and CPI inflation are all rising again.
This is BEFORE tariffs and tax cuts.

At the November Fed meeting, after the Fed cut rates by 25 basis points, Fed Chair Powell was asked about this.
He responded, "it's material changes in financial conditions that last... and we don't know that about this."
6 weeks later and interest rates are only rising.
He responded, "it's material changes in financial conditions that last... and we don't know that about this."
6 weeks later and interest rates are only rising.
Also confirming the hawkish shift in bond markets, the US Dollar, $DXY, hit a fresh 25-month high.
It is now up nearly 8% since October as markets price in more inflation and Trump Administration policies.
$1.00 USD is now worth $1.44 CAD which is nearing a 20-year high.
It is now up nearly 8% since October as markets price in more inflation and Trump Administration policies.
$1.00 USD is now worth $1.44 CAD which is nearing a 20-year high.

Interestingly, gold prices are also rising and our premium members got ahead of this trend.
Below was our alert for subs.
Most recently, when gold fell into $2,600, we called for a rebound into $2700+.
Subscribe at the link below to access our alerts:
thekobeissiletter.com/subscribe
Below was our alert for subs.
Most recently, when gold fell into $2,600, we called for a rebound into $2700+.
Subscribe at the link below to access our alerts:
thekobeissiletter.com/subscribe

Even more alarming is the Supercore PCE inflation data.
1-month annualized Supercore PCE inflation is now nearing a whopping 5%.
Headline Supercore PCE inflation is above 3.5% and back on the rise.
Consumers are back under pressure of severe inflation in many categories.
1-month annualized Supercore PCE inflation is now nearing a whopping 5%.
Headline Supercore PCE inflation is above 3.5% and back on the rise.
Consumers are back under pressure of severe inflation in many categories.

The result of recent inflation data is a significantly more hawkish expectation for 2025.
Markets now see the first rate cut of 2025 beginning in May 2025.
There is a 21% chance that we don't see a single rate cut in 2025.
Just months ago, markets saw 4 cuts as a base case.
Markets now see the first rate cut of 2025 beginning in May 2025.
There is a 21% chance that we don't see a single rate cut in 2025.
Just months ago, markets saw 4 cuts as a base case.

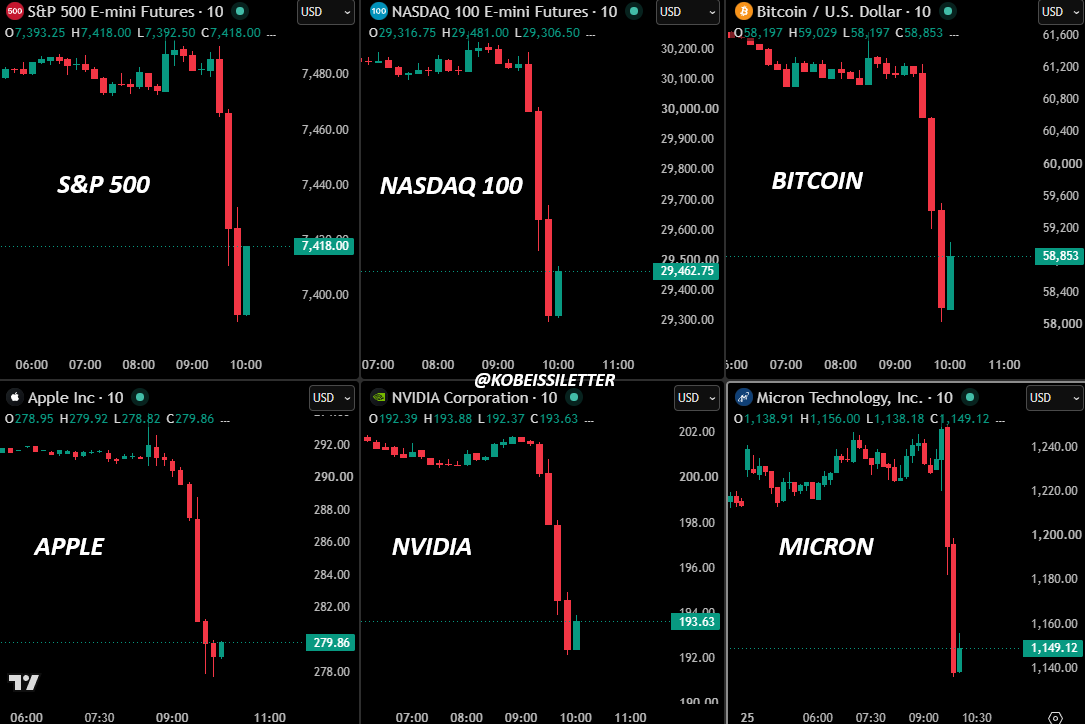
Combine this with record equity allocation and we are setting up for a wild 2025.
A record $140 billion pumped into US equities since Election Day alone.
Even as inflation rebounds and the Fed pivot pares back, both US and foreign investors are piling into US equities.
A record $140 billion pumped into US equities since Election Day alone.
Even as inflation rebounds and the Fed pivot pares back, both US and foreign investors are piling into US equities.

As we head into 2025, market uncertainty is significantly higher than it was in 2024.
Returns will be excellent for those who follow the technicals and can ignore the noise.
Subscribe at the link below to access our premium analysis and alerts:
thekobeissiletter.com/subscribe
Returns will be excellent for those who follow the technicals and can ignore the noise.
Subscribe at the link below to access our premium analysis and alerts:
thekobeissiletter.com/subscribe
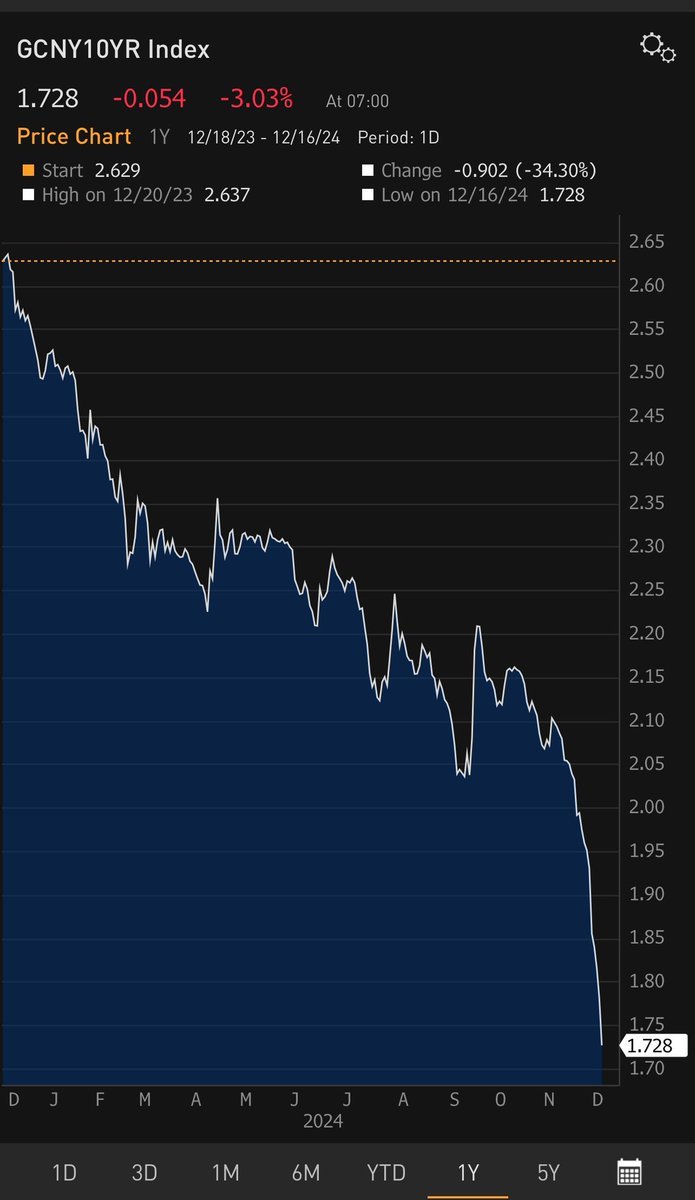
Lastly, China is facing the EXACT opposite situation as as the United States.
Their 10-year yield has collapsed nearly 100 basis points in 2024 and widespread stimulus has begun.
China is nearing a recession.
Follow us @KobeissiLetter for real time analysis as this develops.
Their 10-year yield has collapsed nearly 100 basis points in 2024 and widespread stimulus has begun.
China is nearing a recession.
Follow us @KobeissiLetter for real time analysis as this develops.
• • •
Missing some Tweet in this thread? You can try to
force a refresh