52-1/ COVID update for epidemiological weeks 51-52 of 2024.
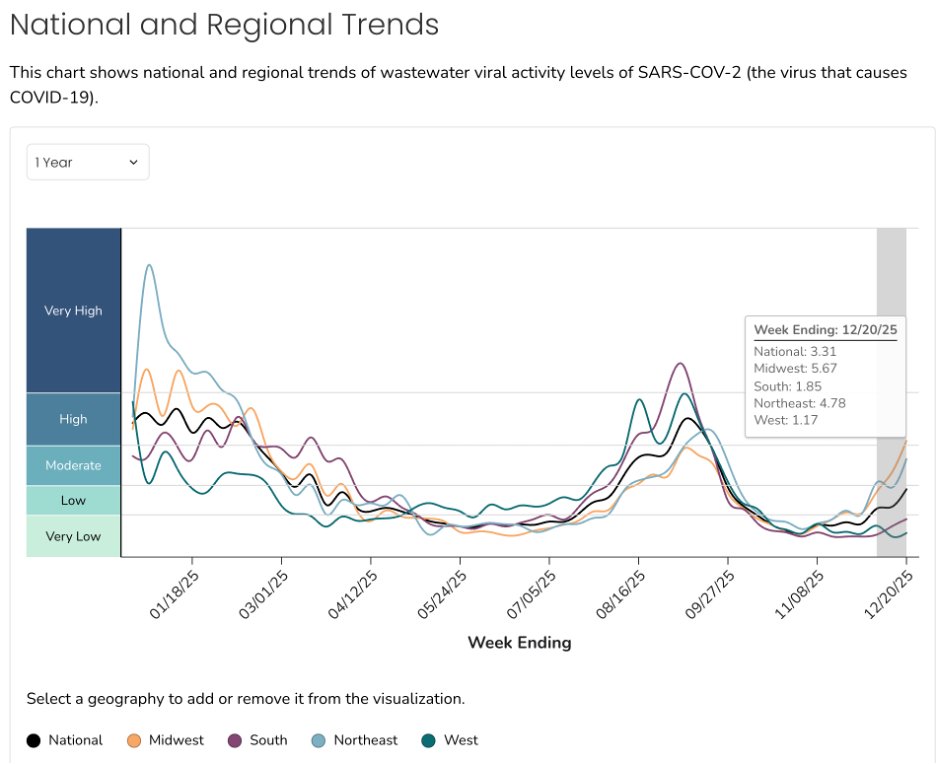
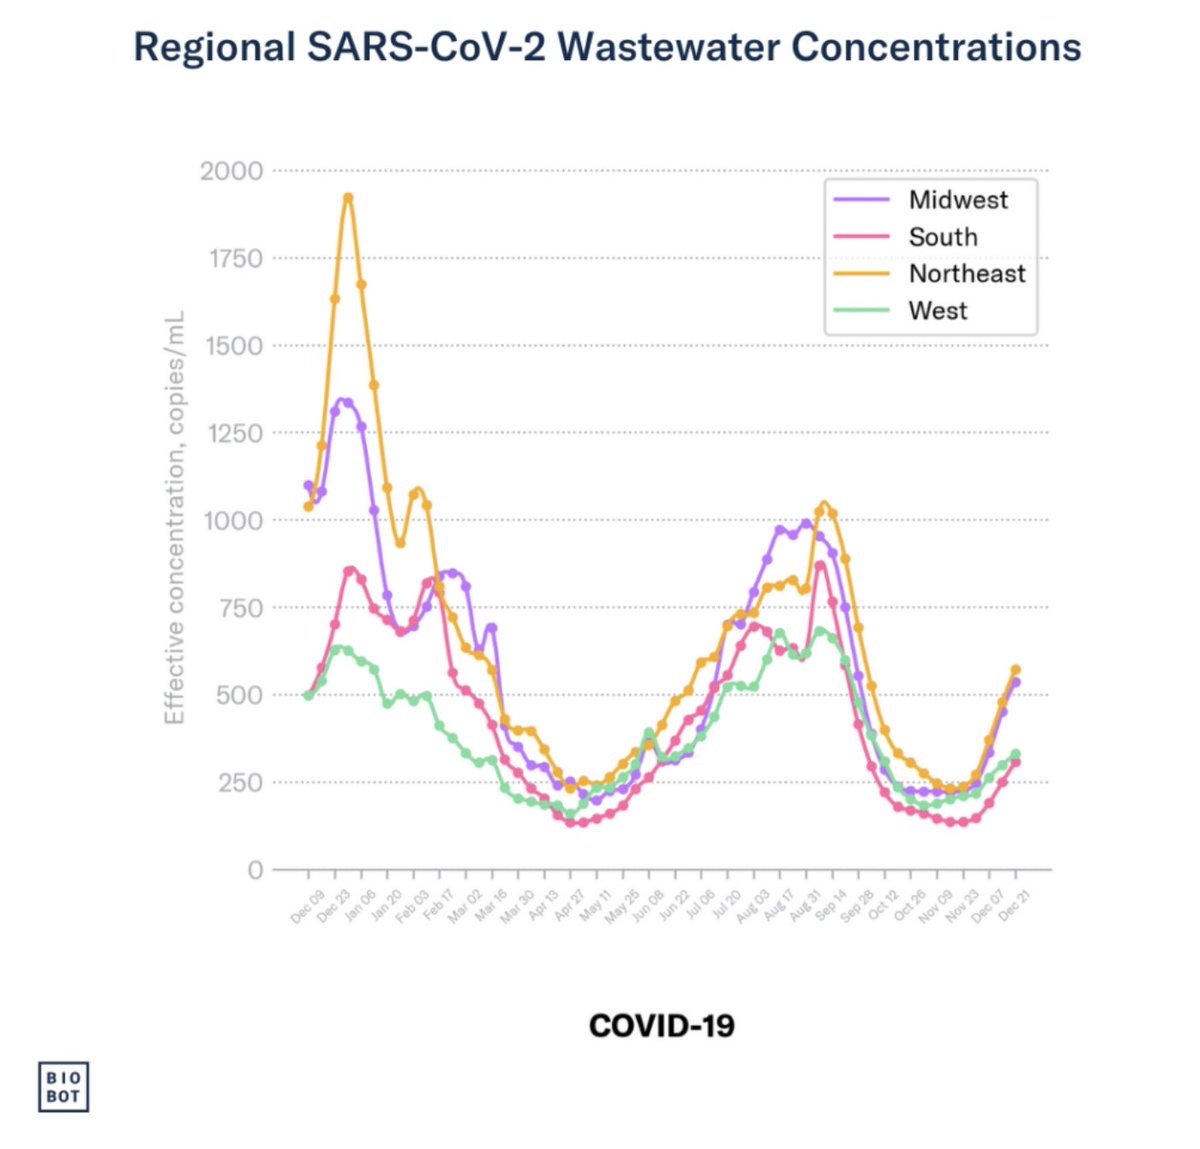
Here we go again! National SARS2 wastewater numbers are climbing quickly, especially in the NE and Midwest.
Here we go again! National SARS2 wastewater numbers are climbing quickly, especially in the NE and Midwest.

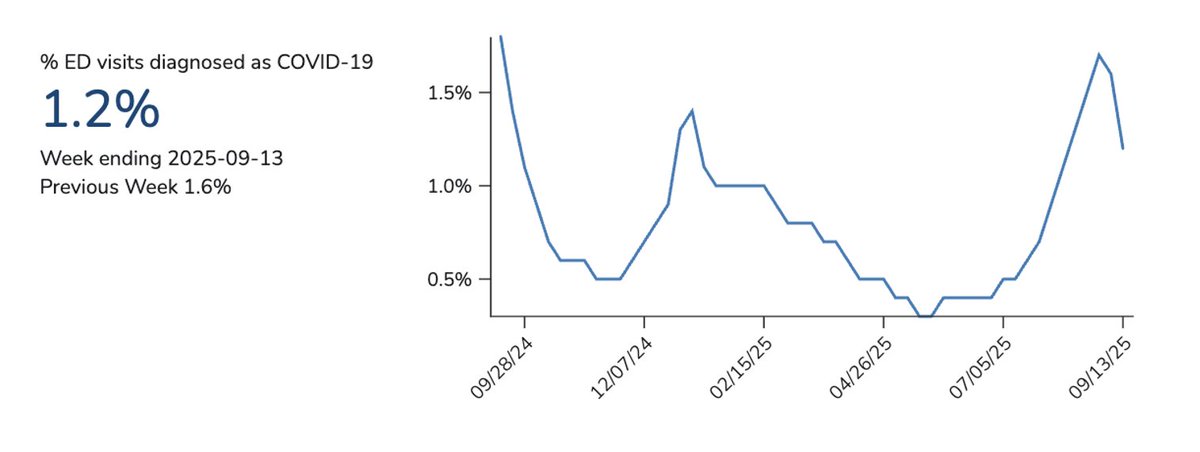
52-2/ Of the big 3 respiratory viruses (per CDC), COVID still trails RSV and influenza in test positivity, but has now passed RSV in the number of ED visits.


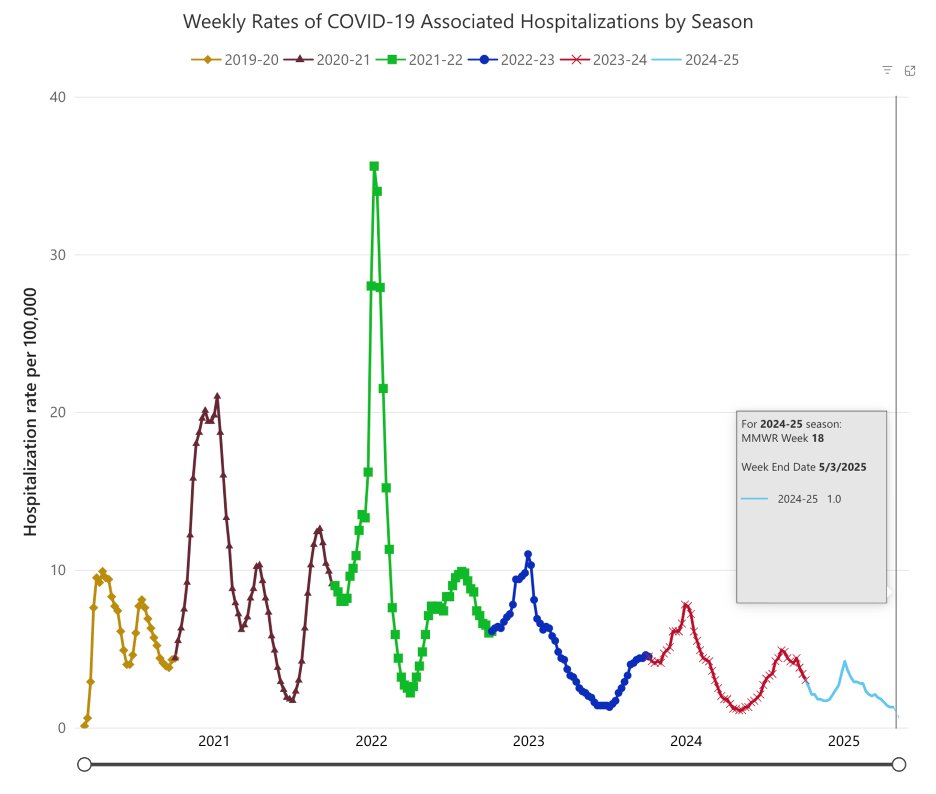
52-3/ COVID deaths are probably still falling but hospitalizations (based on incomplete data) are rising. And a rise in deaths will follow as hospitalizations rise.


52-4/ But COVID dropped to 14th place as a cause of death this year. Let's not kid ourselves, though. COVID will likely hang around on the CDC's top 15 list for the foreseeable future.

52-5/ Also, if you're unlucky enough to be hospitalized for COVID, you're more likely to die than if your were hospitalized with the flu. A Veteran's Affairs study found that 5.7% of COVID patients died within 30 days of admission, compared to 4.24% of influenza patients.

52-6/ I call your attention to 2 interesting graphs that @Truth_in_Number posted. We might be getting a wee bit better at treating severe COVID, but the rates of deaths to hospitalizations haven't changed much in 33 months. He also created a great timeline graph of COVID deaths.


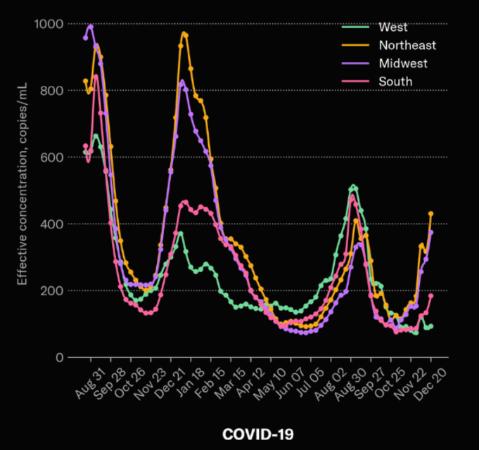
52-7/ In my week 49-50 update, I conclude that the uptick in US COVID numbers is limited to certain hotspots. Well, those hotspots are spreading. SoCal sewarsheds two weeks ago vs this week...


52-8/ In NY State, COVID is still clustered around the Buffalo area and the NYC metro area + Long Island. But a few more rural counties are showing some COVID activity in their wastewater.


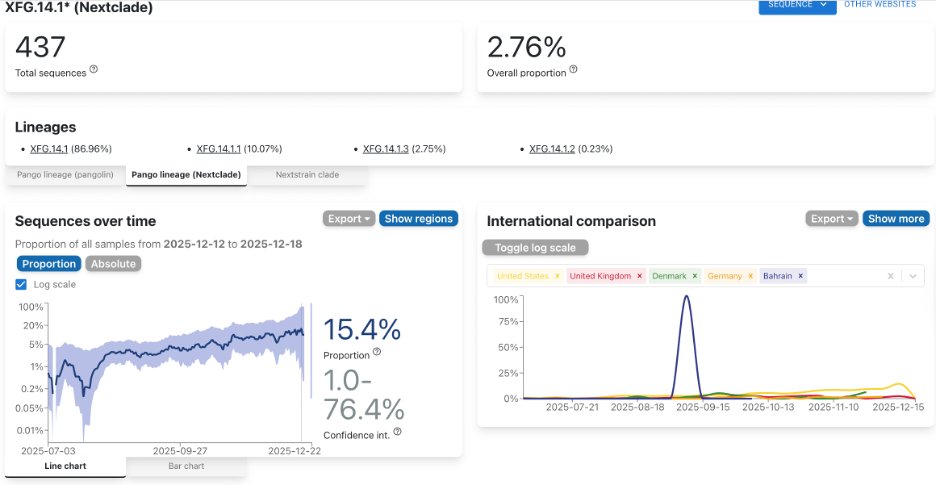
52-9/ XEC seems to be driving the new wave. I admit that I didn't see that coming. Its growth rate was pretty flat as of two weeks ago, but last week, XEC* jumped to 60%. I suspect sampling error (and CoV-Spectrum puts its likely avg at ~38%).

52-10/ CDC shows XEC at ~45%. When in doubt I like to look at @RajlabN's NYITCOM frequency charts. I don't see any variant other than XEC that could be pushing this wave.
It's worth noting—LP.8.1 has a high growth rate, but CoV-Spectrum shows it only running ~6% right now.
It's worth noting—LP.8.1 has a high growth rate, but CoV-Spectrum shows it only running ~6% right now.


@RajlabN 52-11/ I'm going to sign off for tonight. I'll have some A(H5) slides and commentary tomorrow evening. Cheers!
@RajlabN 52-12/ There's a fascinating article in Science asking why an A(H5) pandemic hasn't started yet. Basically, no one is sure what makes some strains highly pathogenic—nor why mutations that enable human-to-human transmissibility haven't happened yet.
science.org/content/articl…
science.org/content/articl…
@RajlabN 52-13/ Along with some other commentators, I was under the misapprehension that Genotype D1.1 (which infects birds) was more pathogenic than B3.13 (which infects cattle). After all, all the infected dairy workers had mild symptoms, but 2 people who caught D1.1 were hospitalized.
@RajlabN 52-14/ But Tom Peacock (@PeacockFlu) set me straight. There were a cluster of D1.1 infections in Washington that weren't hospitalized. That begs the question of why some people infected with D1.1 get seriously ill, and others don't.

@RajlabN @PeacockFlu 52-15/ Don't confuse transmissibility with pathogenicity. Yes, a pandemic requires that a virus be highly transmissible, but if symptoms are mild as the infected dairy workers (i.e., conjunctivitis, sniffles, mild fever), an A(H5) pandemic would be a minor public health concern.

@RajlabN @PeacockFlu 52-16/ Much research is focused on the efficiency of Hemagglutinin (HA) and Neuraminidase (NA) proteins. HA binds to the sialic acid receptors. NA helps the virus release newly-formed viral particles from infected cells. But HA and NA have to work in a balance (see Peacock quote)

@RajlabN @PeacockFlu 52-17/ Researchers worry that improved HA and/or NA proteins will make A(H5) more transmissible and infectious. A valid concern—but what causes serious illness? From frozen corpses in AK, we have samples of the virus that caused the 1918-19 flu pandemic...
tinyurl.com/5n8369u5
tinyurl.com/5n8369u5

@RajlabN @PeacockFlu 52-18/ The A(H1N1) influenza virus that caused the 1918-19 pandemic (killing an est. 40 million people) had a couple of characteristics that made it deadly. The PB1 protein, in particular, was associated with the expression of a viral protein called PB-F2.
tinyurl.com/5xe9752b
tinyurl.com/5xe9752b
@RajlabN @PeacockFlu 52-19/ PB1-F2 (produced from an alternative reading frame) messed with cells' mitochondria and induced apoptosis (cell death) in immune cells like macrophages, weakening the host's immune defenses.
tinyurl.com/6cwr9b8x
tinyurl.com/6cwr9b8x

@RajlabN @PeacockFlu 52-20/ Likewise, the NS1 protein in the 1918 A(H1N1) virus was highly efficient at suppressing the innate immune response—which allowed the virus to replicate unchecked in the early stages of infection.
nature.com/articles/natur…
nature.com/articles/natur…

52-21/ We'll have to see if these or some other mechanisms could make A(H5) both transmissible and pathogenic. OTOH, it could all turn into a big nothing-burger for humans. But I think it's VERY stupid of the USDoA to allow A(H5) to percolate and mutate in our food supply.

52-22/ In the worst case scenario, I'm sure Dr. Bhatty and Brainworm will have our backs! #snarkasm
/end
/end

@threadreaderapp unroll
• • •
Missing some Tweet in this thread? You can try to
force a refresh