David Turver Profile picture
Dec 29, 2024 13 tweets 4 min read Read on X
There is no limit to our electricity bills as new spending on renewables has diminishing impact on emissions intensity. Our bills are going to infinity and beyond. A thread (1/n) Ed Miliband will send our electricity bills to infinity and beyond because adding more wind and solar to the grid is having diminishing impact on emissions intensity
First up, we need to acknowledge that measuring the emissions intensity of electricity generation is an imprecise science. Three different datasets from Ember, DUKES and NESO give different results although have a similar shape. (2/n) UK Electricity Emissions Intensity (gCO2/kWh) from Ember, DUKES and NESO
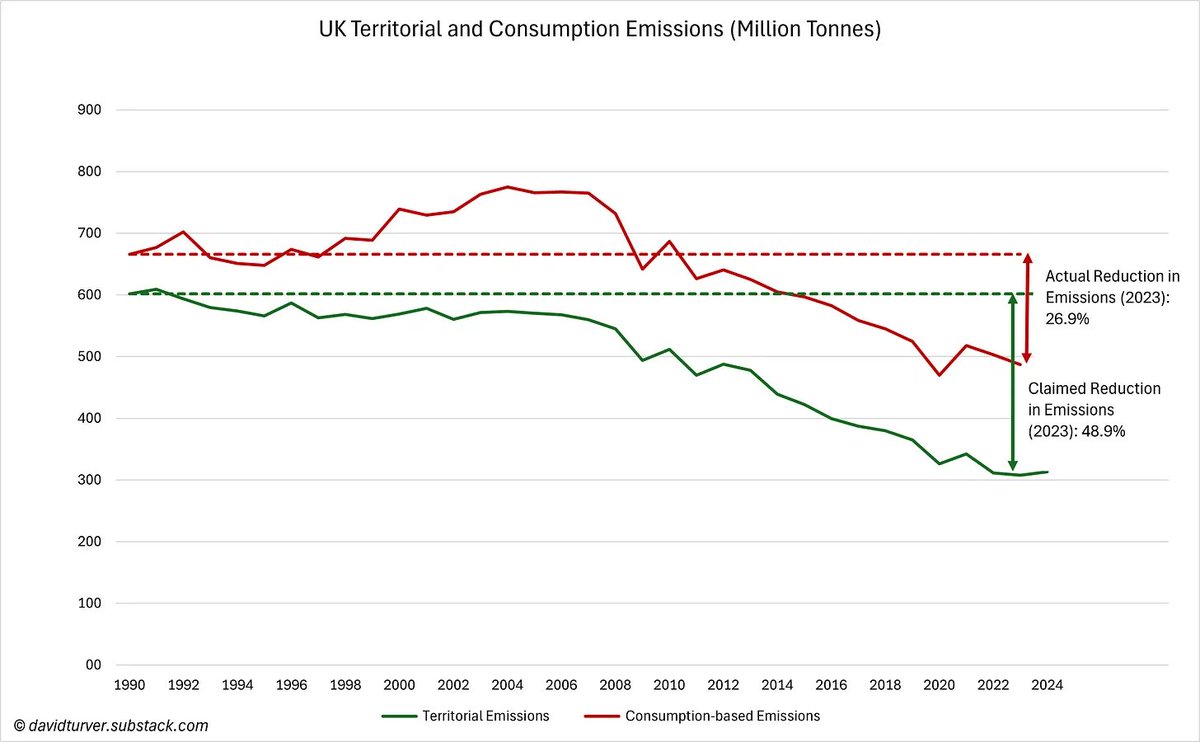
The numbers are also a bit of a con, because they ignore the CO2 emissions from burning trees at places like Drax. If these are added back, assuming similar emissions as for coal, the the picture is less impressive (3/n) Image
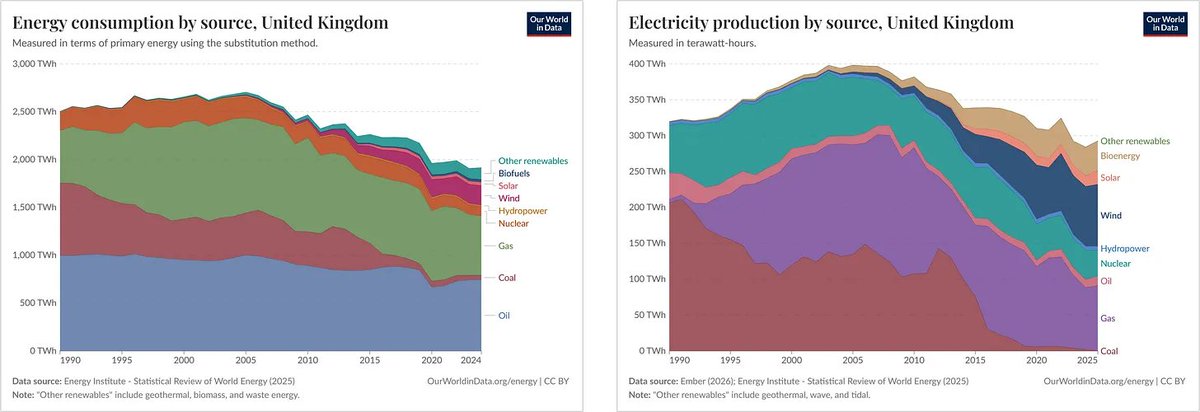
Going back to the NESO data, it is clear that the main driver of reduced emissions intensity (solid orange line) has been the removal of coal from the system (grey area) (4/n) UK electricity generation emissions intensity vs wind and solar capacity and coal generation
From a peak in 2012, emissions intensity fell from 519g/kWh in 2012 to 195g/kWh in 2019 as coal generation fell from 137TWh to single digits. Each extra GW of wind and solar capacity led to a reduction in emissions intensity of 11.9g/kWh (5/n)
Since 2019, extra emissions reductions have been hard to come by, with emissions intensity falling to 151g/kWh after an addition of a further 9.2GW of wind and solar capacity. A reduction of just 4.8g/kWh per GW of added capacity (6/n)
This is hardly a surprising result because despite big increases in wind capacity, the minimum generation has hardly changed since 2015. 1 x 0 =0, 10 x 0 = 0 and 100 x 0 = 0 (7/n) Minimum UK Wind Generation by day (MW) from NESO data
Looking at the dotted lines out to 2030, we first have to make an adjustment to the forecast emissions intensity. NESO and the Government decided to ignore the emissions from waste incineration and combined heat & power plants, another con. (8/n)
Adding that back means that emissions intensity falls from 151g/kWh in 2023 to 51g/kWh in 2030 after an addition of a further 81.8GW of wind and solar. This gives a measly reduction of just 0.8g/kWh per GW of extra capacity (9/n) Image
If we believe the Government can achieve the big acceleration of wind and solar deployment, NESO estimate it will cost £260-290bn. Assuming 8% cost of capital & 2% operations costs, we can expect our bills to rise by £26-29bn per annum or about £1,000 per household (10/n)
The diminishing returns on extra wind and solar capacity means that to achieve the truly "zero-carbon electricity" promised in their manifesto, Labour will send our electricity bills to infinity and beyond. (11/n)
If you enjoyed this thread please like and share. You can sign up for free to read the full article here (12/12):

davidturver.substack.com/p/to-infinity-…Image
Hi @threadreaderapp unroll please.

• • •

Missing some Tweet in this thread? You can try to force a refresh
 

Keep Current with David Turver

David Turver Profile picture

Stay in touch and get notified when new unrolls are available from this author!

Read all threads

This Thread may be Removed Anytime!

PDF

Twitter may remove this content at anytime! Save it as PDF for later use!

Try unrolling a thread yourself!

how to unroll video
  1. Follow @ThreadReaderApp to mention us!

  2. From a Twitter thread mention us with a keyword "unroll"
@threadreaderapp unroll

Practice here first or read more on our help page!

More from @7Kiwi

Oct 26
New research from More In Common shows high energy prices are driving a revolutionary mood. When asked about our institutions, 43% of people can't help thinking "just let them all burn". What is going on. (1/n) Image
First, there is widespread concern and stress about energy bills across all income groups, even those households earning >£100,000/yr (2/n) Image
In a superbly ironic twist, nearly three quarters of Labour and Green voters are concerned about high energy bills this winter. Turns out renewables aren't cheap after all (3/n) Image
Read 10 tweets
Oct 15
In preparation for my appearance at #BattleFest on Saturday, I've written a new article on Why is My Energy Bill So High? A thread 🧵(1/n) Image
First off, we have the highest industrial electricity prices in the developed world and the second highest domestic prices. Prices like this represent an existential threat to the economy (2/n) Image
Gas plays a part in setting the wholesale price of electricity, and the cost of gas used in electricity generation in 2024 was about £5.5bn (3/n)
Read 11 tweets
Oct 12
Despite receiving huge subsidies and curtailment payments, yet another wind farm investor is issuing profit warnings. What is going on at Greencoat UK Wind $UKW ? Sunday thread 🧵(1/n) Image
The UKW share price has been on a downward trend since peaking in September 2022 despite paying large dividends and buying back shares (2/n) Image
The large dividends can be paid because the windfarms UKW has a stake in have been paid billions in subsidies, over £8.7bn in total, of which UKW will have received a share. They also get paid to turn off when it's too windy - curtailment payments (3/n) Image
Read 13 tweets
Oct 5
How do you go bankrupt? Slowly at first, then suddenly. How does Net Zero crumble? Slowly at first, then suddenly. Net Zero is collapsing faster than the coal power stations blown up by Alok Sharma. A thread (1/n) Image
Not too long ago, the Climate Change and Net Zero agenda was seemingly impregnable. Party leaders agreed to put the agenda outside democratic control (2/n) Image
At COP26 the Tories were falling over themselves to comply with the agenda: blowing up coal power stations and aligning £trillions of global finance towards Net Zero (3/n)
Read 10 tweets
Oct 1
New data out yesterday showed UK industrial electricity prices are the highest in the IEA. No wonder Ed Miliband is beginning to show signs of strain. What's going on under the surface? A thread (1/n) Image
Industrial electricity prices are indeed the highest in the IEA, 63% higher than the median and 3.5X more than Canada (2/n) Image
We fare better on industrial gas prices, with ours being a little below the IEA median and lower than both Germany and France. But Canadian gas prices are 6X lower than the UK (3/n) Image
Read 9 tweets
Sep 28
This week’s thread kicks off a mini-series looking at the risks facing renewables investment funds such as ORIT, highlighting their share price declines amid profit warnings in the wind sector (1/13). Image
ORIT's share price has been in a trending down since peaking in August 2022. Despite paying out £33.5m in dividends in 2024 and buying back £6.8m of its shares (with more buybacks in 2025), the price keeps falling. The fund aims for income & growth, but it's struggling (2/13). Image
Dividends have risen from 3.18p per share in 2020 to 6.02p in 2024. However, the Net Asset Value (NAV) is declining, though not as sharply as the share price. ORIT's portfolio spans 41 assets across solar, batteries, hydrogen, onshore, and offshore wind (3/13).
Read 14 tweets

Did Thread Reader help you today?

Support us! We are indie developers!


This site is made by just two indie developers on a laptop doing marketing, support and development! Read more about the story.

Become a Premium Member ($3/month or $30/year) and get exclusive features!

Become Premium

Don't want to be a Premium member but still want to support us?

Make a small donation by buying us coffee ($5) or help with server cost ($10)

Donate via Paypal

Or Donate anonymously using crypto!

Ethereum

0xfe58350B80634f60Fa6Dc149a72b4DFbc17D341E copy

Bitcoin

3ATGMxNzCUFzxpMCHL5sWSt4DVtS8UqXpi copy

Thank you for your support!

Follow Us!

:(