There is no limit to our electricity bills as new spending on renewables has diminishing impact on emissions intensity. Our bills are going to infinity and beyond. A thread (1/n)
First up, we need to acknowledge that measuring the emissions intensity of electricity generation is an imprecise science. Three different datasets from Ember, DUKES and NESO give different results although have a similar shape. (2/n)
The numbers are also a bit of a con, because they ignore the CO2 emissions from burning trees at places like Drax. If these are added back, assuming similar emissions as for coal, the the picture is less impressive (3/n)
Going back to the NESO data, it is clear that the main driver of reduced emissions intensity (solid orange line) has been the removal of coal from the system (grey area) (4/n)
From a peak in 2012, emissions intensity fell from 519g/kWh in 2012 to 195g/kWh in 2019 as coal generation fell from 137TWh to single digits. Each extra GW of wind and solar capacity led to a reduction in emissions intensity of 11.9g/kWh (5/n)
Since 2019, extra emissions reductions have been hard to come by, with emissions intensity falling to 151g/kWh after an addition of a further 9.2GW of wind and solar capacity. A reduction of just 4.8g/kWh per GW of added capacity (6/n)
This is hardly a surprising result because despite big increases in wind capacity, the minimum generation has hardly changed since 2015. 1 x 0 =0, 10 x 0 = 0 and 100 x 0 = 0 (7/n)
Looking at the dotted lines out to 2030, we first have to make an adjustment to the forecast emissions intensity. NESO and the Government decided to ignore the emissions from waste incineration and combined heat & power plants, another con. (8/n)
Adding that back means that emissions intensity falls from 151g/kWh in 2023 to 51g/kWh in 2030 after an addition of a further 81.8GW of wind and solar. This gives a measly reduction of just 0.8g/kWh per GW of extra capacity (9/n)
If we believe the Government can achieve the big acceleration of wind and solar deployment, NESO estimate it will cost £260-290bn. Assuming 8% cost of capital & 2% operations costs, we can expect our bills to rise by £26-29bn per annum or about £1,000 per household (10/n)
The diminishing returns on extra wind and solar capacity means that to achieve the truly "zero-carbon electricity" promised in their manifesto, Labour will send our electricity bills to infinity and beyond. (11/n)
If you enjoyed this thread please like and share. You can sign up for free to read the full article here (12/12):
Shortly before Christmas, Ofgem published its latest report on the Feed-in-Tariff scheme. Record costs impacting the poorest hardest and benefiting the rich the most. A thread 🧵 (1/n)
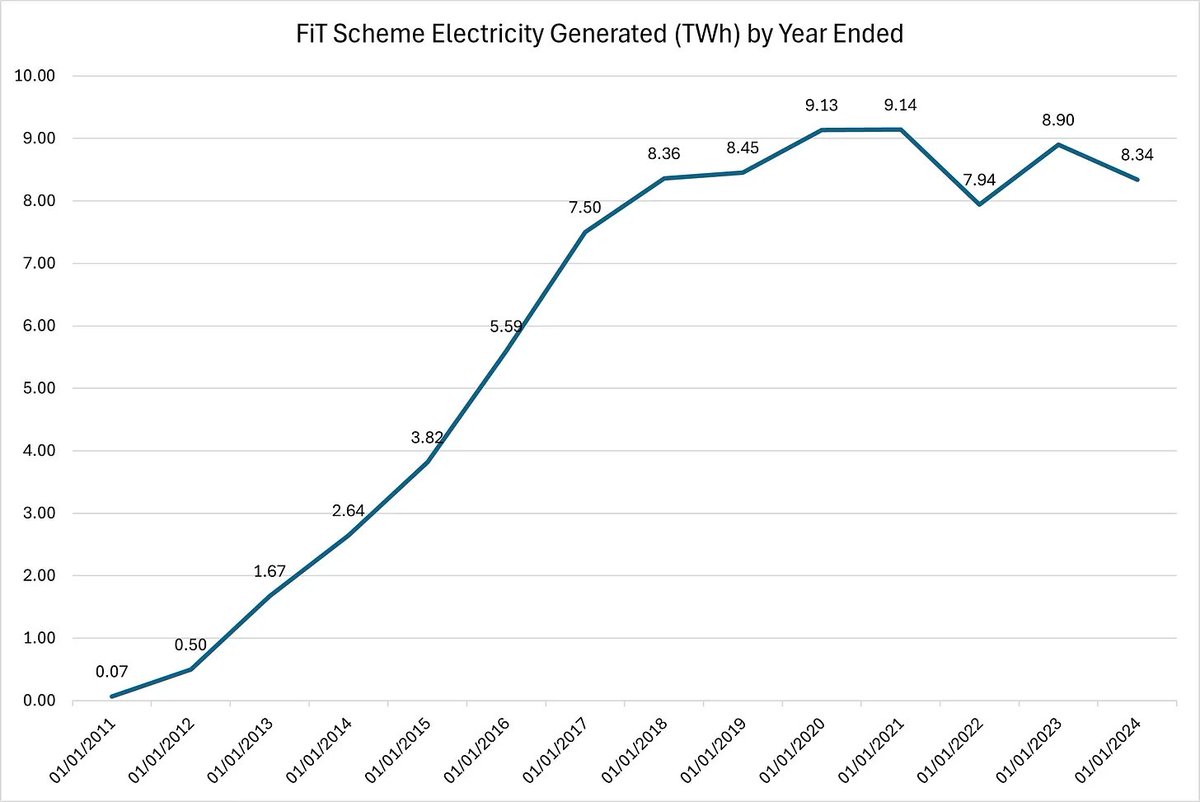
Electricity generation und the Feed-in-Tariff (FiT) scheme is actually down year-on-year and it now looks like there is a gentle downward trend emerging (2/n)
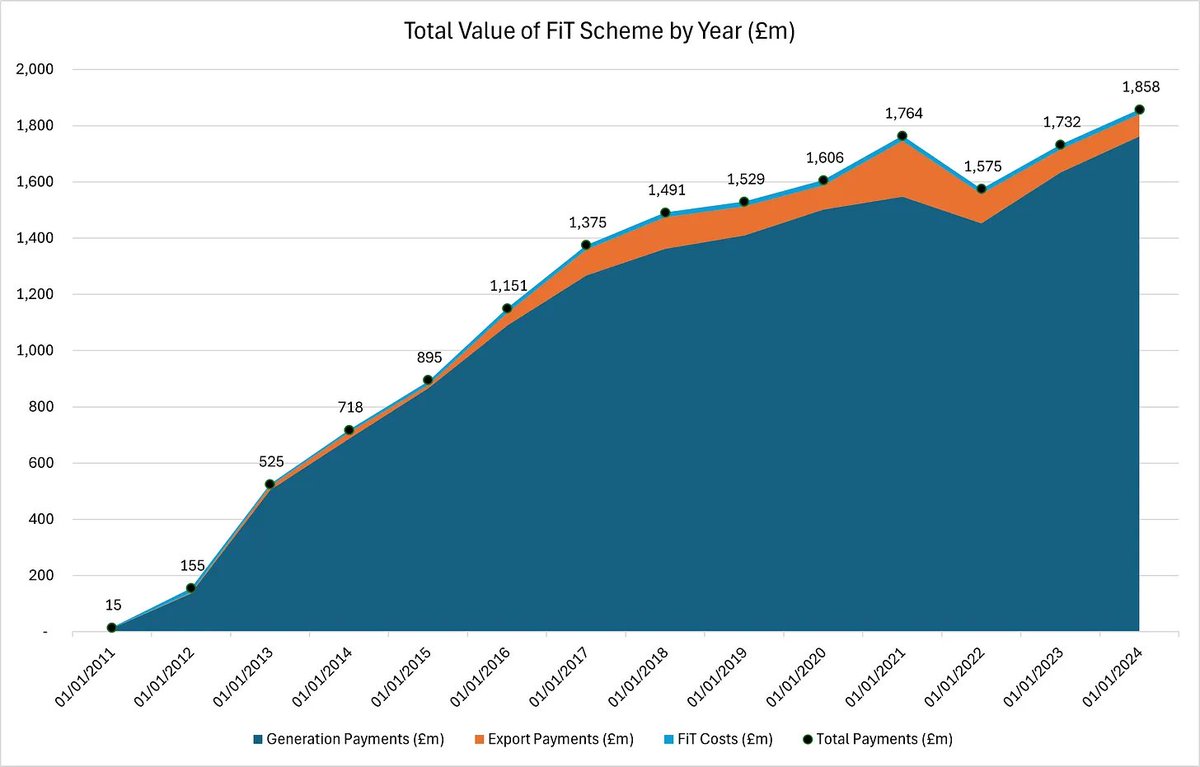
But the costs of the scheme are up sharply, reaching a new record high of £1,858m in FY2023/24, equivalent to about £65 per household. This is because tariffs are index-linked to RPI so will go up each year. (3/n)
I was going to write a serious thread about Miliband's Clean Power 2030 plan, but it's just a rehash of the NESO effort. So we will explore it through the medium of a play list to explain the impact (1/n)
Analysts have shown that 4,000 pensioners could die from the removal of the Winter Fuel Allowance. Many more non-pensioners could die because they lack the means to pay extortionate electricity prices. So we have Kill the Poor by the Dead Kennedys (2/n)
The punks from the late 1970’s and early 80’s really did understand where we were heading, even then. As we remove dispatchable power sources and rely more on interconnectors, the risk of blackouts is increasing (3/n)
How do electricity suppliers manage to supply "100% green electricity" when like this week, the wind runs out of puff? A thread 🧵(1/n)
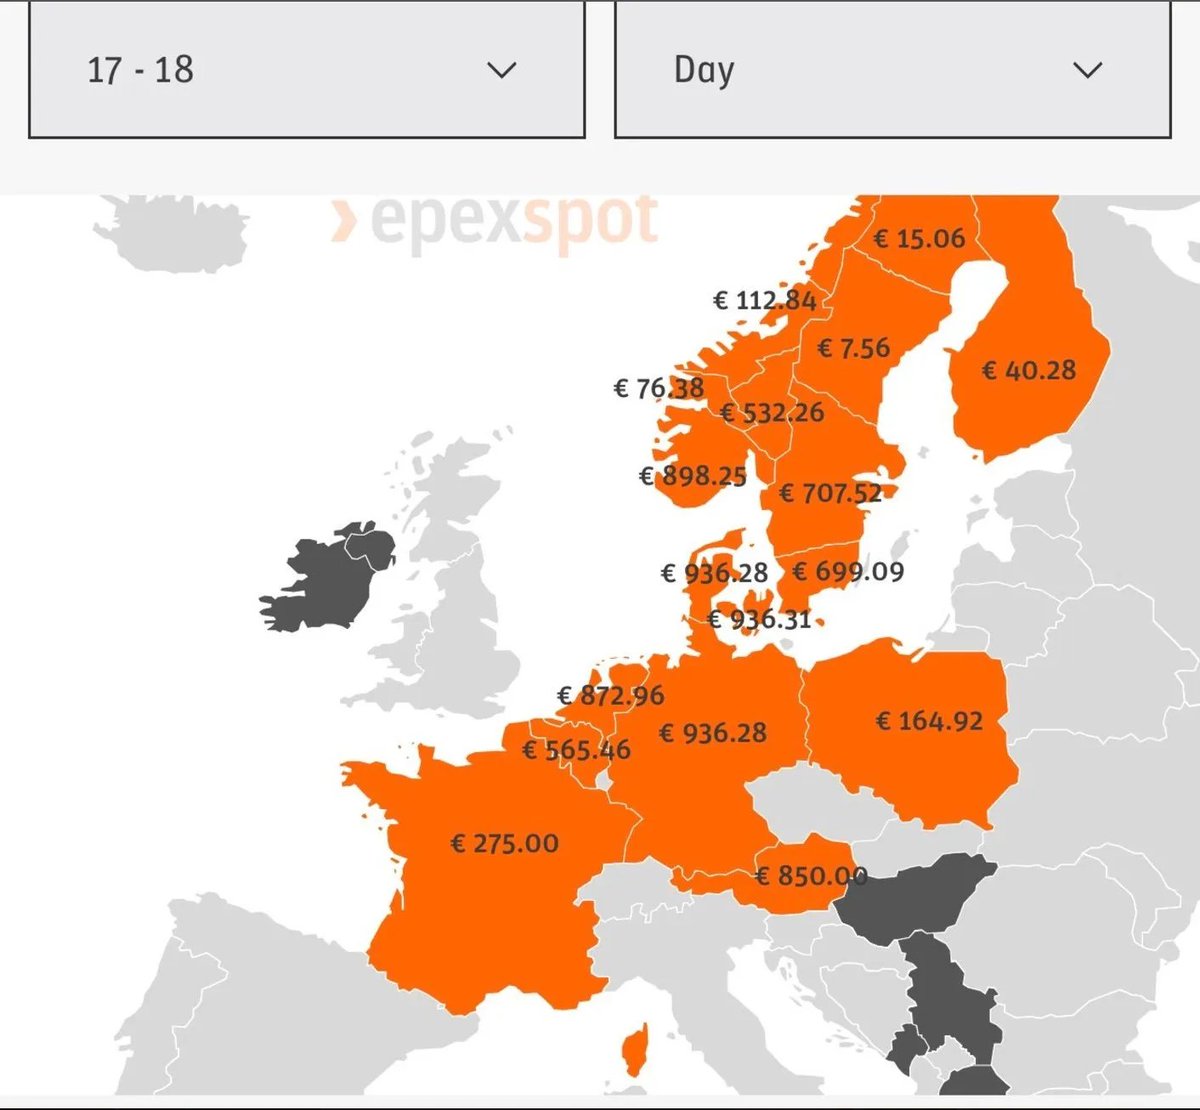
As a reminder, there was a wind drought across Europe thar sent prices spiralling upwards, with day ahead prices hitting €936/MWh in Germany and Denmark (2/n)
The UK was not immune with day ahead prices rising to over £400/MWh and one short-term bid being accepted for £3,105/MWh on Thursday (3/n)
Not too long ago, the Government launched the Subsidy Control Transparency Database. Last week it was updated with figures from renewables auction AR6. I counted £328bn of energy/Net Zero subsidies. Where is all the money going? A thread 🧵(1/n)
First up, there's energy generation subsidies. £45bn for AR6, £5bn for AR5 (no offshore wind), £15bn for AR4 & £15bn for earlier rounds. An extra £3.4bn for Hornsea wind farm, £2.1bn for Walney & £1.9bn for Beatrice. £15bn for remote island wind & £31bn on FiTs. (2/n)
That's a total of £87.4bn on CfDs, £15bn for remote island wind and £15bn for FiTs. Strangely, they only record ROC subsidies at £1 (yes one pound), even though they cost us over £7bn per year. (3/n)
Electricity suppliers are in some turmoil about zonal or locational pricing, with Octopus and Greg Jackson being passionate advocates and others like SSE being much more circumspect. So, will consumers get reamed by REMA? A thread 🧵(1/n)
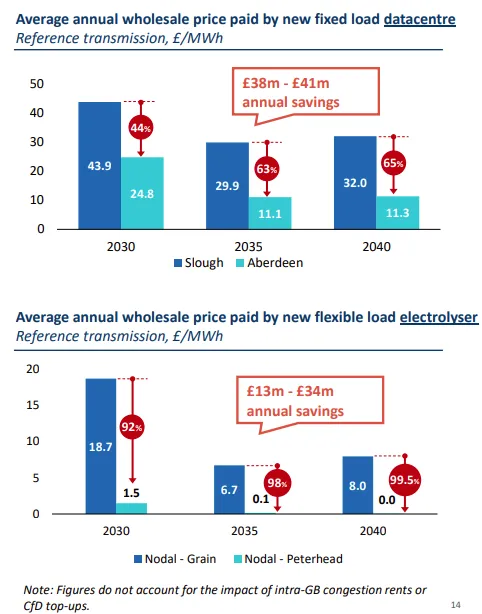
On the one hand, Octopus commissioned a report from FTI Consulting that claimed locational pricing could reduce electricity costs by up to 99.5% for electrolyser-type loads. Effectively they could receive almost free electricity (2/n)
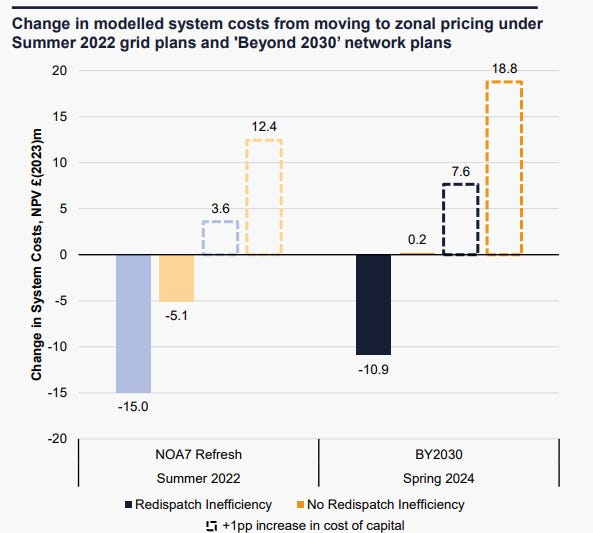
On the other hand, SSE used a report by LCP Delta to sound the alarm that locational pricing might actually increase system costs significantly. (3/n)
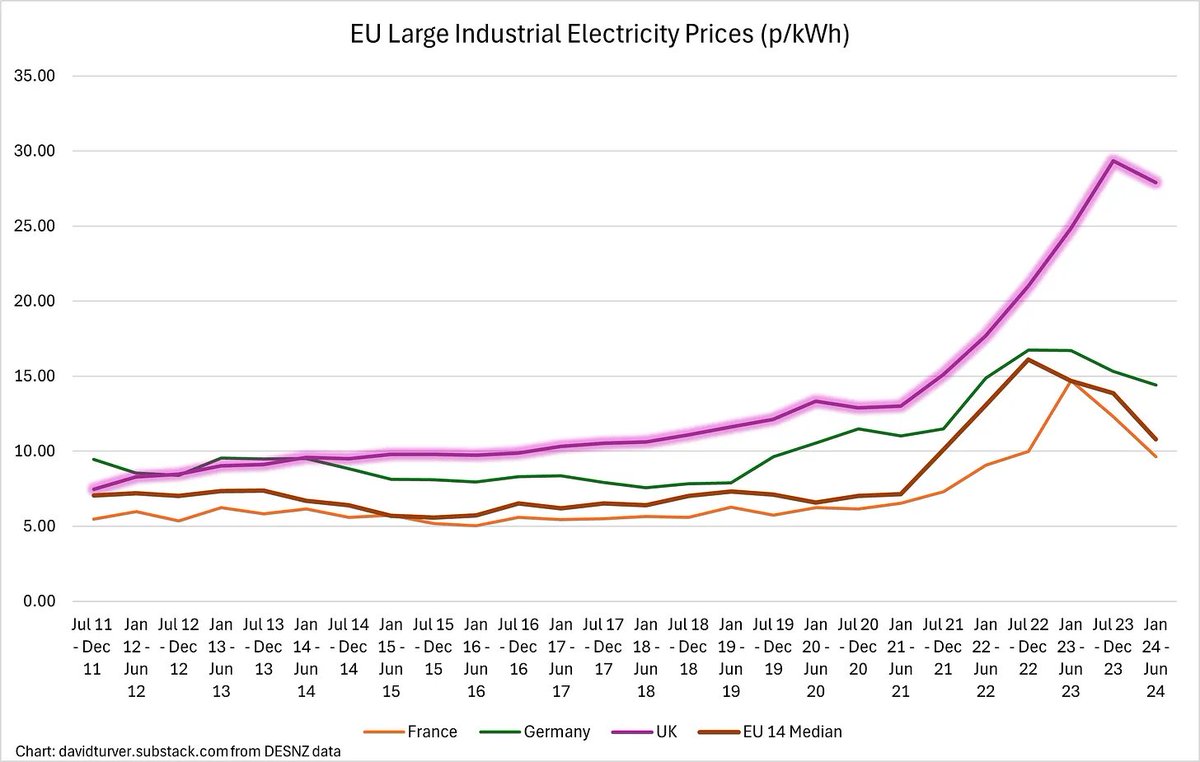
New data came out yesterday comparing energy prices across Europe for Jan-Jun 2024. The UK has by far the highest industrial electricity prices in Europe. This thread explores why that might be and how we fare in domestic markets too. (1/n)
For medium UK industrial users, prices are 188% higher than the EU14 median. For large & v large users the relative position is worse with UK prices >150% above EU14 median prices. Bear in mind, in 2023 UK prices were also 4X those of the US & 2.6X Korea. (2/n)
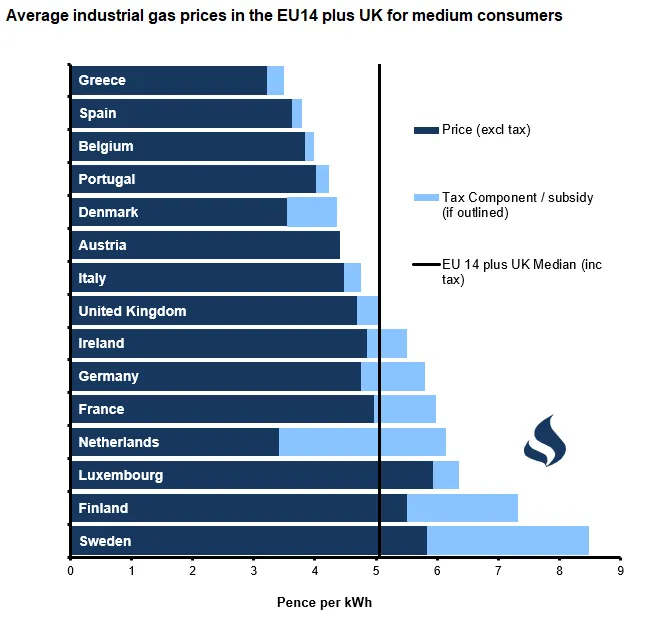
Renewables advocates always blame gas for our high prices. But UK industrial gas prices are around the EU14 median. This looks OK, until you realise that UK gas prices are some 5X those in the US & Canada (3/n)