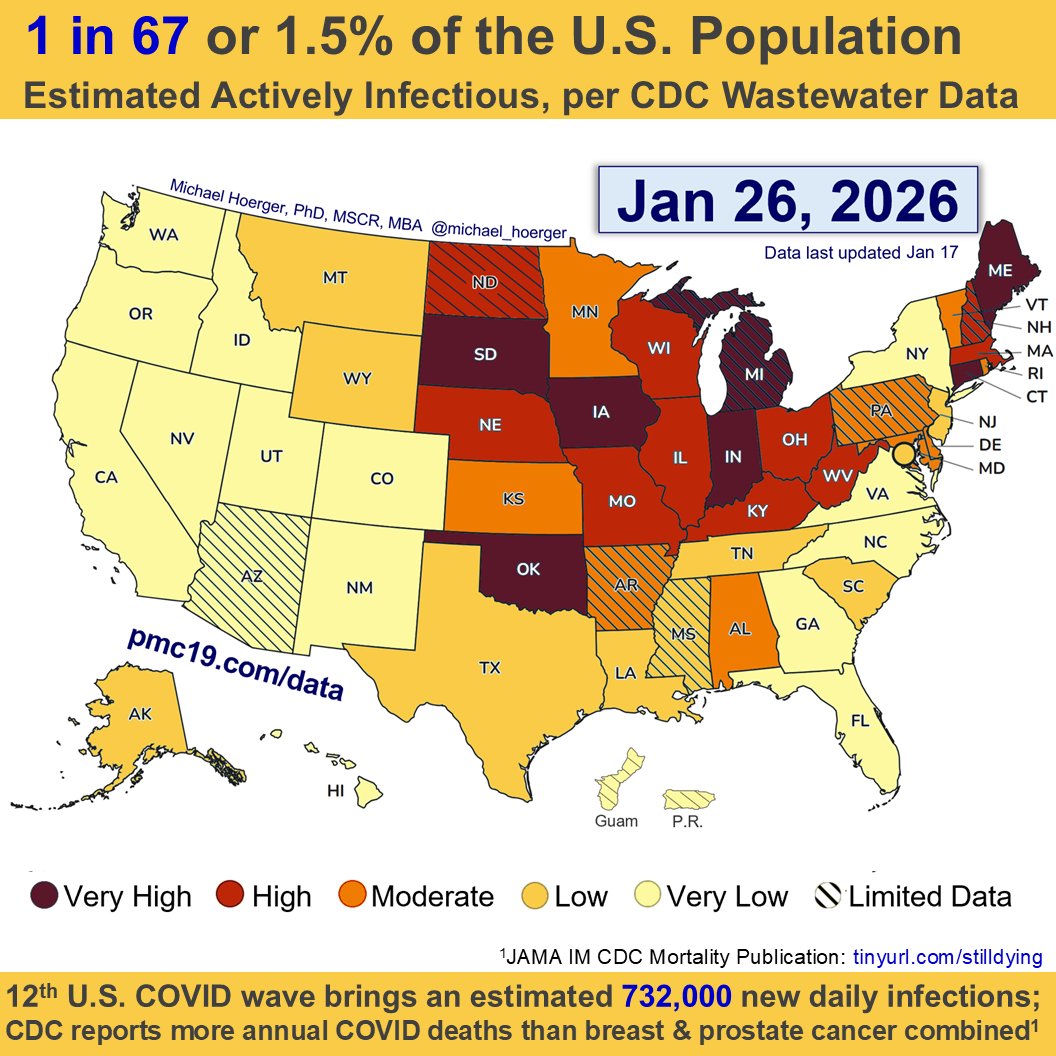
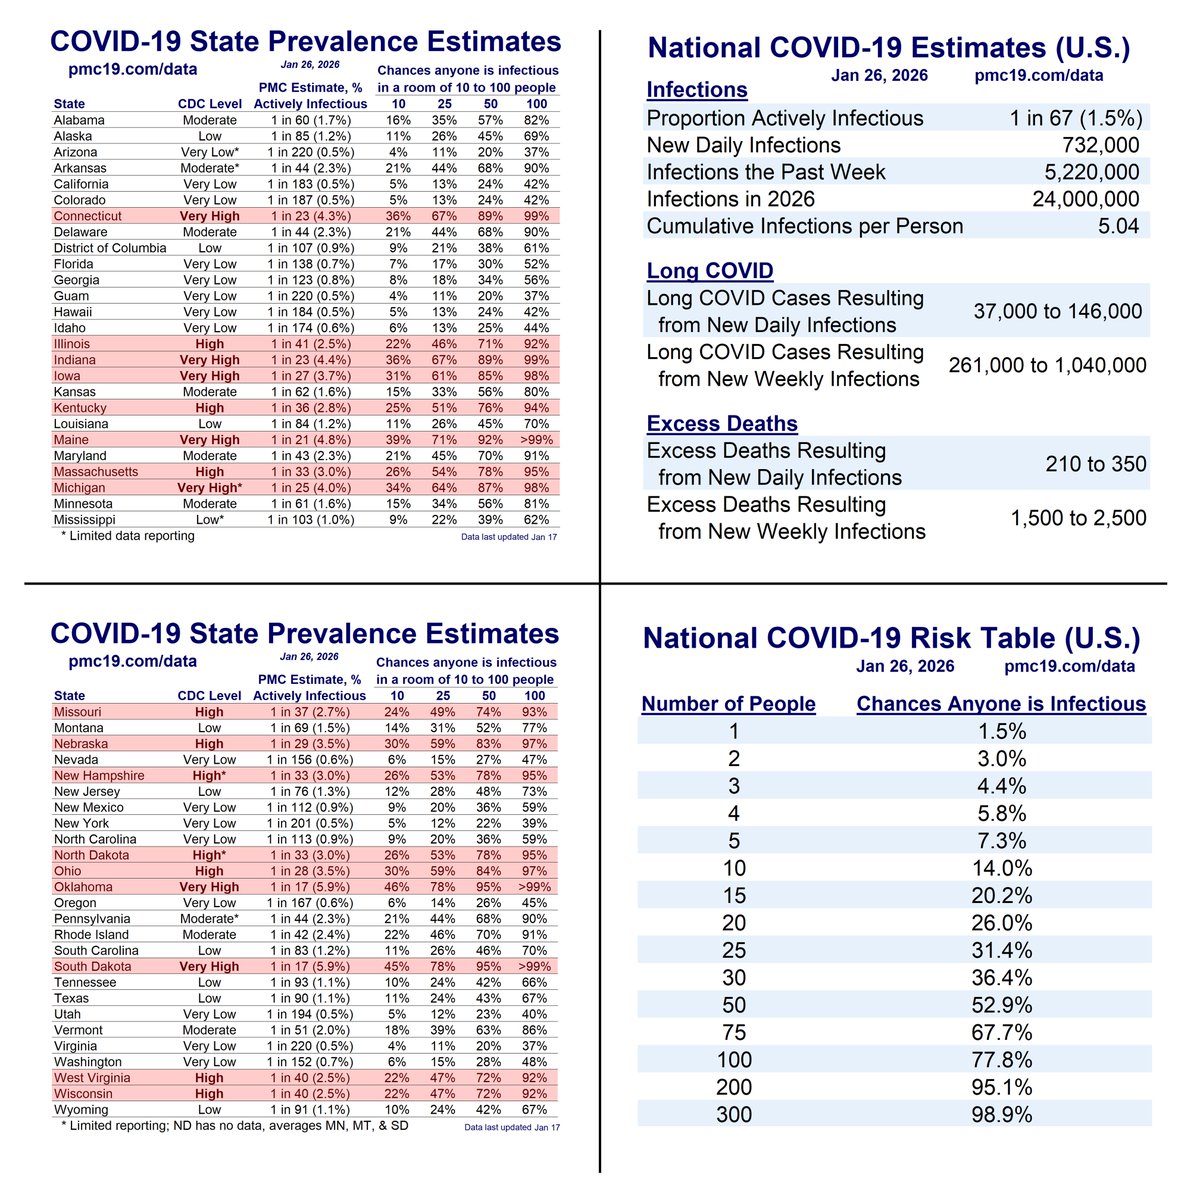
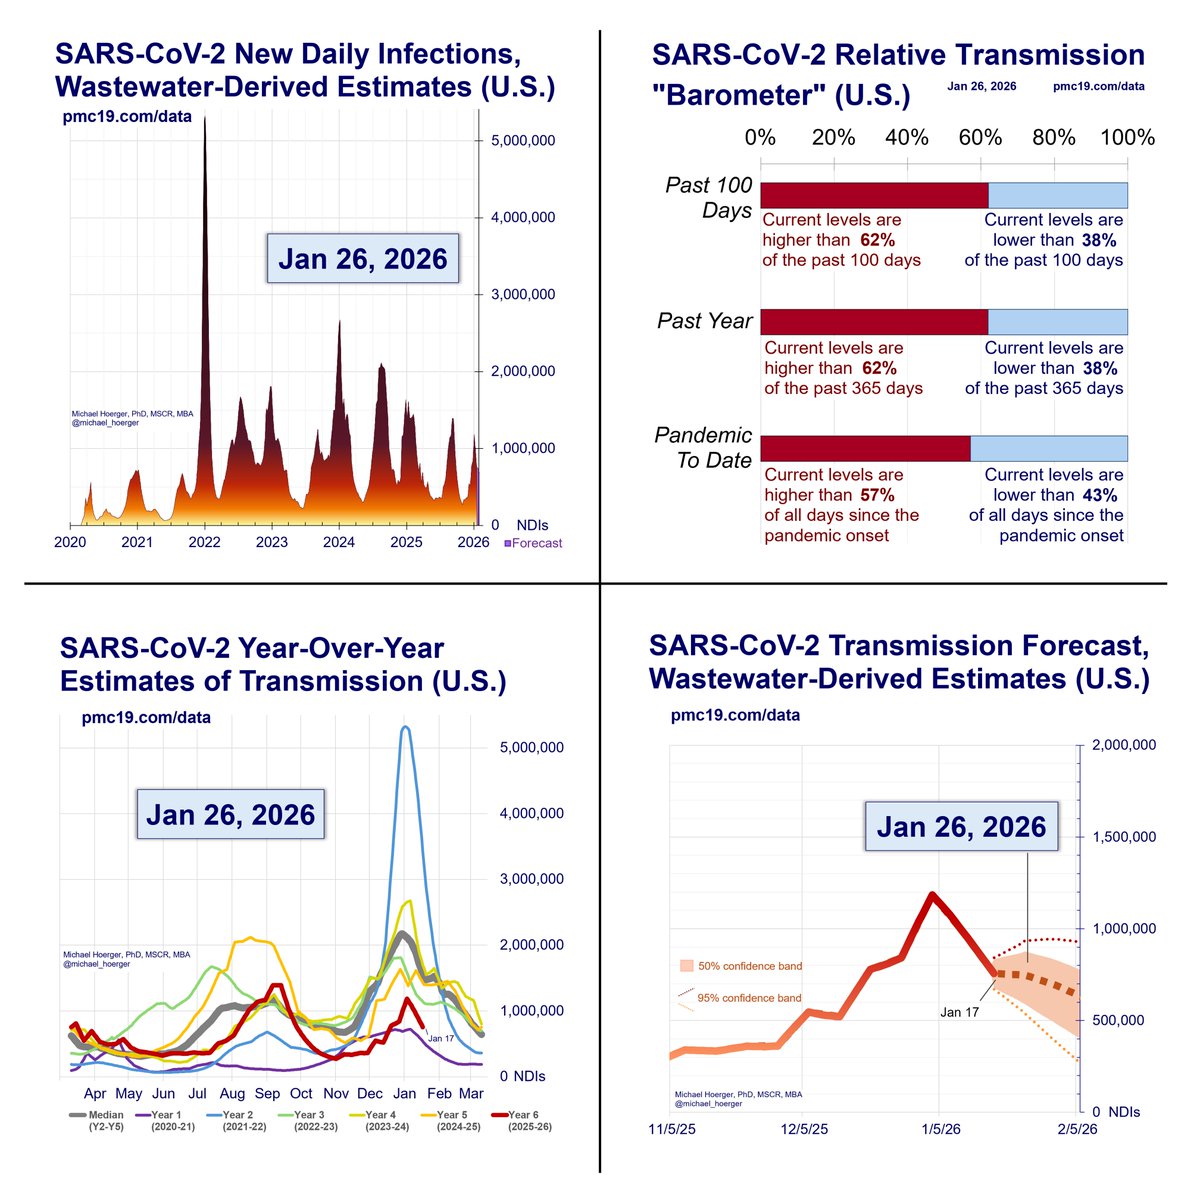
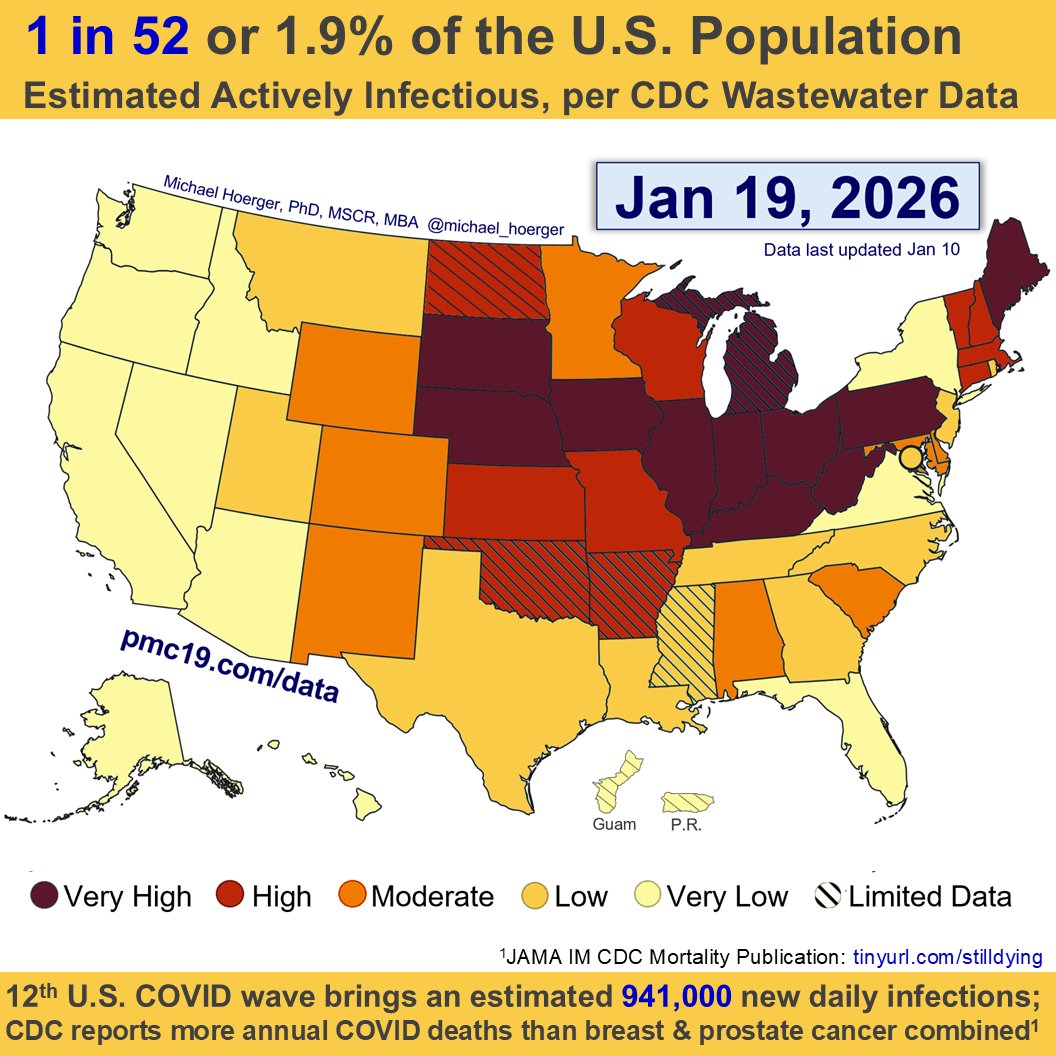
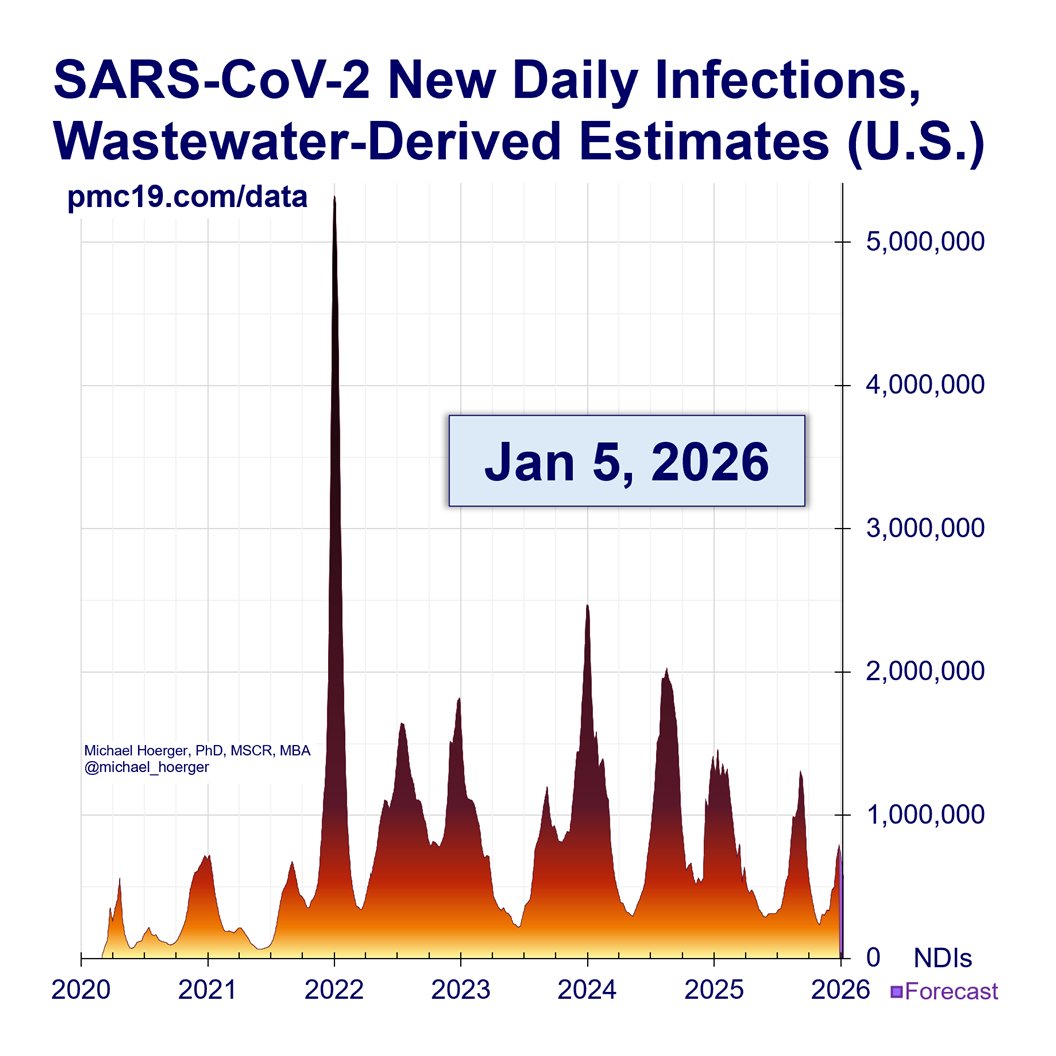
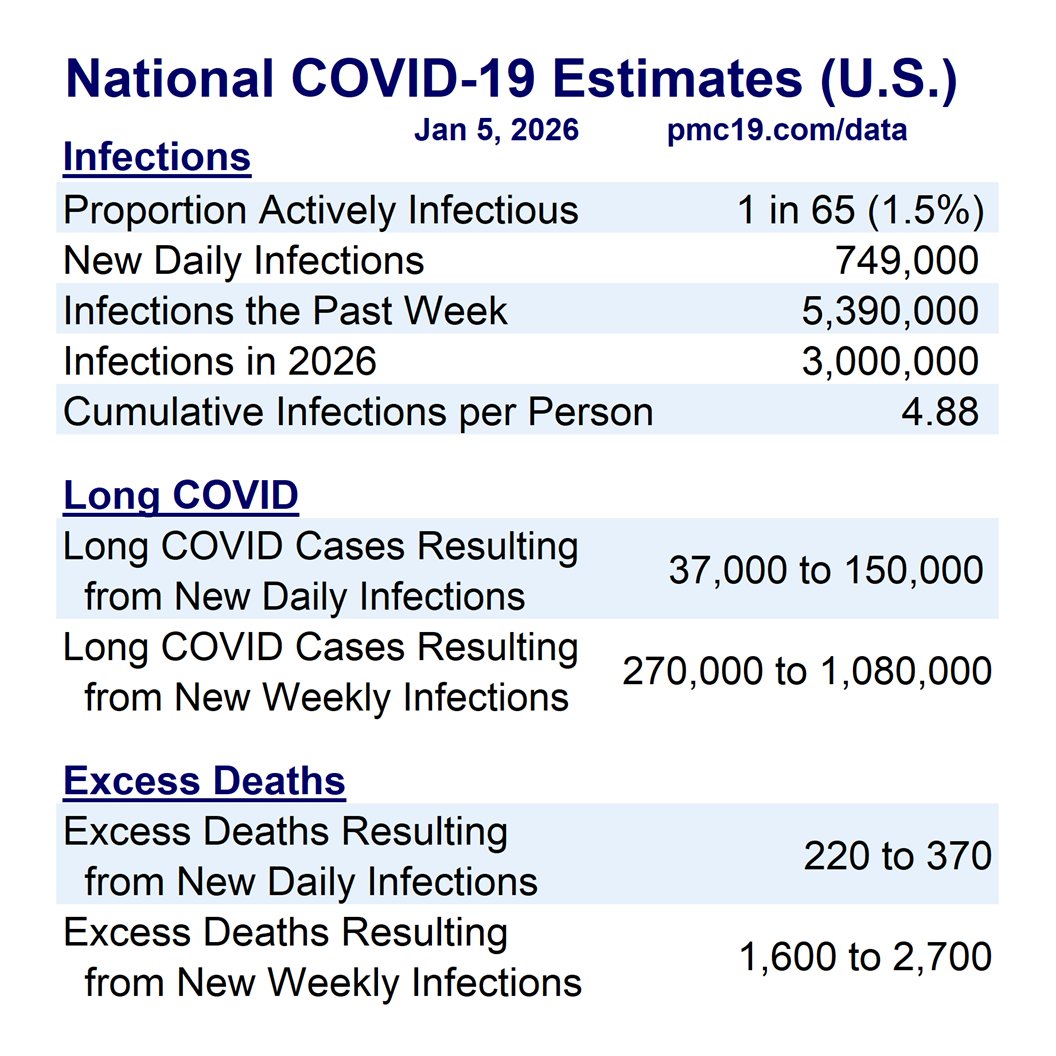
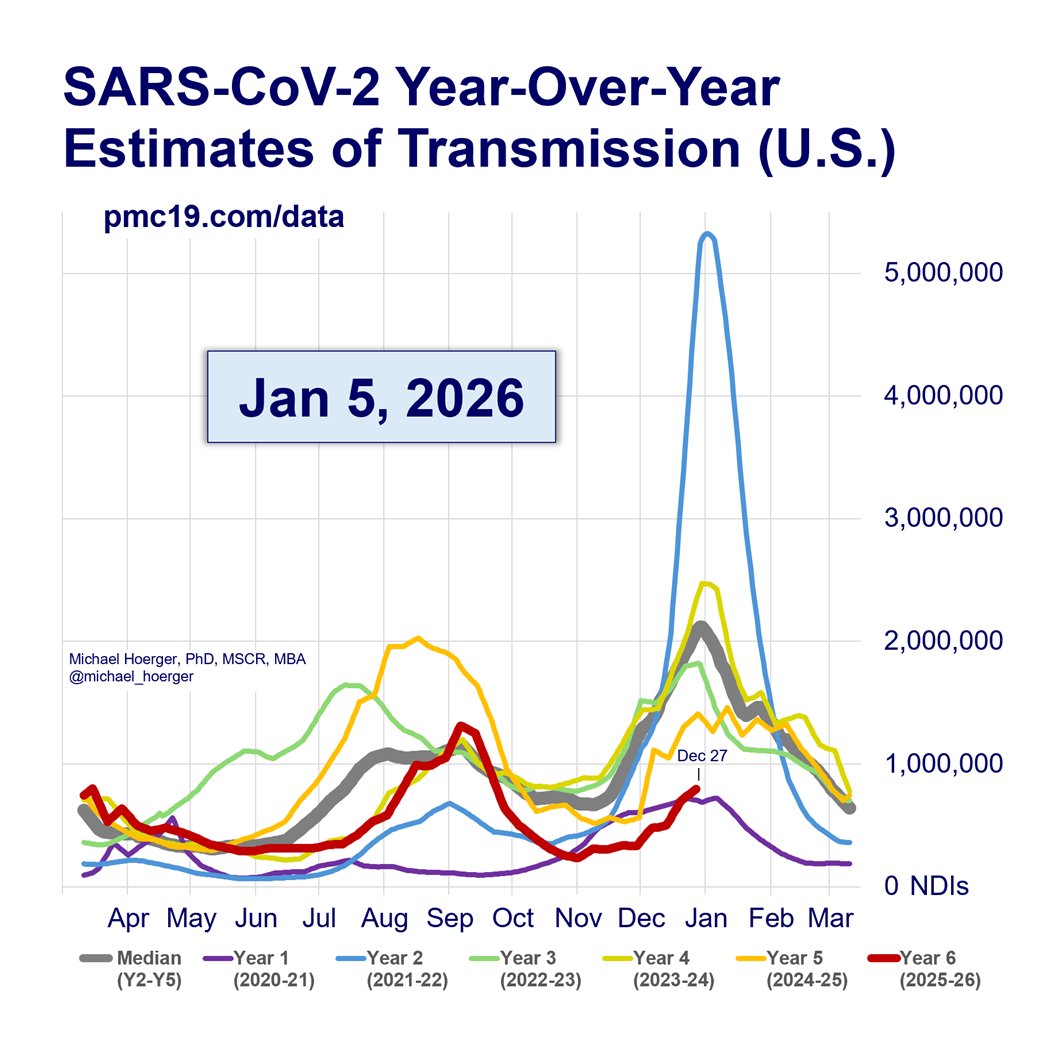
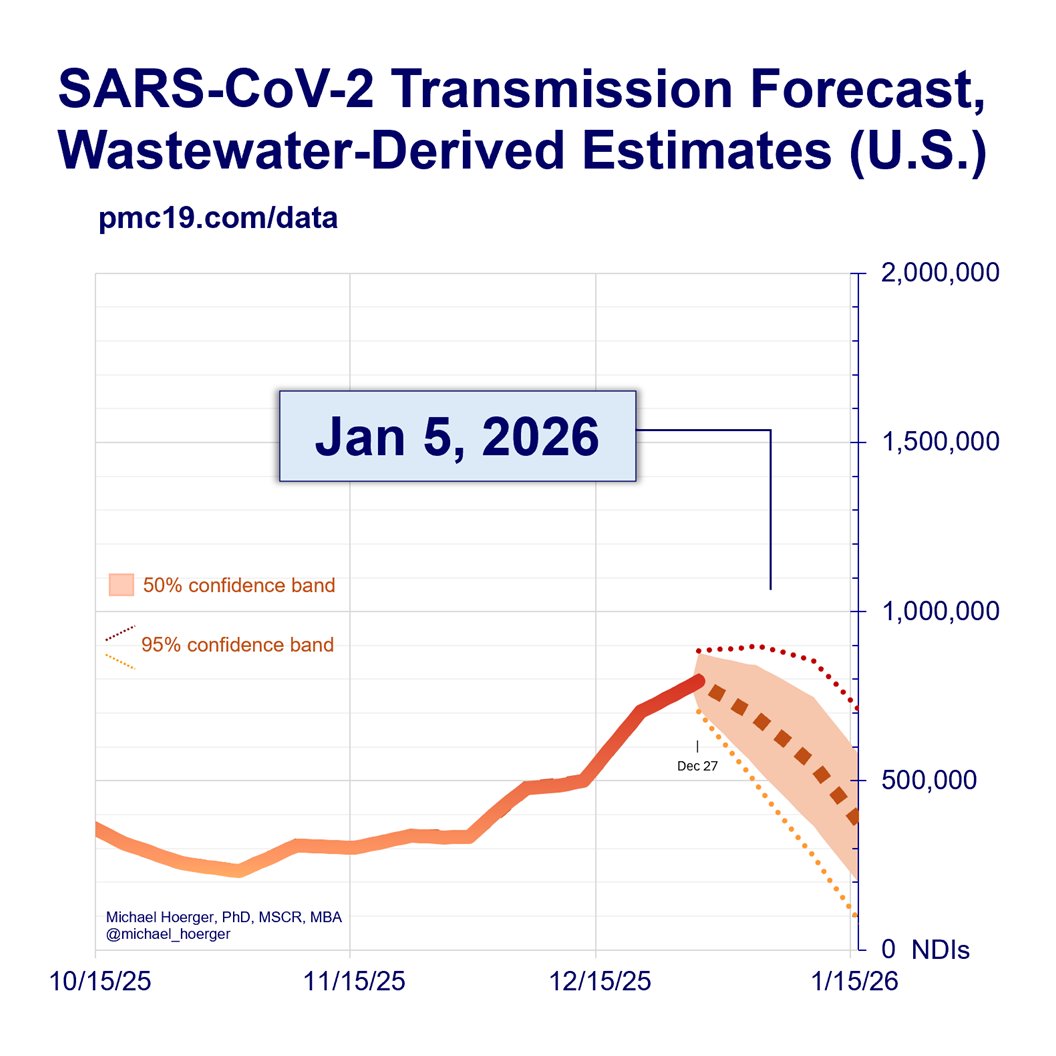
PMC COVID-19 Dashboard, Dec 30, 2024 (U.S.)
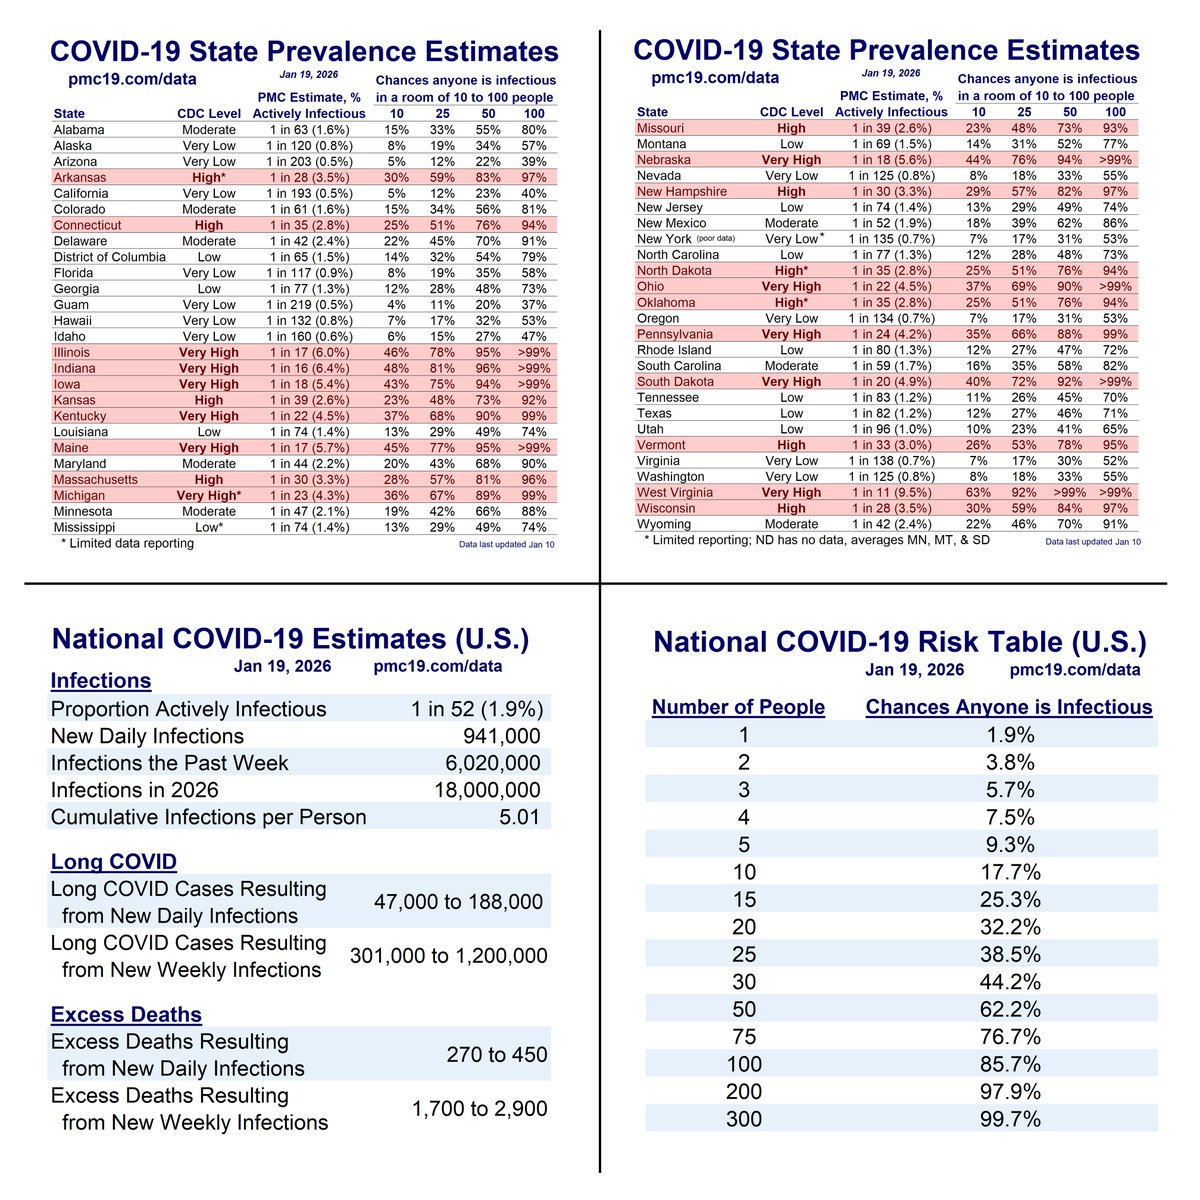
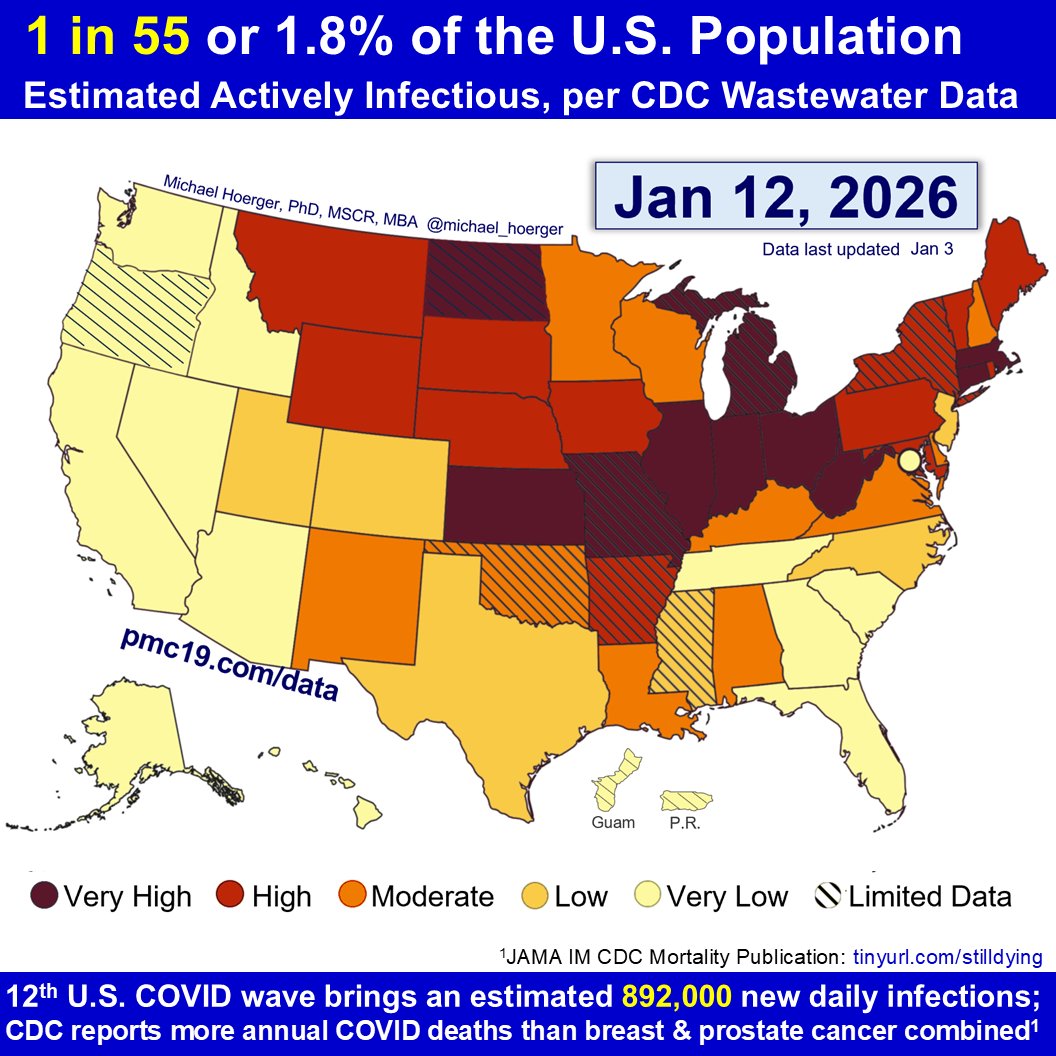
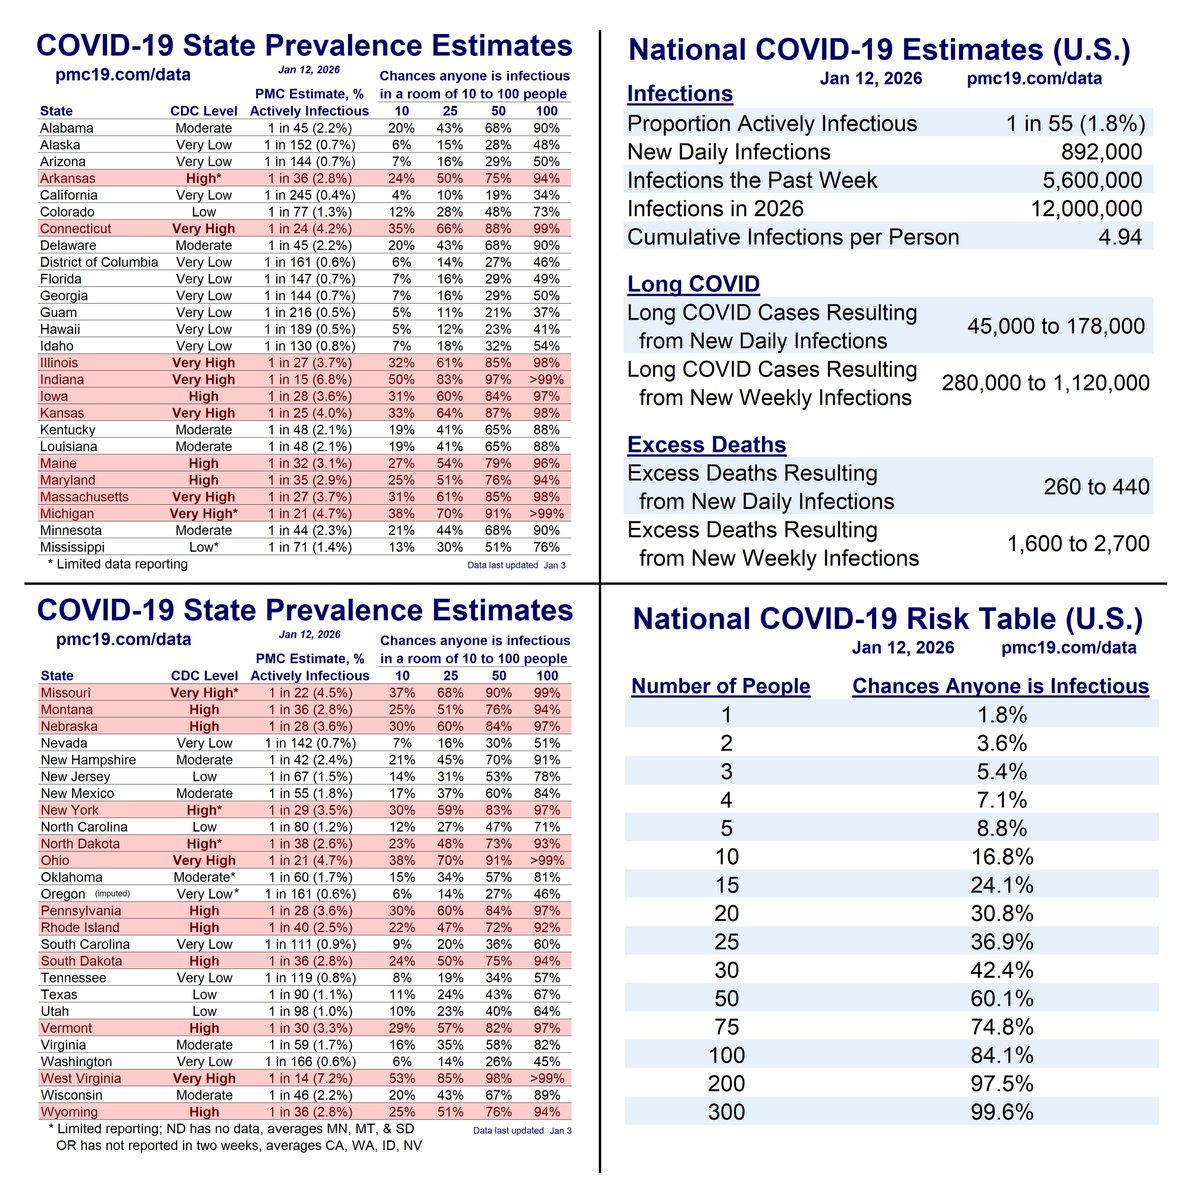
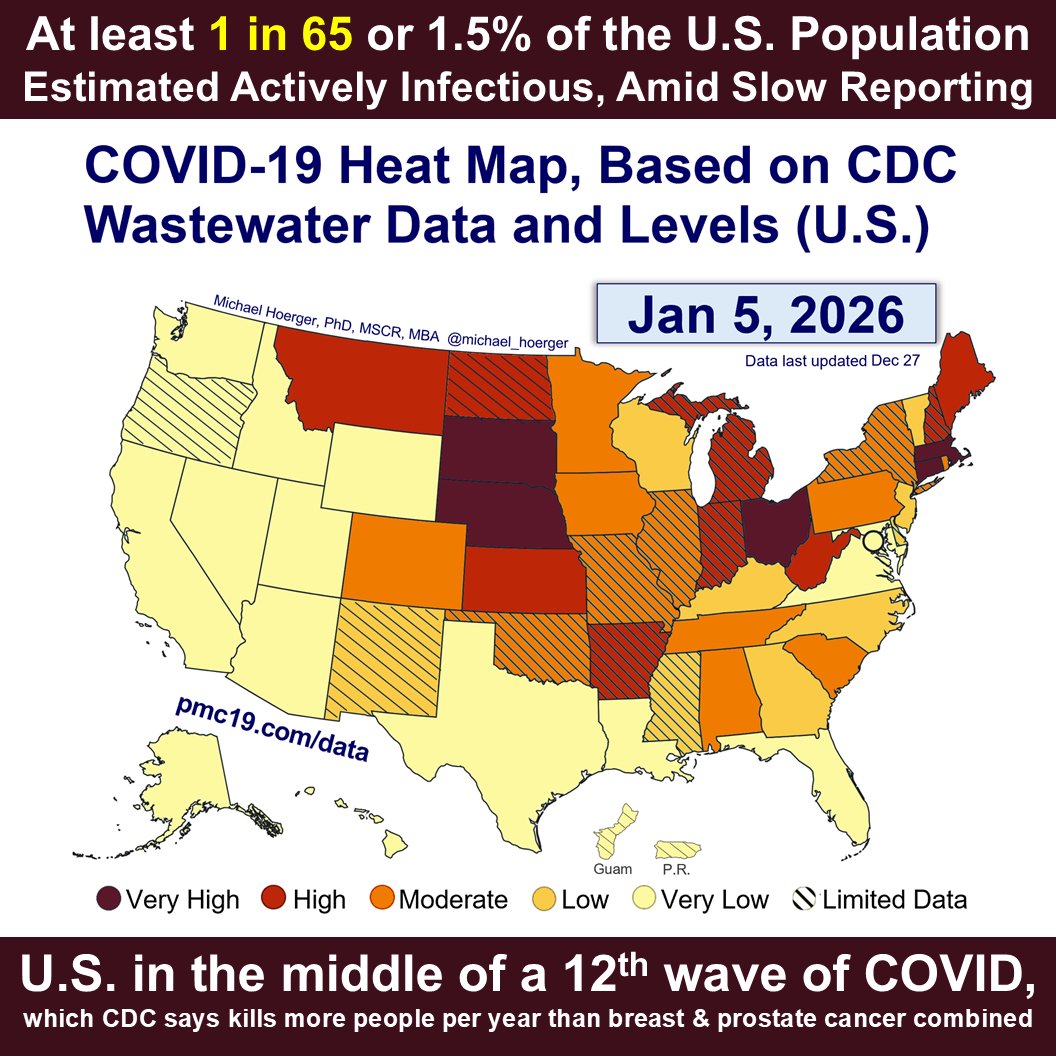
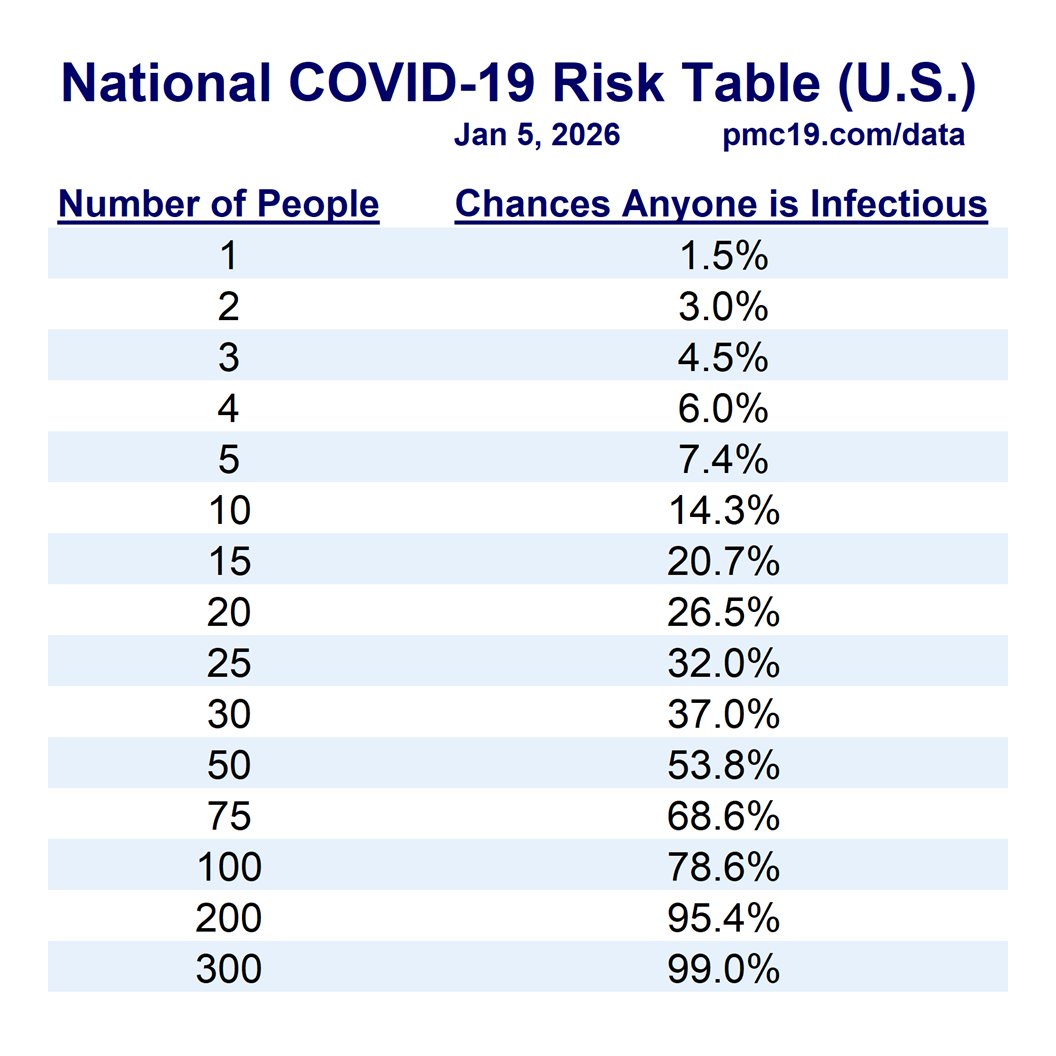
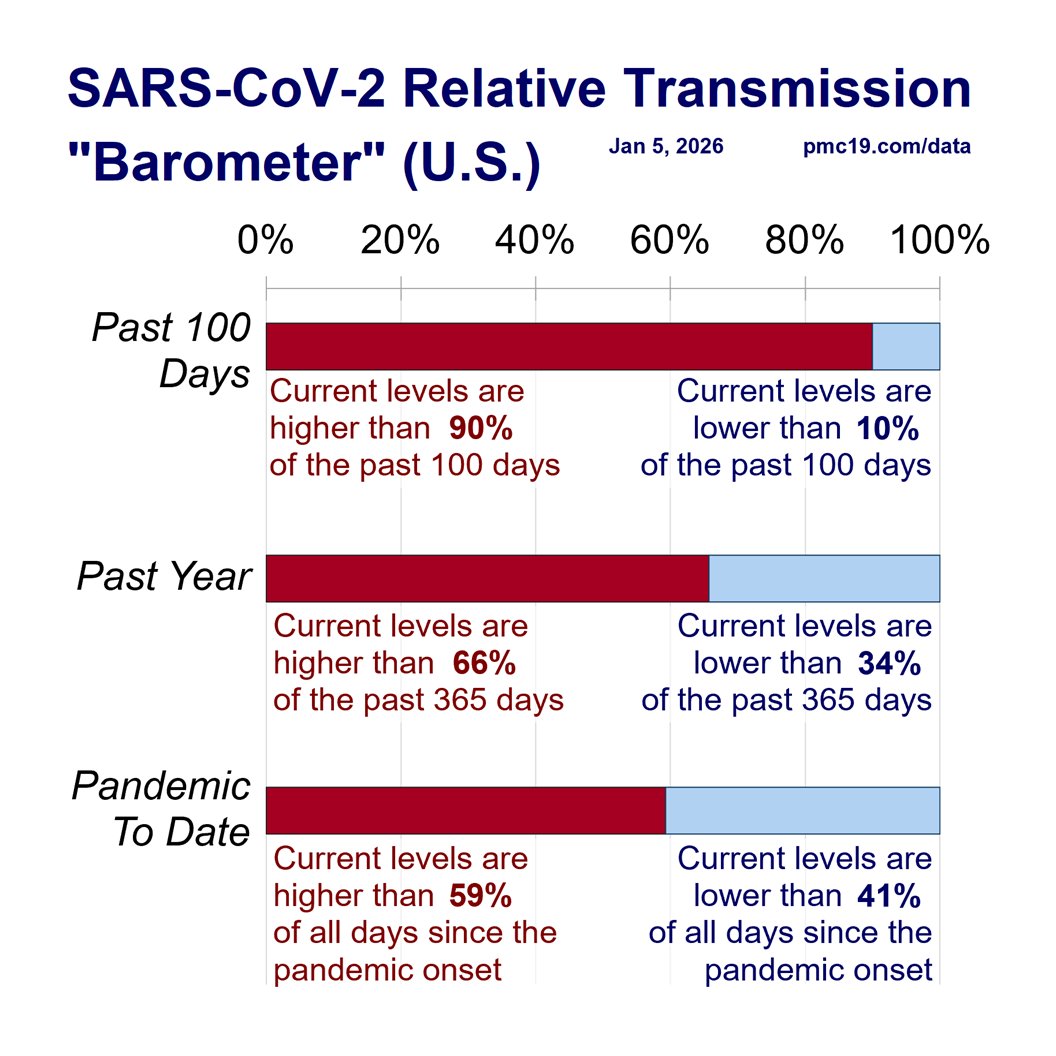
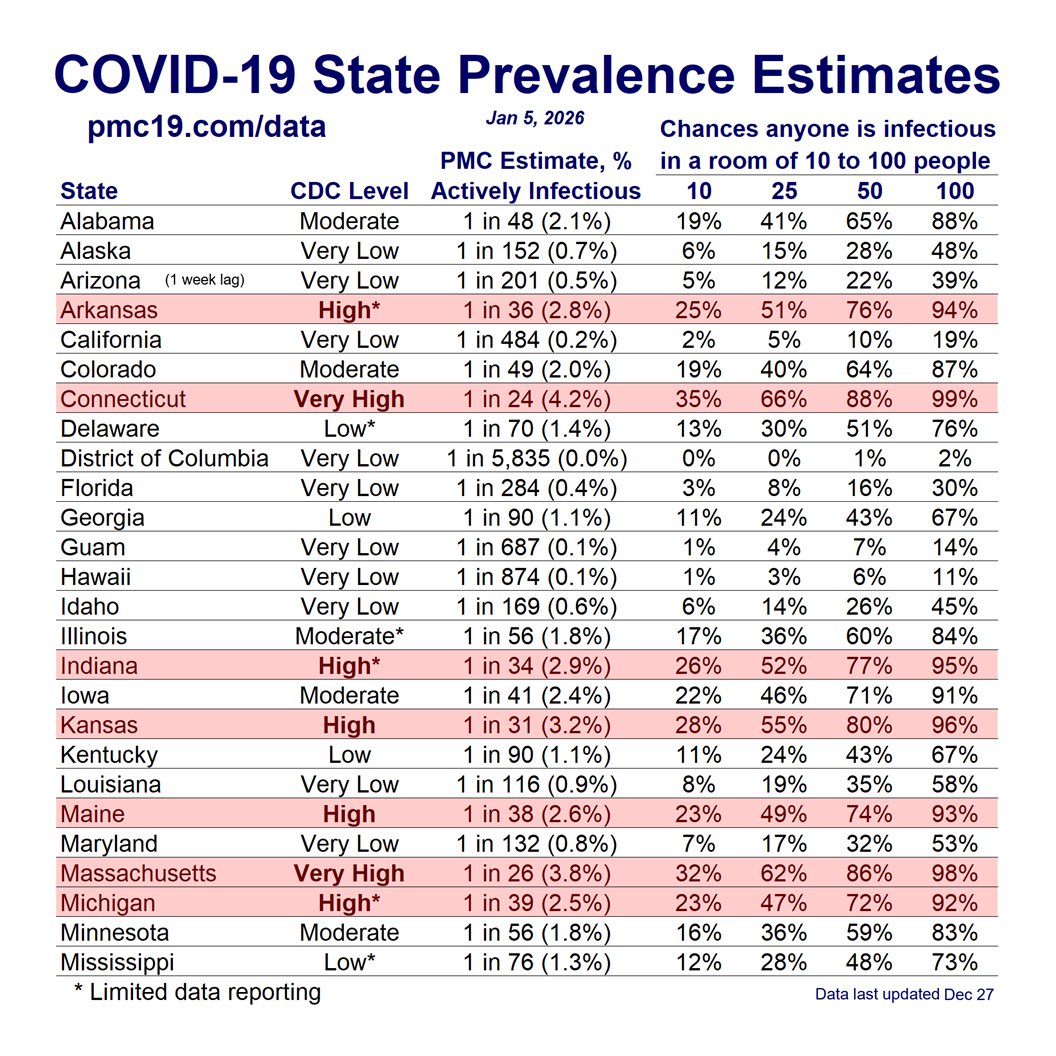
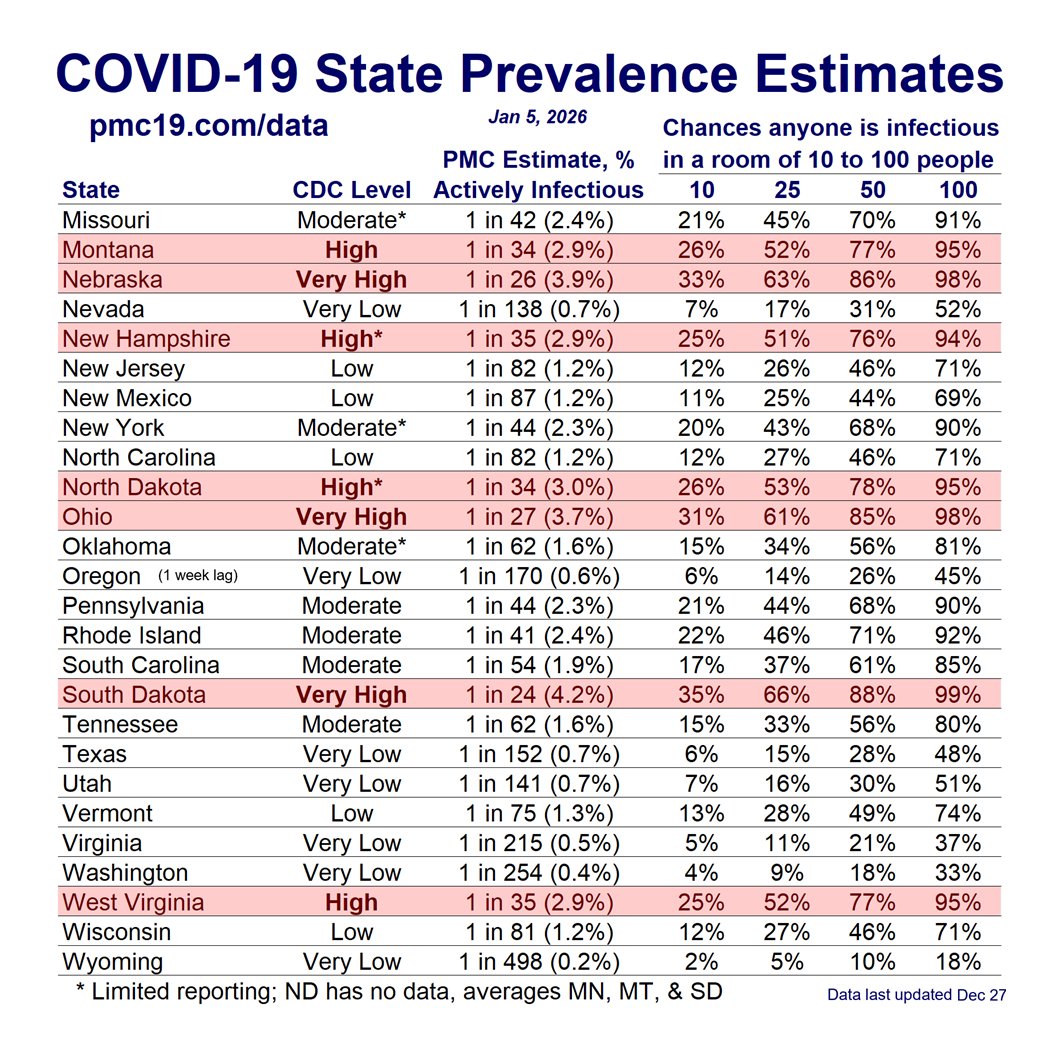
🔥1 in 50 people actively infectious
🔥1 in 3 chance of an exposure in a gathering of 20 on NYE
🔥6.7 million new infections per week
🔥>300,000 resulting #LongCOVID conditions/week
Info for new readers:
For those unfamiliar with the PMC model, find full weekly reports for the past 1.5 years at pmc19.com/data
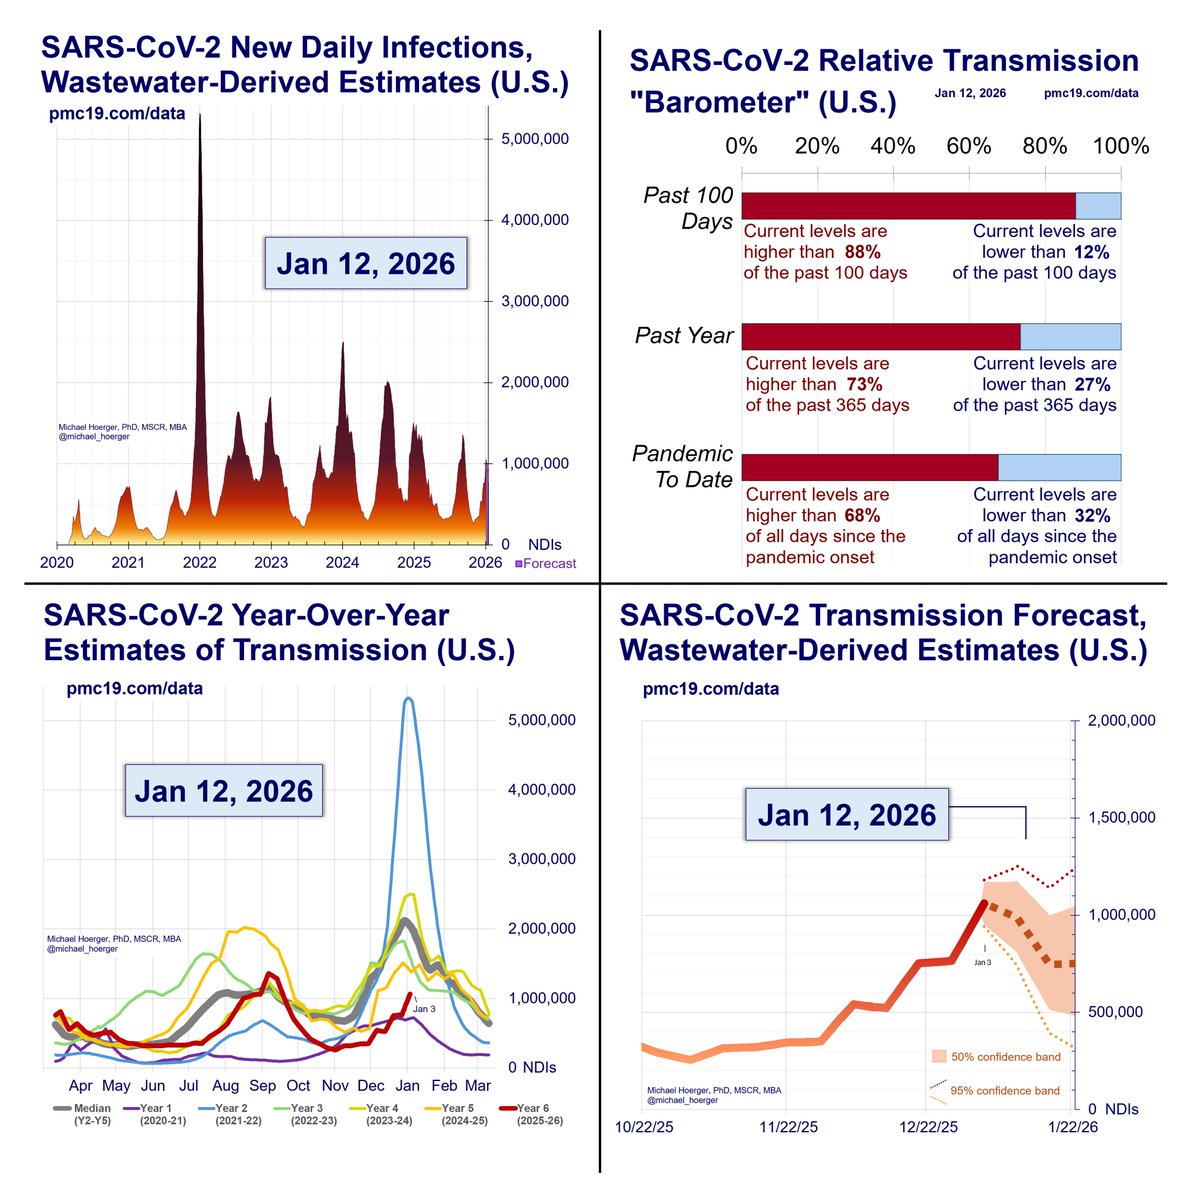
The models combine data from IHME, Biobot, and CDC to use wastewater to estimate case levels (r = .93 to .96) and forecast levels the next month based on typical levels for that date and recent patterns of changes in transmission the past 4 weeks. Our work has been cited in top scientific journals and media outlets, which are fully sourced in a detailed technical appendix at pmc19.com/data/PMC_COVID…
Examples include JAMA Onc, JAMA-NO, BMC Public Health, Time, People, TODAY, the Washington Post, the Institute for New Economic Thinking, Salon, Forbes, the New Republic, Fox, CBS, and NBC. See pgs 11-13 at the above link.
We will have a pre-print out in the next month documenting very compelling evidence for the validity of using wastewater to estimate case rates. Forecasting is challenging in the context of the current viral evolution, but the real-time estimates of cases are impressively accurate to the best we can evaluate it.
• • •
Missing some Tweet in this thread? You can try to
force a refresh


