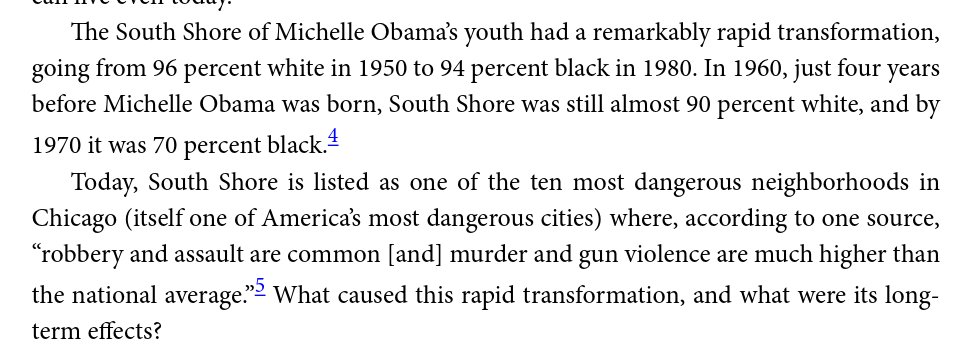
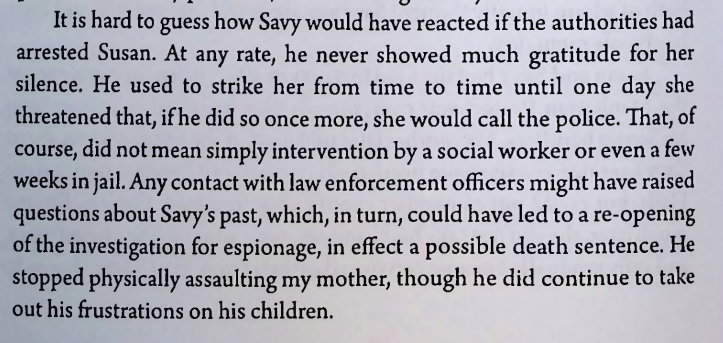
Some excerpts from the white flight chapter of Jeremy Carl's "The Unprotected Class": The "racial transformation" of urban neighborhoods in the 50s-80s was incredibly rapid, South Shore going from 96% white to 94% black in 30 years.
I did not know Rosa Parks was attacked in her own home in Detroit (by a black man).
"White flight resembles ethnic cleansing, but we blame the victims rather than the perpetrators."
Apparently, black city home value as percentage of white value follows the Baby Boom Pattern.
California voted to allow individual racial discrimination by homeowners when selling as a matter of property rights. This was, as is often the case, overturned by the Warren Court.
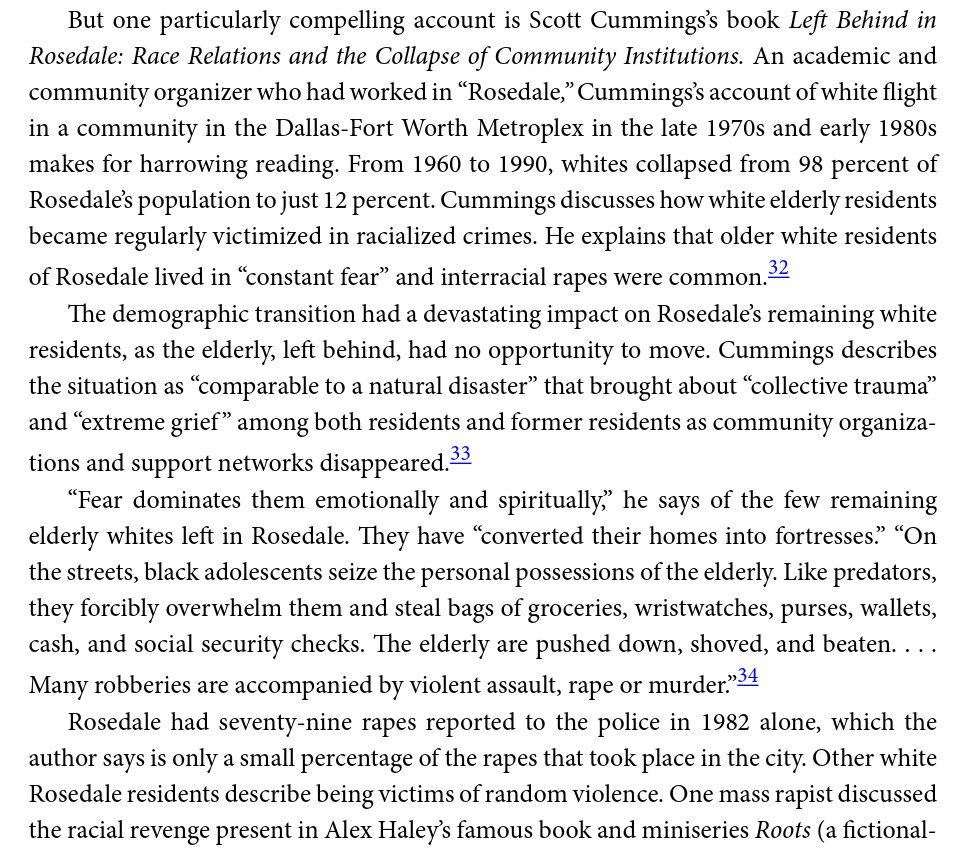
Rosedale mentioned. Mass racial revenge rapes of the elderly, sometimes covered up for with hate crime hoaxes.
Obama Administration's post-08 mortgage modifications essentially handed hundreds of billions to minorities.
AFFH: an Obama Admin policy to force cities everywhere in the country to build dense subsidized housing ("affordable") and actively recruit blacks to live there.
• • •
Missing some Tweet in this thread? You can try to
force a refresh
"It is every migrant’s dream to see the tables turned, to see long lines of Americans and Britons in front of the Bangladeshi or Mexican or Nigerian Embassy, begging for a residence visa." - Suketu Mehta, India-born NYU professor. This in an argument *for* immigration.
From "This Land is Their Land: An Immigrant's Manifesto". Mehta is a professor at New York University. America gave him a far better life than he could have had in India, plus a taxpayer-funded ticket into our cultural elite. And he despises us for it.
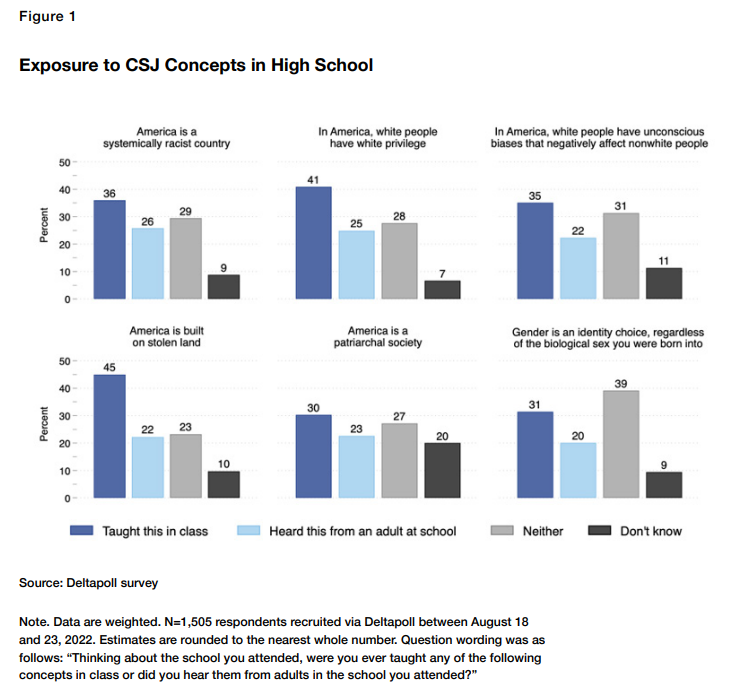
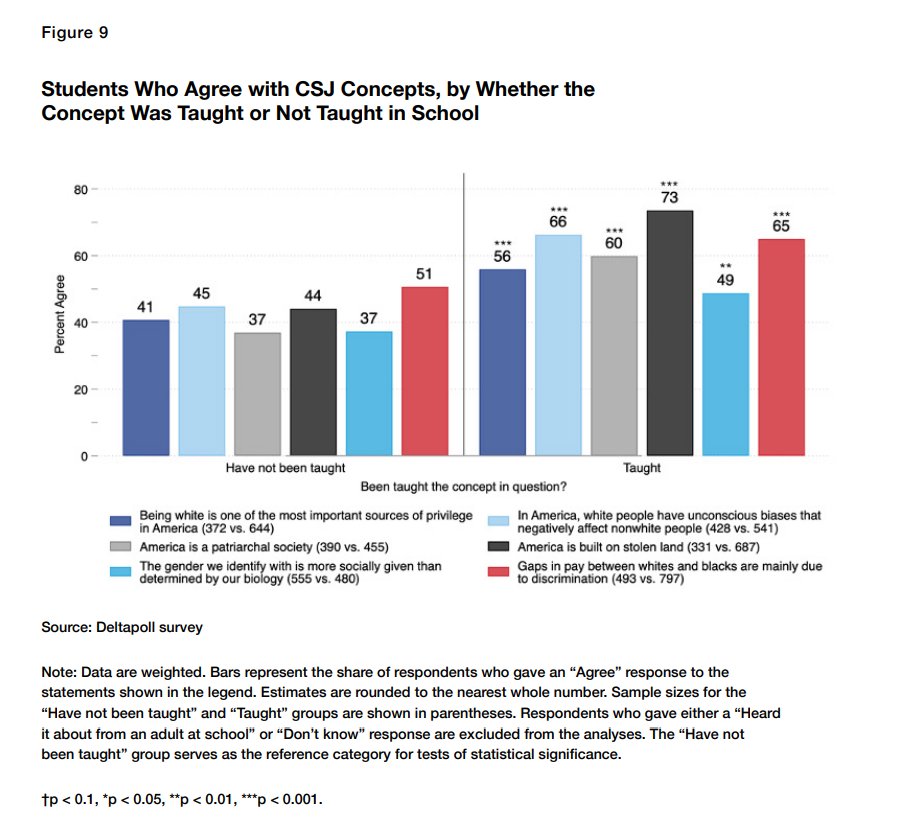
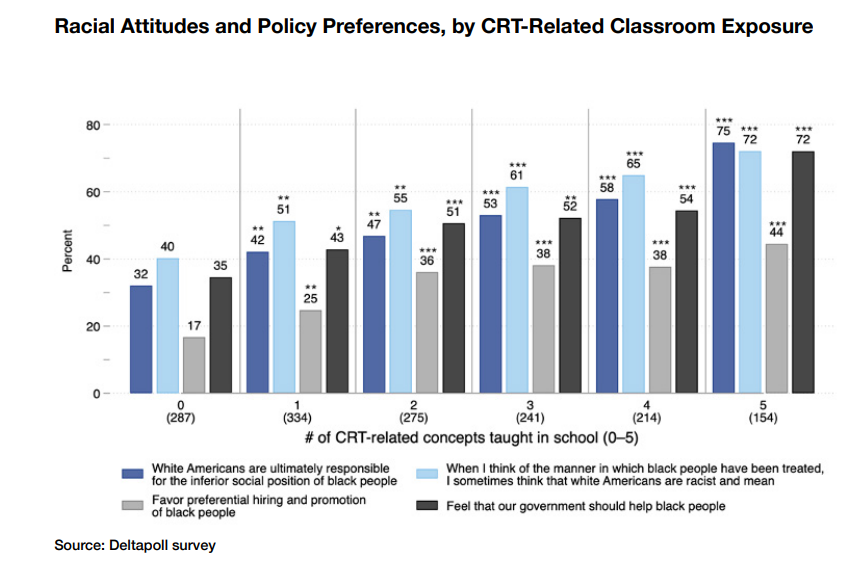
It's easy to abstract away charts showing Indian-Americans being among the strongest supporters of Critical Race Theory, believing that white supremacy is a major threat, and strongly supporting Affirmative Action. Mehta is an illustrative example of this mindset in practice.
2024 Dutch version of the famous Danish "It's Complicated" graph. First generation immigrants are net fiscal negatives at all ages - entirely because of "non-western" immigrants. But at least the Netherlands benefits from... there must be something. (new study, short thread)
This is a very familiar map. Bet you could predict almost all of this with national IQ + selection + obvious adjustment for Afrikaners.
Everyone knows "asylum seekers" are absurdly expensive. But even study migration is a net negative at all ages. Student visas often get a free pass in immigration discussions - people just assume they're fine based on half-remembered recollections from college. But they're not.
This dumb meme needs to die. The effects of immigration on population aging are very small, because immigrants age too. China would need literally billions to put a dent in population aging. There are not billions of people as productive as the avg Chinese angling to move there.
South Korea keeping dependency ratios constant would require about a hundred million immigrants... PER YEAR.
All of this, of course, assumes that the immigrants are just as capable and productive as the native population (they are not), do not engage in ethnic conflict (they usually do), and have comparably pro-growth politics to the natives (they do not).
Not surprising to those familiar with US immigrant achievement, but about 80% of 21st century Chemistry/Physics/Medicine US immigrant Nobelists are from Europe or the Anglosphere. Of the 10 Asians, 5 are Japanese and 2 are Israeli. As far as national origins: UK dominates.
Wrong as applies to newspapers and television. There's strong evidence media radicalization (Great Awokening) caused the attitude shift in white liberals, not the other way around. From "Explaining Shifts in White Racial Liberalism".
Newspapers that optimize for audience engagement look like the NYPost or the Daily Mail. Think prominent pictures of scary black criminals, rather than burying nonwhite murderer's race like most papers.
It's more correct wrt newsletters, blogs, podcasts, and social media because the barriers to entry are so much lower and there aren't rivers of public, foundation, and rich donor money to keep things running without an audience. But that's not what people are complaining about.
Thread on the difference between the history of pre- and post-tax and transfer income inequality in the US. The well-known story is the left earned one, with a U-shaped curve. The right is what it looks like after taxes and transfers - there's no increase post-1970.
So what happened? Short answer is the things described in @charlesmurray's Coming Apart. First, Great Society welfare programs disincentived work among the left half of the productivity Bell Curve - you need to be above average to make real income gains from working harder.
All of the income gains of the bottom quintile since 1970, and most of the income gains of the second quintile, have come from increased transfers (mostly paid for by the top quintile).