Interest rates are SKYROCKETING:
The 10-year note yield is nearing 4.70% with mortgage rates on their way to 8%+.
Since the "Fed pivot" began just 111 days ago, interest rates are up more than +110 basis points.
This has NEVER happened before. So, what's next?
(a thread)
The 10-year note yield is nearing 4.70% with mortgage rates on their way to 8%+.
Since the "Fed pivot" began just 111 days ago, interest rates are up more than +110 basis points.
This has NEVER happened before. So, what's next?
(a thread)
It has now been 111 days since Fed rate cuts began on September 18th.
Meanwhile, the 10-year note yield is up 110 basis points.
In almost all instances, other than 1998, interest rates FALL when the Fed cuts rates.
Yet another similarity to the Dot-com bubble is seen now.
Meanwhile, the 10-year note yield is up 110 basis points.
In almost all instances, other than 1998, interest rates FALL when the Fed cuts rates.
Yet another similarity to the Dot-com bubble is seen now.

Here's a chart showing long rates since the "Fed pivot" began compared to the average in past cycles.
Rates typically fall by ~25 basis points at this point in a Fed interest rate cut cycle.
111 days later, and we are up +110 points, or a +135 POINT divergence from the mean.
Rates typically fall by ~25 basis points at this point in a Fed interest rate cut cycle.
111 days later, and we are up +110 points, or a +135 POINT divergence from the mean.

Effectively, the market is FIGHTING the Fed at a historic pace.
For all investors, this move in long run rates cannot be ignored.
As we have said multiple times since November, we believe inflation is back on the rise.
We also believe that the US is experiencing stagflation.
For all investors, this move in long run rates cannot be ignored.
As we have said multiple times since November, we believe inflation is back on the rise.
We also believe that the US is experiencing stagflation.
Not convinced? Take a look at both Gold and the US Dollar, $DXY.
While $DXY hits its highest level since November 2022, gold prices are RISING, now up 29% since March.
Gold and the US Dollar almost never rise together on a long-term basis.
Inflation is being priced-in.
While $DXY hits its highest level since November 2022, gold prices are RISING, now up 29% since March.
Gold and the US Dollar almost never rise together on a long-term basis.
Inflation is being priced-in.

Our premium members got ahead of this trend and bought gold in 2024.
The relative strength of gold in this market is as if the market is trading in an economic crisis.
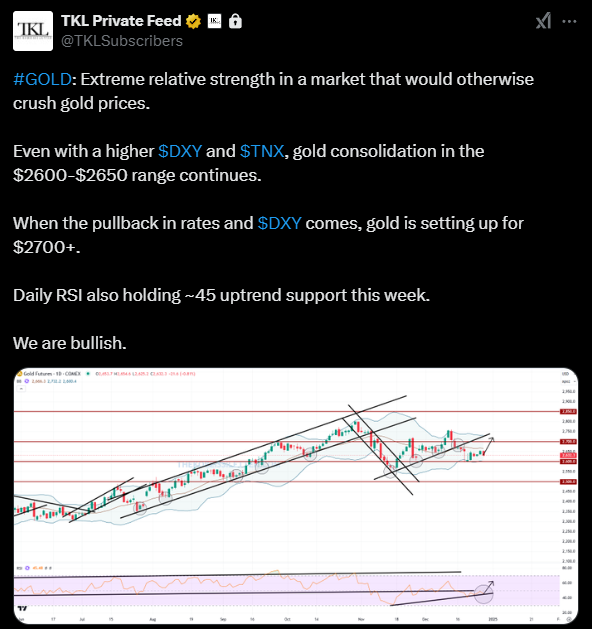
Recently, we alerted a buy at $2600 as seen below.
Subscribe to access our alerts:
thekobeissiletter.com/subscribe
The relative strength of gold in this market is as if the market is trading in an economic crisis.
Recently, we alerted a buy at $2600 as seen below.
Subscribe to access our alerts:
thekobeissiletter.com/subscribe
Meanwhile, Core CPI is back to 3.3% and headline CPI is at 2.7% and rising in the US.
All 3 major inflation metrics, CPI, PPI, and PCE, are rising.
1-month, 3-month, and 6-month annualized inflation metrics are rising even faster.
The market is not buying the "Fed pivot."
All 3 major inflation metrics, CPI, PPI, and PCE, are rising.
1-month, 3-month, and 6-month annualized inflation metrics are rising even faster.
The market is not buying the "Fed pivot."

Take a look at Germany where CPI inflation just jumped from 2.2% to 2.8% in December.
Core inflation in Germany is now back above 3.0% as well.
We expect a rebound in inflation not only in the US, but also in Europe, and bond markets are pricing this in.
Core inflation in Germany is now back above 3.0% as well.
We expect a rebound in inflation not only in the US, but also in Europe, and bond markets are pricing this in.

Even more alarming:
As the US deals with a rebound in inflation, China now has its worst wave of deflation since the 1990s.
As a result, the Chinese Yuan is now traded at its weakest level against the US Dollar since September 2023.
The fight against inflation is not over.
As the US deals with a rebound in inflation, China now has its worst wave of deflation since the 1990s.
As a result, the Chinese Yuan is now traded at its weakest level against the US Dollar since September 2023.
The fight against inflation is not over.

The different economic backdrops across different markets will result in more volatility in 2025.
Apollo estimates a 40% chance that rate HIKES return this year.
How are we trading this?
Subscribe to our premium analysis and alerts at the link below:
thekobeissiletter.com/subscribe
Apollo estimates a 40% chance that rate HIKES return this year.
How are we trading this?
Subscribe to our premium analysis and alerts at the link below:
thekobeissiletter.com/subscribe
It has now been 61 days since this clip.
Fed Chair Powell said that the rising 10-year note yield is unlikely a "material change in financial conditions that [will] last."
If inflation rises again in the upcoming CPI, PPI and PCE data, the Fed will be in a bad spot.
Fed Chair Powell said that the rising 10-year note yield is unlikely a "material change in financial conditions that [will] last."
If inflation rises again in the upcoming CPI, PPI and PCE data, the Fed will be in a bad spot.
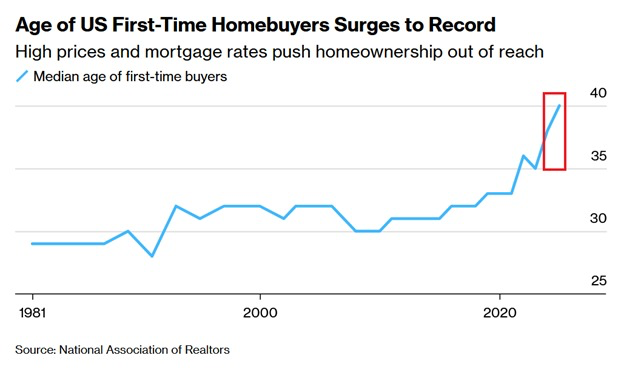
Buying a home 2021 with a 30Y mortgage meant you spent a total of $473K in principle and interest.
As rates rebound, you now spend a total of $873K.
That's $300K MORE, or 63%, in a ~4 year time difference.
Follow us @KobeissiLetter for real time analysis as this develops.
As rates rebound, you now spend a total of $873K.
That's $300K MORE, or 63%, in a ~4 year time difference.
Follow us @KobeissiLetter for real time analysis as this develops.

• • •
Missing some Tweet in this thread? You can try to
force a refresh