Both online and IRL, the question I continue to hear the most is "How much Bitcoin should I get?"
I've spent some time putting a visual guide together that has helped some people close to me set stacking targets based on when they expect to retire. I hope this can also be helpful to you or the people you care about.
- - -
How it works: 
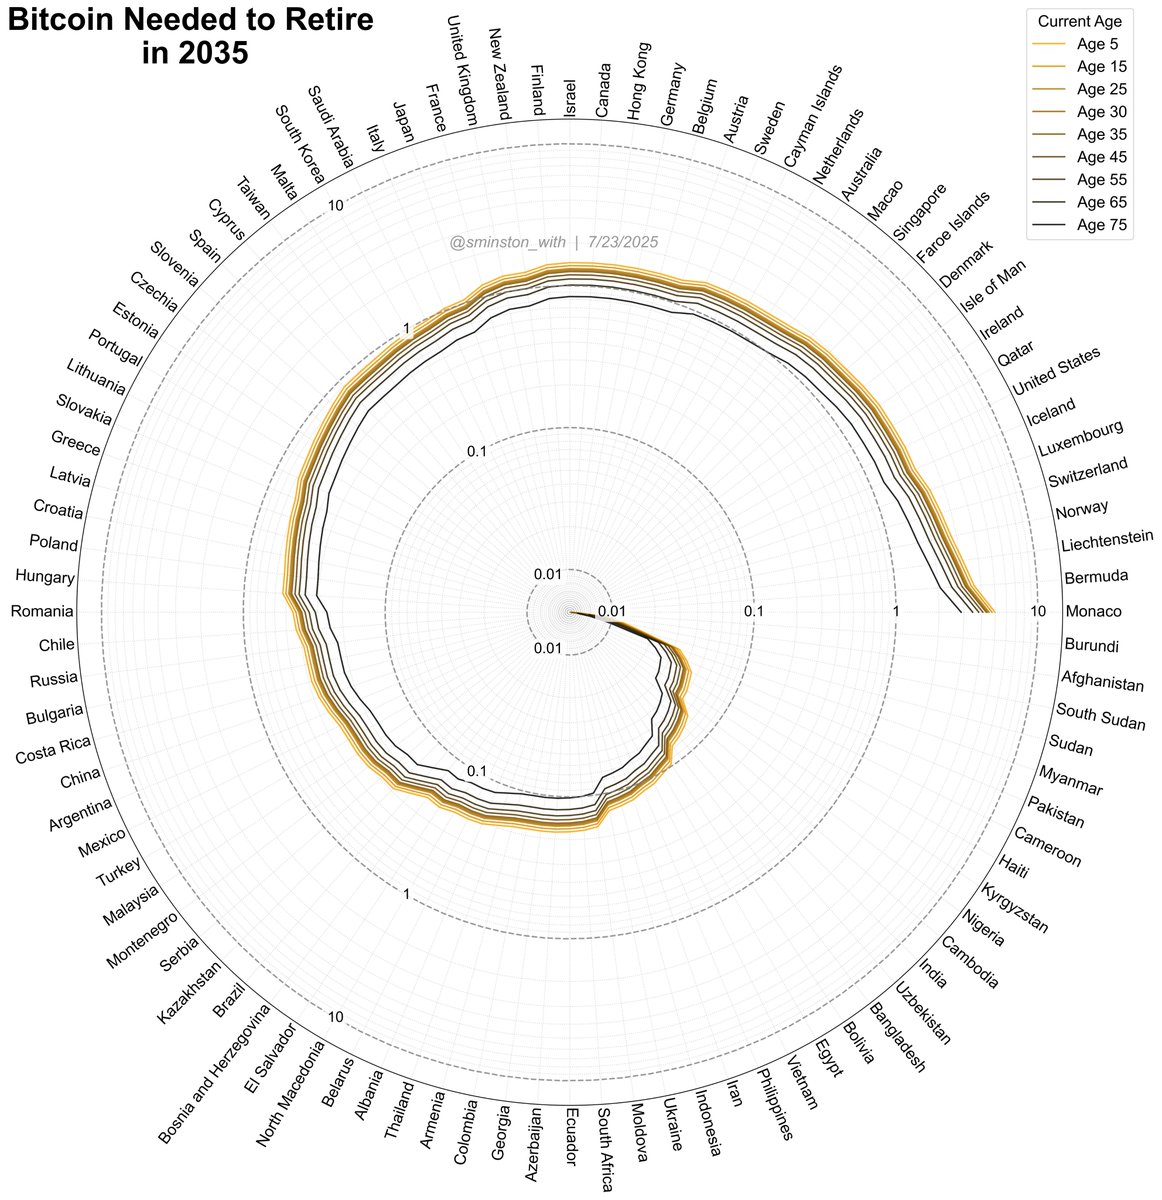
1) Decide the age at which you would hypothetically retire—the point at which you could live off it for the rest of your life if necessary (not that you'd actually want to sell it). There are groups of lines that represent retirement ages 35, 45, 55, 65 and 75 for simplicity.
2) Determine (in 2025 dollars) the annual expenses you expect to live on starting in your year of retirement (these are denoted by the different colors dark grey --> Bitcoin orange, $50,000/yr --> $300,000/yr)
3) Find your current age on the x-axis
4) Find where the line colored according to your expected annual living cost, within the Retire@ line group of your retirement age target, intersects with the line of your current age
The Bitcoin Needed Today (BTC) that corresponds with that point (see y-axis) is the minimum amount you should target.
If the several groups of lines are too difficult to navigate, look below in this thread's replies to see the isolated Retire@ cases by age (35, 45, 55, 65, 75).
Assumptions: 1) Future BTC price is projected by 50th percentile power law model. 2) Everyone dies at age 100. 3) Money supply (USD) grows at constant rate of 7%CAGR - meaning, whichever colored line you choose accounts for this 7% inflation from today to your retirement year, and beyond (ex: if you choose $100,000/year, in 2035 that would be about $196,715 - the model accounts for this). 4) The Bitcoin Needed Today amounts represent the minimum amount to prevent your BTC stack from hitting zero by age 100 - this is meant to be a minimum target, and therefore the individual should determine how much additional buffer BTC they should target. 5) Assumes a 'constant withdrawal rate in real 2025 USD terms', meaning the only increase year-year is to offset assumed 7% inflation. 6) Assumes no taxes will exist on withdrawals.
Disclaimers:
*this is NOT financial advice
**this is NOT a suggestion that you should sell your Bitcoin
Retire at 35:
Retire at 45:
Retire at 55:
Retire at 65:
Retire at 75:
• • •
Missing some Tweet in this thread? You can try to
force a refresh
I talk about Bitcoin's power law support line a lot, so...
- - -
I finally ran a test everyone (probably) wonders about:
How much does “buying the power law support” actually beat random timing in Bitcoin?
It’s not even close. Comparing the two strategies from Jan 2015 → Nov 2025 (current ~$87k BTC)... (keep reading)
🧵1/5👇
2/5
...Support strategy: (Buy $100 every single time BTC dips below the long-term power law floor):
→ 236 buys
→ Total cash invested: $23,600
→ BTC accumulated: 34.56 BTC
→ Final portfolio value today: $3,001,941
Yes, 3 mill from 23 G's.
3/5
...Random timing strategy (1,000 simulations):
→ 236 buys (same as other strategy)
→ Total cash invested ($23,600) (also same)
→ Average outcome: $1.26M
→ 3 std deviations (top ~0.15%): $1.51M
Even the luckiest bastard in this pile is not even half as well off as the support strategist.
I just watched Luke Mikic's "takedown" of the Power Law on Simply Bitcoin (last ~15 mins of the linked video here) so you don't have to.
Here is, in chronological order, the list of errors, inaccuracies, fallacies, unfounded assumptions, contradictions, and false statements in the video (20 total)
🧵👇
1. Opens the segment by saying you should never trust charts - then immediately shares a chart supporting his belief in an impending supply shortage.
2. Claims today's global wealth is $900T (it's actually around one-third of that).
3. Bizarrely compares the Power Law's projected 2040 market cap to his incorrect $900T global wealth figure, concluding that 9% "feels low."
4. Refers to Michael Saylor's "really good chart" on projected global wealth - despite having just said, "never trust charts."
5. Claims the Power Law projects Bitcoin at $5 million per coin in 2045 (the actual projection is about $11.25 million per coin).
6. Literally says "I trust Saylor's projections. I don't trust anyone's model, but I think Saylor's projections are pretty directionally correct. He's run the numbers..."
• Reality: Saylor's trusted chart he is pointing to literally shows $280T for 2045 Bitcoin market cap, where the Power Law projects a median of about $225T, or higher with assumed volatility (i.e. Saylor's chart pretty much agrees with the Power Law).
7. In the same rant, complains that (based on his incorrect assumption that the Power Law predicts $5M per coin in 2045) it would imply roughly a $100T market cap, or about 2.5% of global wealth. In reality, assuming Saylor is correct in his global wealth projection, the Power Law would predict around 5.6–6%.
8. Claims "the math just doesn't math [with the Power Law]" - when actually his math doesn't math or even agree with the chart he's showing.
9. Claims "3% adoption after 37 years would be one of the slowest tech adoptions in human history," but he (as he routinely does on X) conflates user adoption rate and wealth reallocation.
• Reality check - if talking about tech user adoption, Bitcoin is comparable to or outpacing internet adoption when controlling for age.
• Wealth reallocation: it took gold hundreds or thousands of years to approach 5% or more of global wealth, yet Bitcoin is on track to do so in roughly 36 years (not to mention gold took 150+ years to demonetize silver, while Bitcoin is likely achieving that within ~50 years).
10. Complains that the Power Law says in 20 years fiat money will be "5x the market cap of Bitcoin," when it actually predicts about 2x - as does Saylor's "highly trusted chart" he's referring to.
Rather than track the data, Luke suggests you should believe this trend will reverse course - rather than trending from mid-40%CAGR to mid-20% CAGR over the next 10-20 years, he tells you it will go toward 60%, 90%, or higher. Sound like good "planning?" Would you plan your loved one's retirement that way?
For good planning, I suggest start with accepting reality. Thinking something 'isn't bullish enough' isn't good enough.
Diminishing returns can be analogized with inflating a balloon.
When you are taking your first few breaths to inflate the balloon, the corresponding volume of the balloon increases substantially. But after those first few, you quickly start to realize that, to double the size of that balloon again (say to go from the size of a baseball to the size of a volleyball), it takes a lot more air and more breaths (maybe 30 breaths instead of 3 breaths).
Similarly, a much larger amount of capital inflows is required to push the market cap of Bitcoin up from 2 trillion to 20 trillion than it did from 100 million to 1 billion.
So when Luke talks about all the additional money in the system which has yet to flow into Bitcoin, realize there is a time dependence to this, and remember the balloon effect. Luke also provides no analytical method to show a short-term meteoric price surge.
🟠 How much Bitcoin does the average person need to retire?
Here, its calculated and presented in radial charts 🍥
for 96 countries, ages 5 - 75, retiring in 2025 - 2055.
- - -
Based on each country’s average income level, adjusted for inflation (7% M2 expansion), and of course utilizing the highly reliable power law support line (5th percentile) as the BTC price model - check out the numbers based on your current age.
Assumes: spending the actual Bitcoin for annual living expenses, and expecting to live to age 100.
Highlights:
🍥MOST people in MOST countries still need less than 1 BTC for 2035 and out.
🍥If retiring this year, most countries need between 1-10 BTC.
🍥To retire in 2045 in BITCOIN-FRIENDLY countries:
• El Salvador: 0.023 - 0.13 BTC
• Switzerland: 0.26 - 1.5 BTC
• Portugal: 0.07 - 0.39 BTC
Many have asked, and so here it is: FULL re-post of Smitty's Bitcoin Retirement Guide 📙
- - -
Paginated, 600 DPI, $50k - $1M USD annual expense scenarios, assumed future 7% average annual inflation, and does not account for taxes.
- - -
BOOKMARK this so you can always refer back to it!
Been feeling like we're on the longest Bitcoin crab crawl ever?
Not only would you be right - but there is something else unique about the current "crab market" as I call it.
It is the first of all the crab markets to have a steeper slope than the previous one.
Keep reading 👇
I fitted each crab market using an exponential function, which gives us the growth rate of each (the is the "Crab Crawl Slope" in the inset plot.
When you plot each of the slopes, they actually behave as a power law on their own (R2 > 99.5). This means that the slope of the CURRENT CRAB WALK we are in should have a slope LESS STEEP than the one from 2019-2020...
Yet, it is STEEPER. Here are the values:
2019-2020 Crab walk slope = 0.001566
Current Crab walk slope = 0.001769
EXPECTED Current Crab walk slope = 0.001227
The red dashed line and red dot in the plots represent the expected price trajectory and crab market slope for this current crab market; compare that to the most recent orange data.