
Speaking at BTC Prague 2026: https://t.co/BvlHmdfgwY
Bitcoin
⚡️
Engineering PhD
⚡️
Analysis, tools, and guides
 2/5
2/5
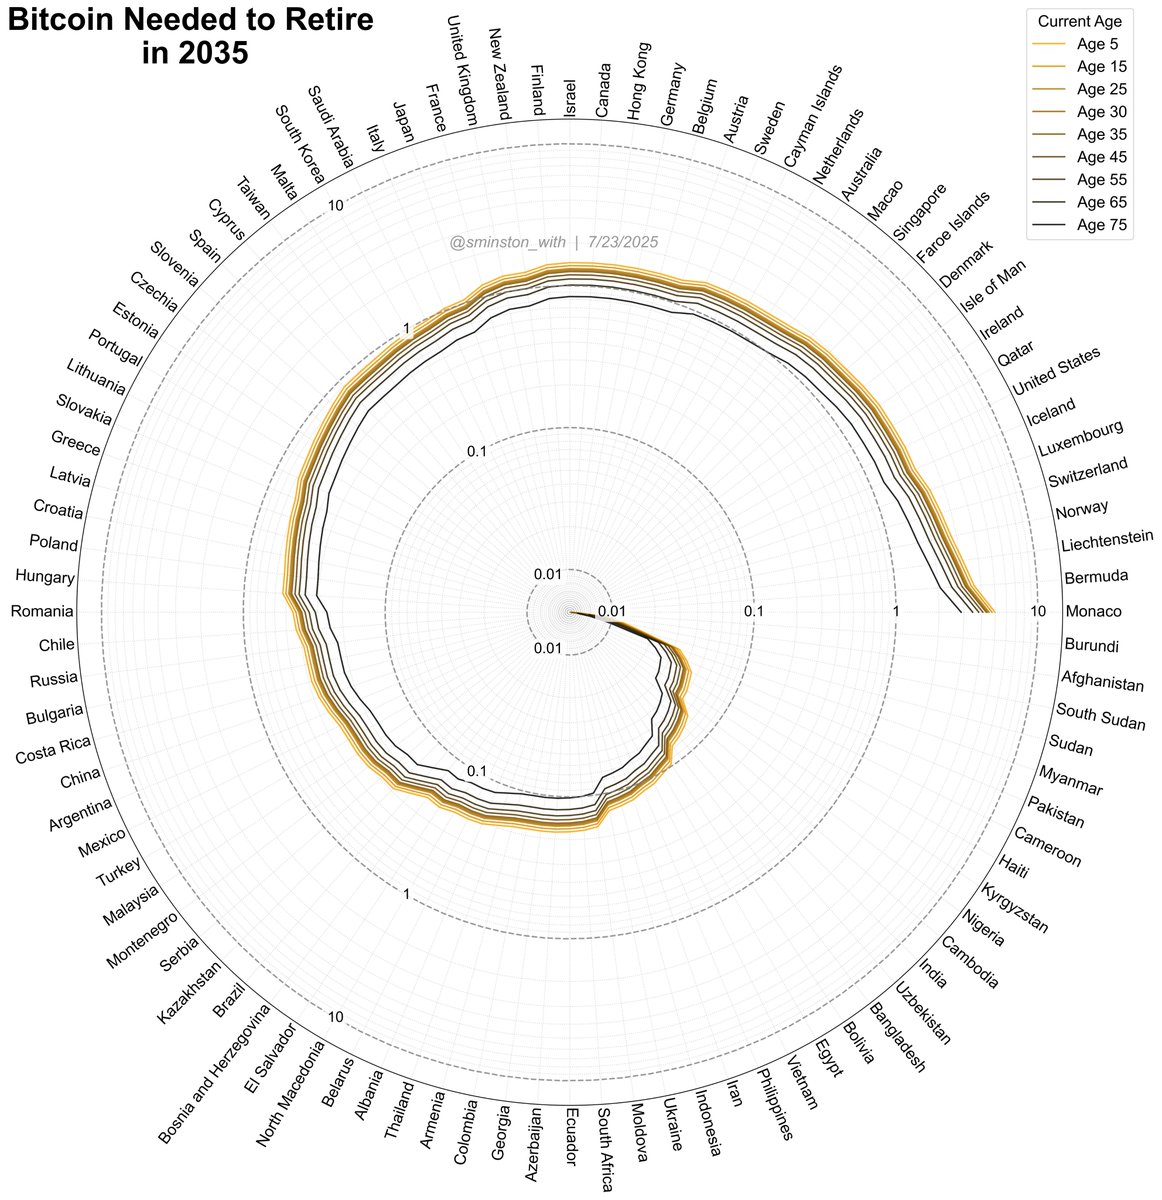 2025 Retirement:
 P.1 $50k / year
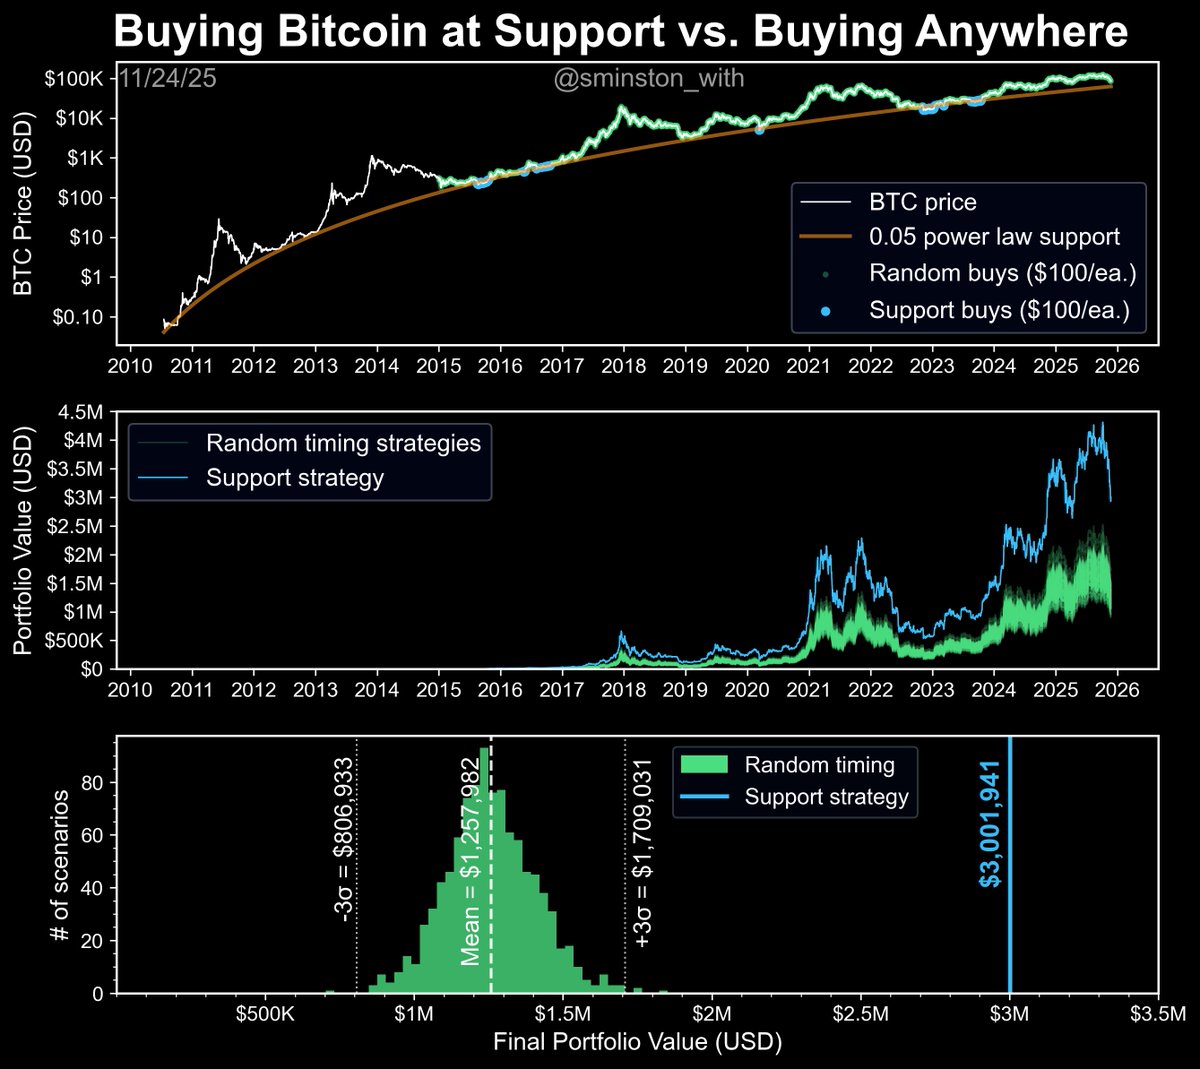
 I fitted each crab market using an exponential function, which gives us the growth rate of each (the is the "Crab Crawl Slope" in the inset plot.
 P.1 - $50k/year
 $100,000/ year:
 Retire at 35:
 2/ Things you’ll notice from The Decay Channel:
