This week $SPY dropped over $20 bucks in 4 days 📉
That's an average drop of $5 a day 😬
Here are some tips & tricks for trading downtrends! 🧵
That's an average drop of $5 a day 😬
Here are some tips & tricks for trading downtrends! 🧵

Pullbacks in the market are normal & healthy... But not every red day is a "buy the dip" opportunity!
Many day traders struggle to trade these downside moves, and many swing traders will buy the dip way too early.
There was a time when I would have got killed on a week like last! But these simple tips & tricks have helped me turn that into weeks like this 👇
Many day traders struggle to trade these downside moves, and many swing traders will buy the dip way too early.
There was a time when I would have got killed on a week like last! But these simple tips & tricks have helped me turn that into weeks like this 👇

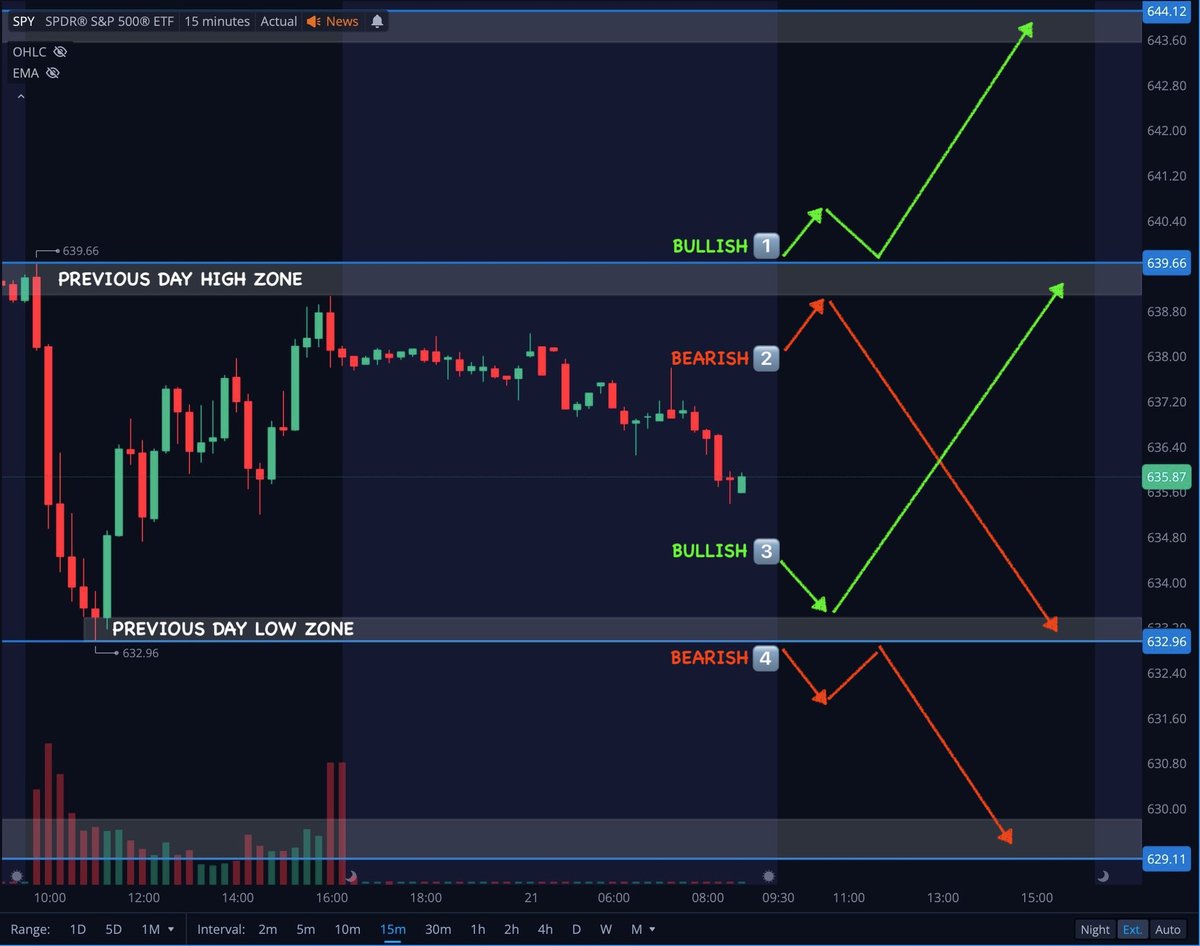
Rule #1 📝
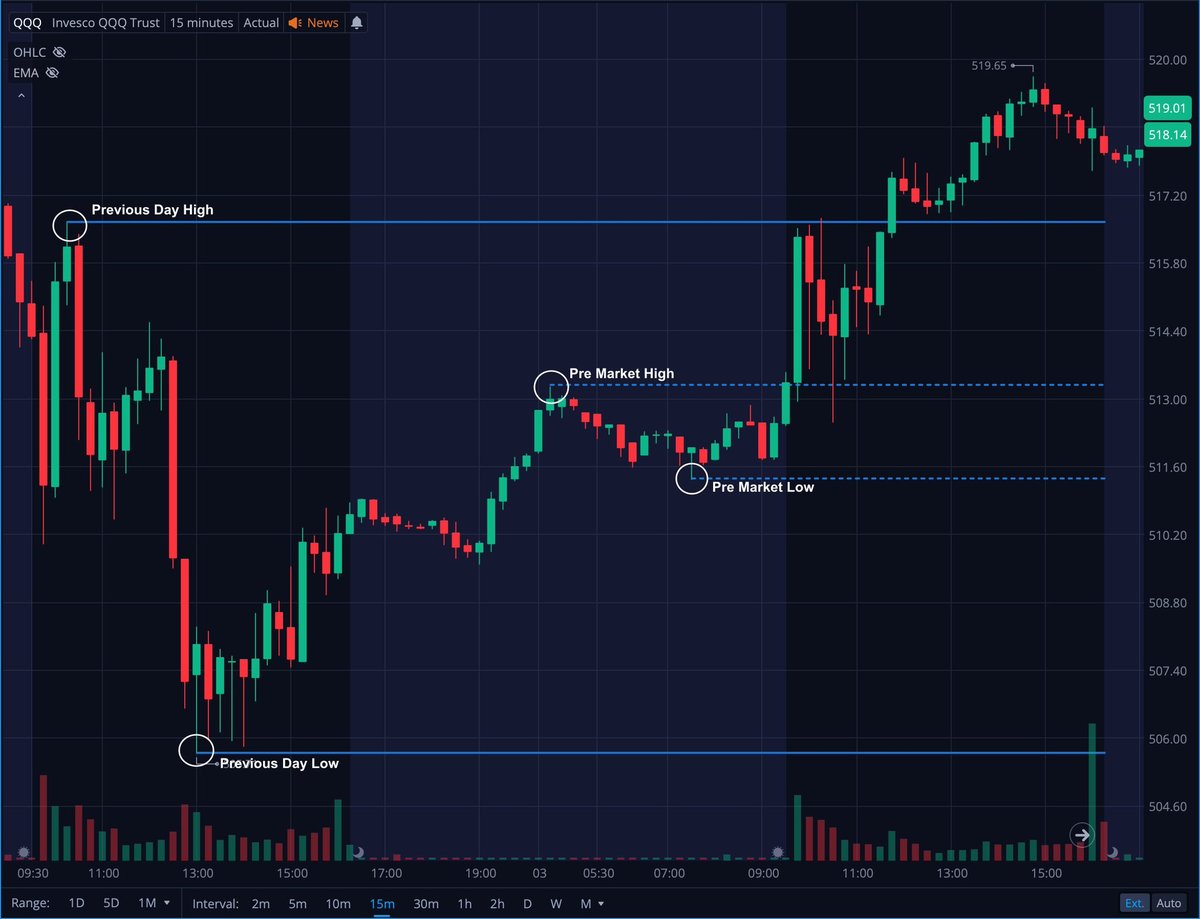
If we break under the Previous Day Low the current downtrend is resuming!
Avoid buying the dip here! I wait for the confirmation of a higher high first.
Break Previous Day Low = Lower Low = Downtrend.
Break Previous Day High = Higher High = Reversal.
Every day this week $SPY broke the PDL and continued to fade lower. Clear downtrend ⬇️
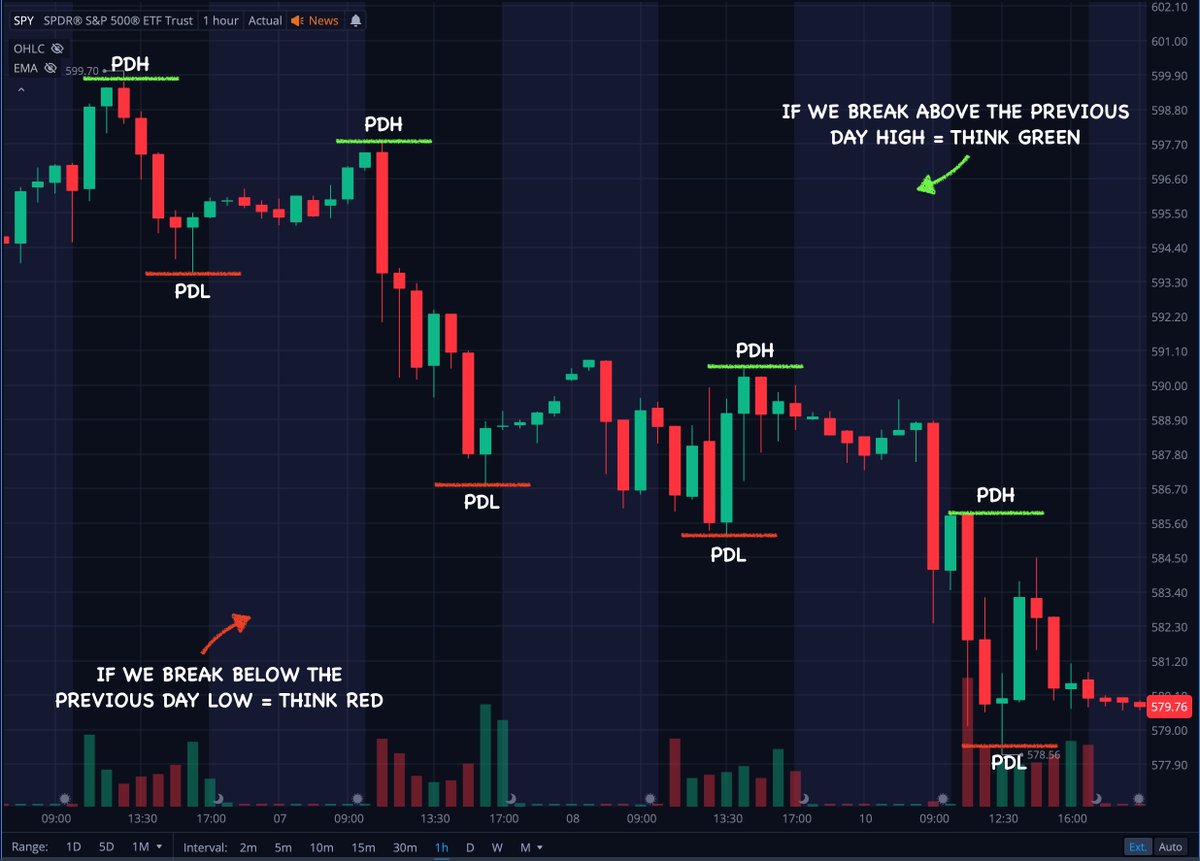
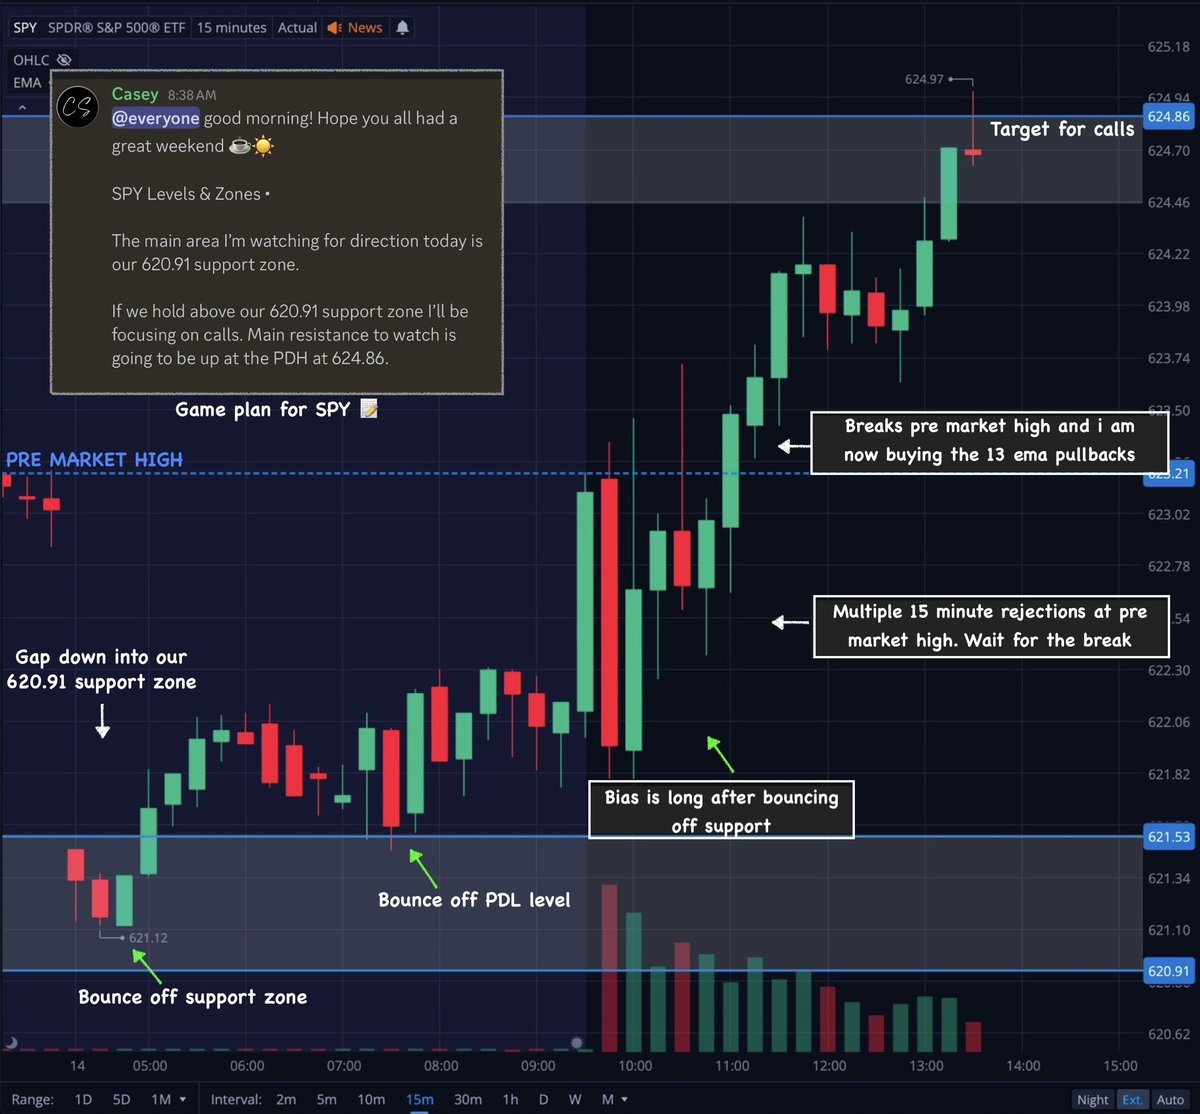
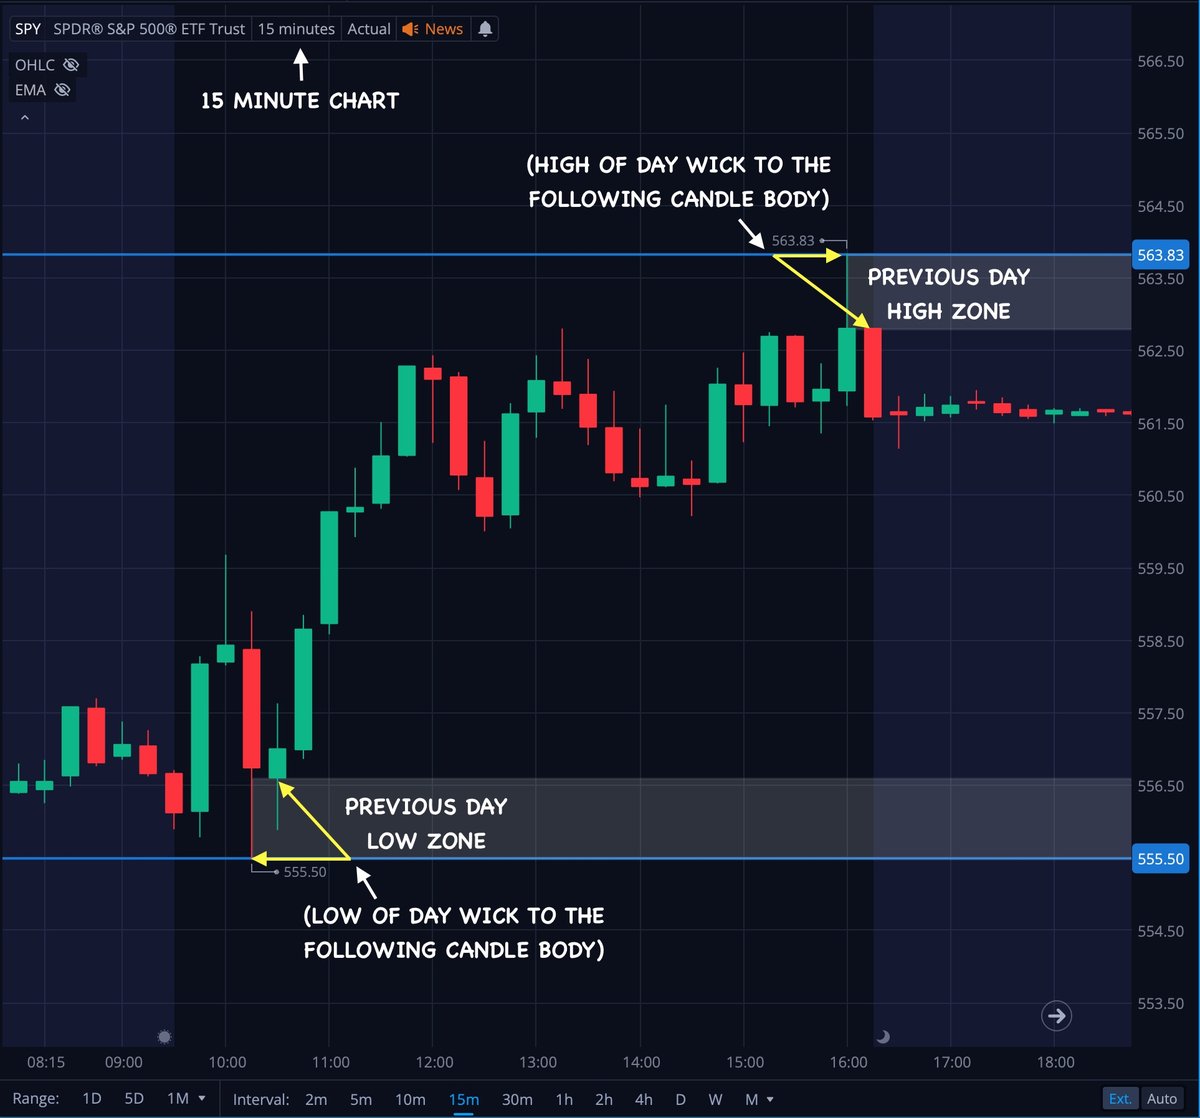
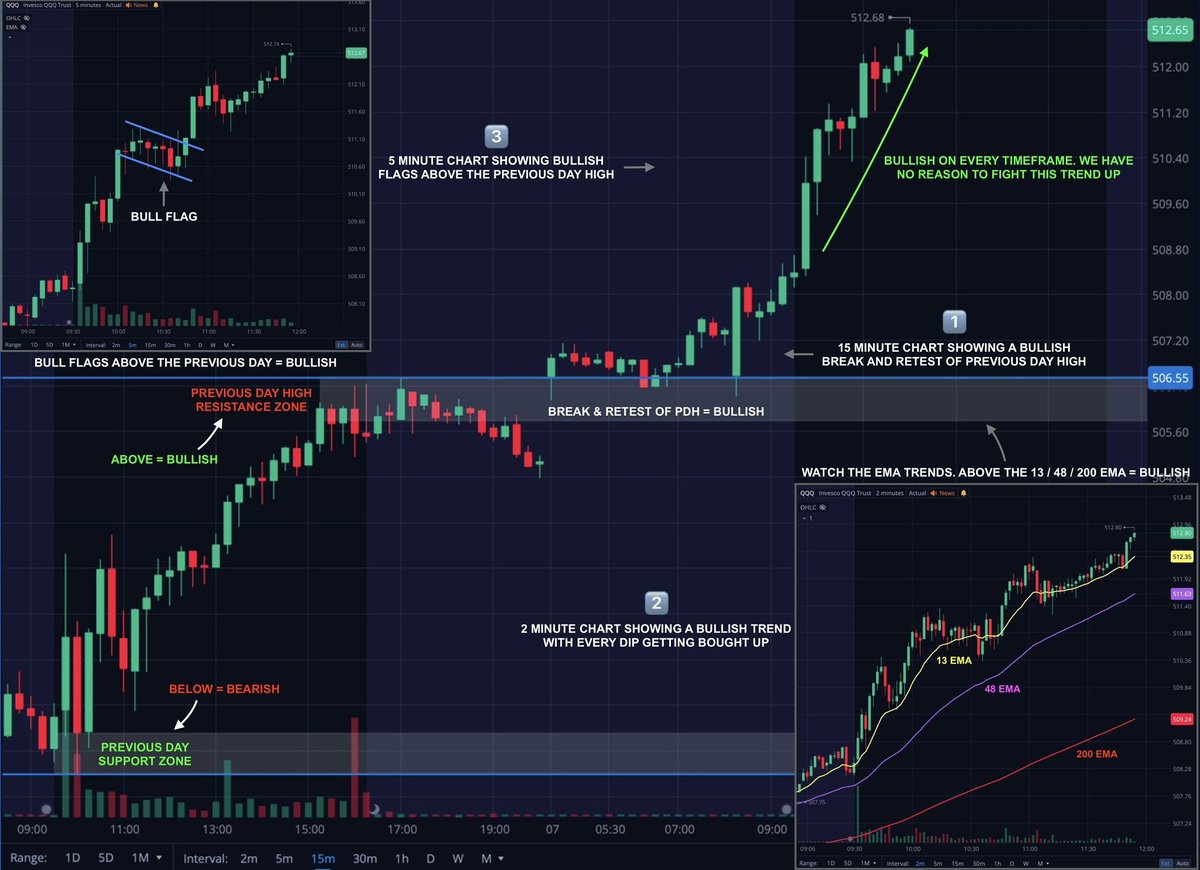
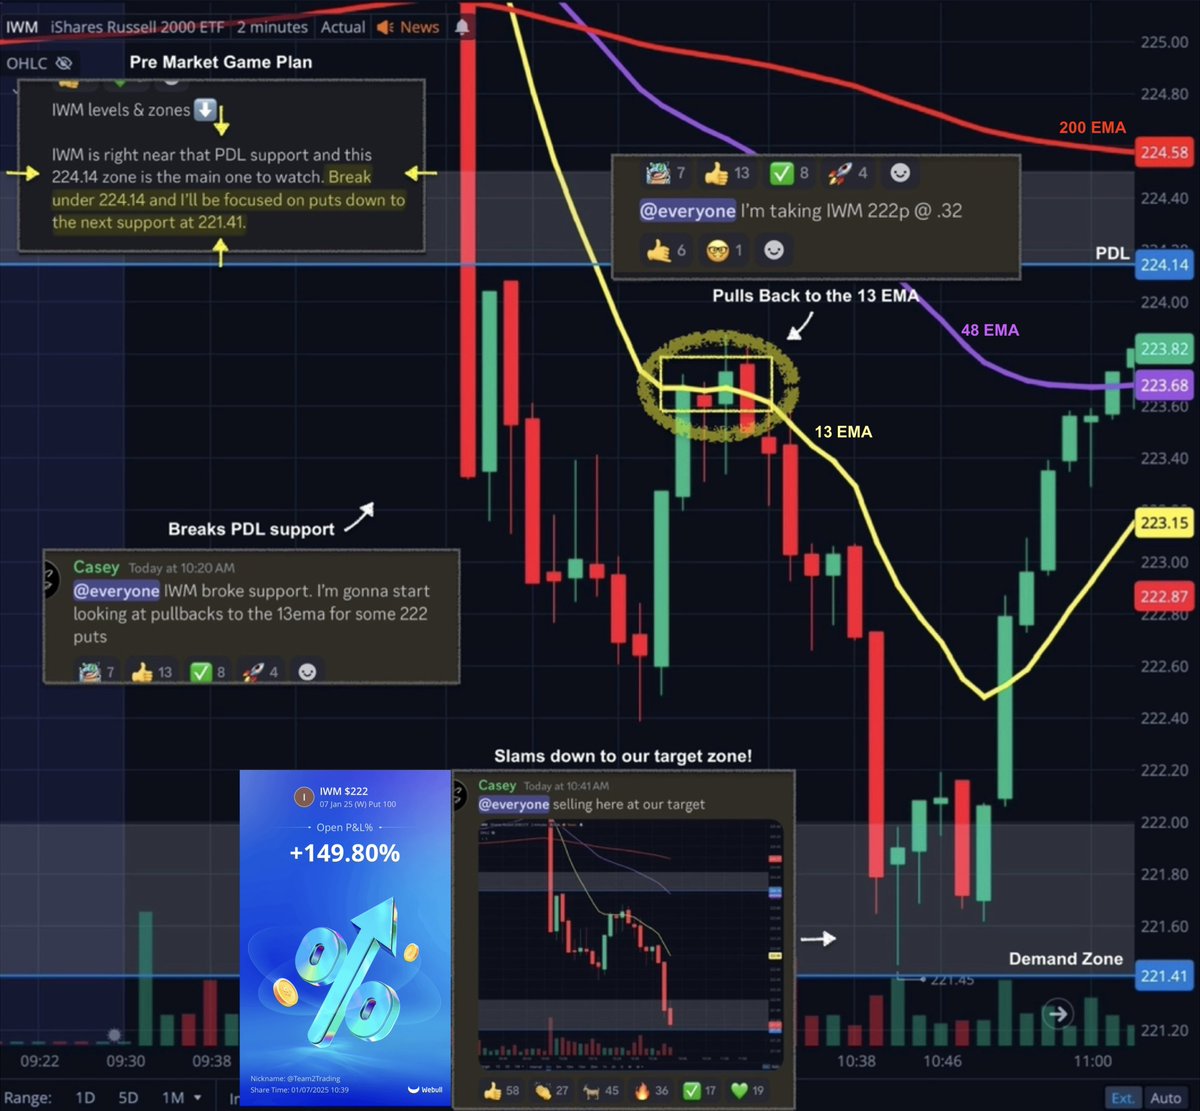
Not only is that Previous Day Low a great way to gauge direction... It is also a strong support / resistance level to trade around!
Here's an example of that last week ⬇️
Here's an example of that last week ⬇️
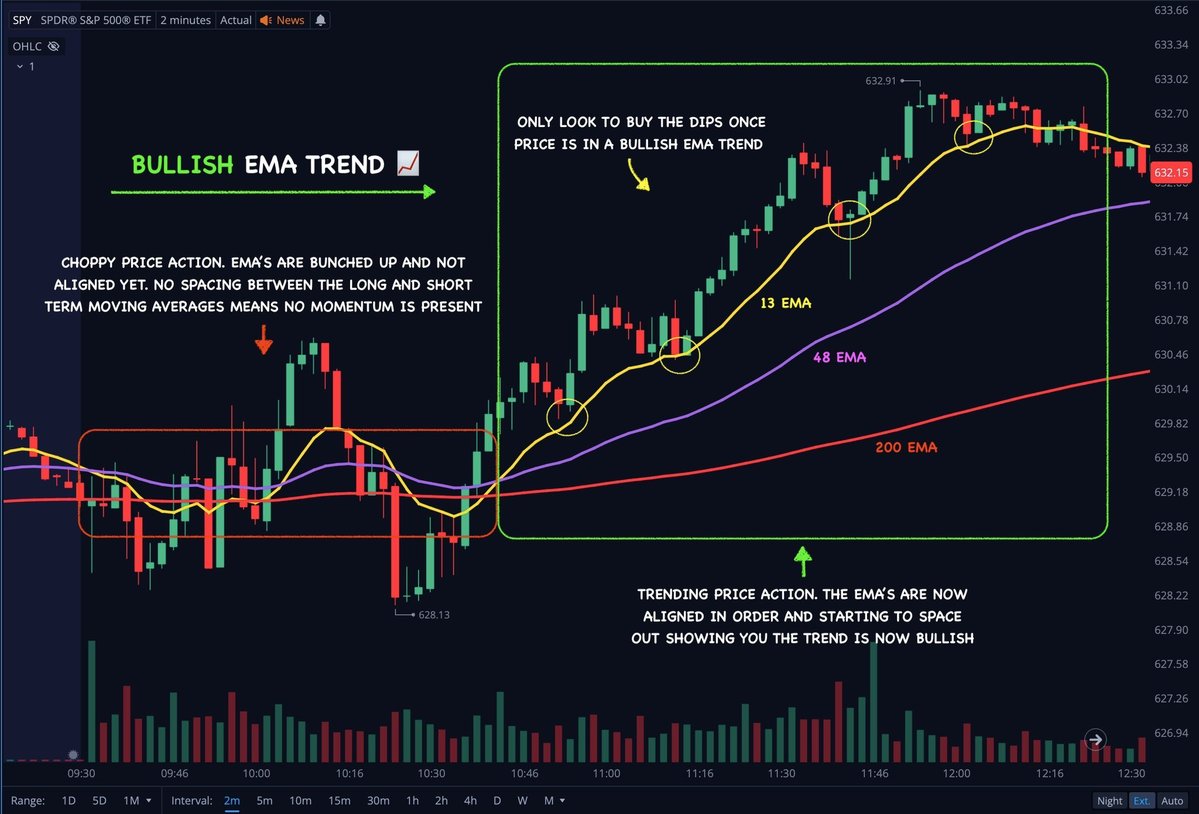
Rule #2 📝
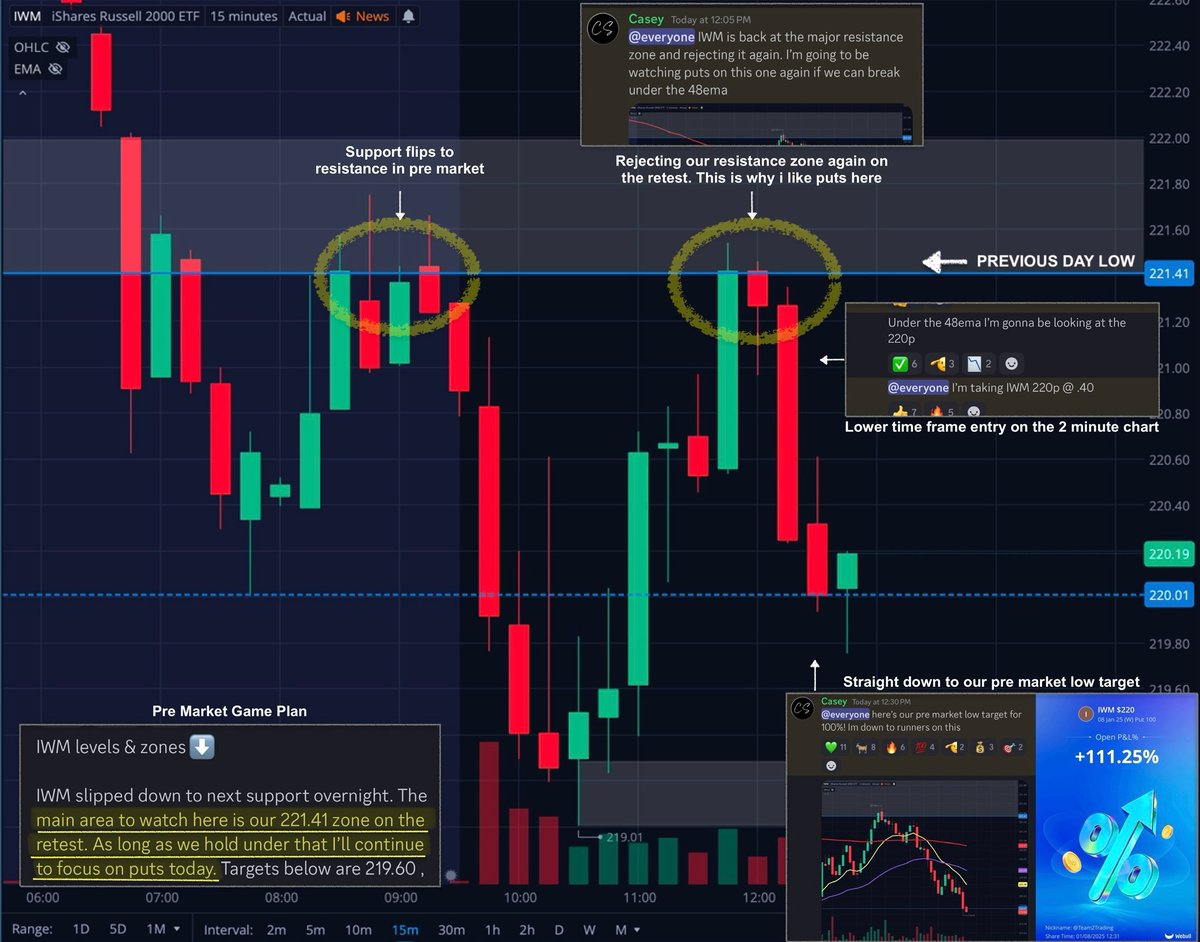
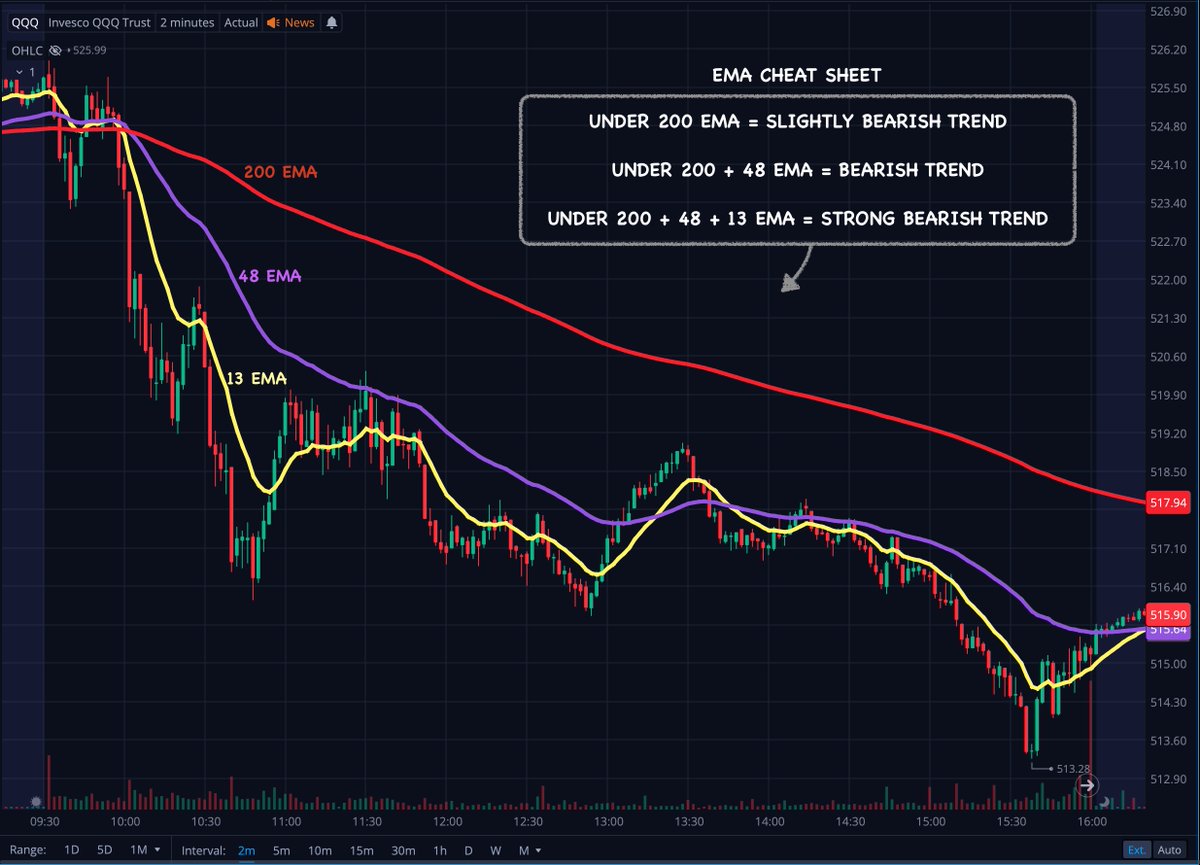
Don't fade the EMA trends! Trading with them rather than against them makes life a lot easier.
Here's my simple cheat sheet for EMA trends ⬇️
Don't fade the EMA trends! Trading with them rather than against them makes life a lot easier.
Here's my simple cheat sheet for EMA trends ⬇️
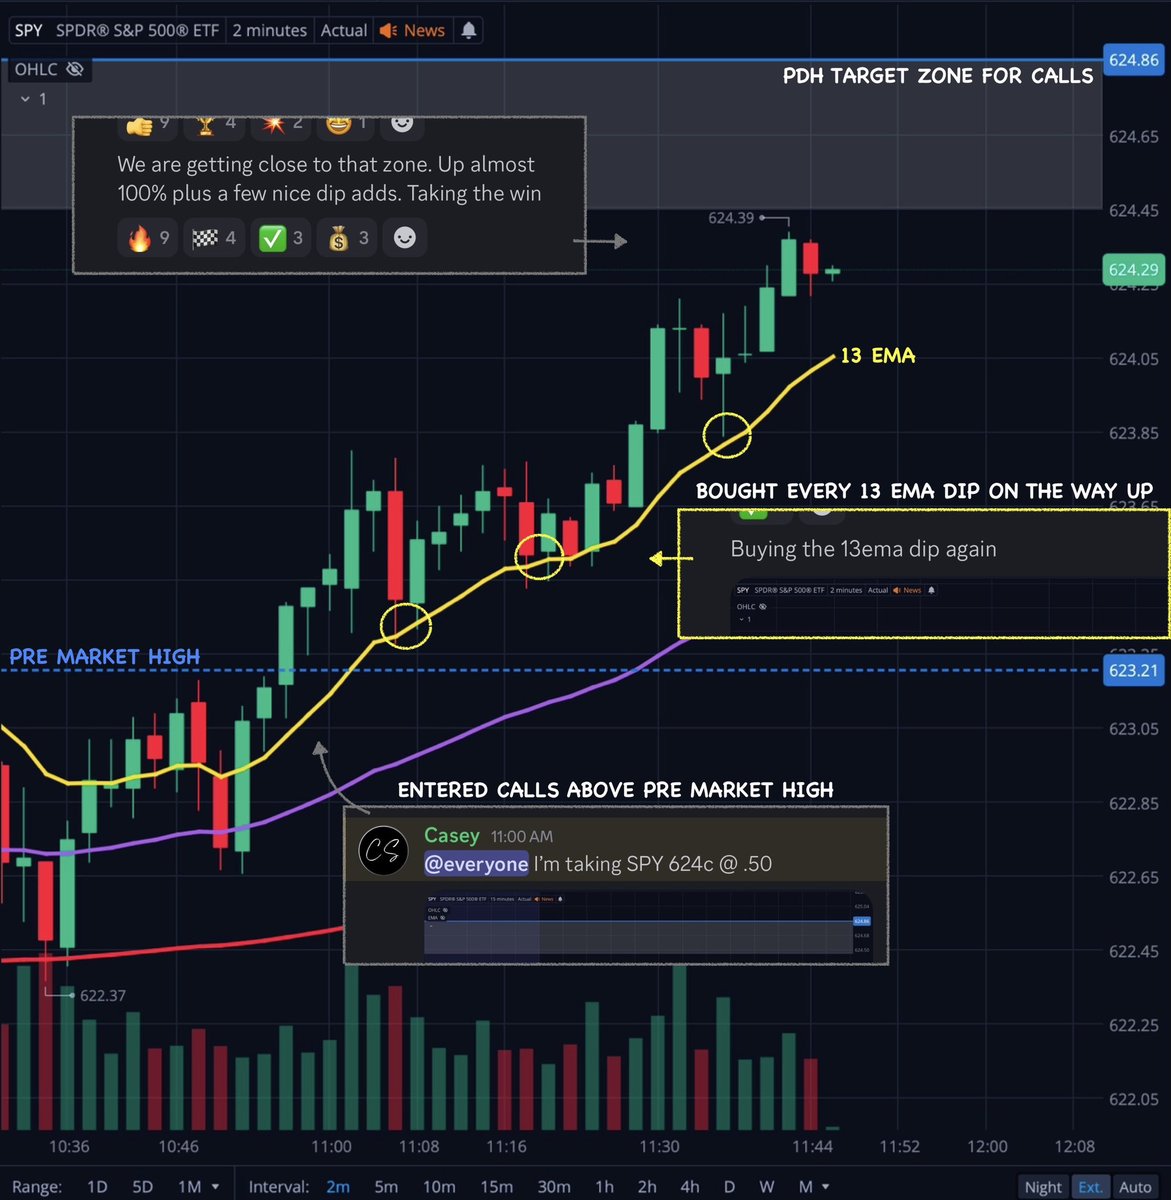
Not only do these EMA trends clearly show you the momentum / direction... I also use them for pullback entries into these downtrends!
Here's an example of that from last week ⬇️
Here's an example of that from last week ⬇️
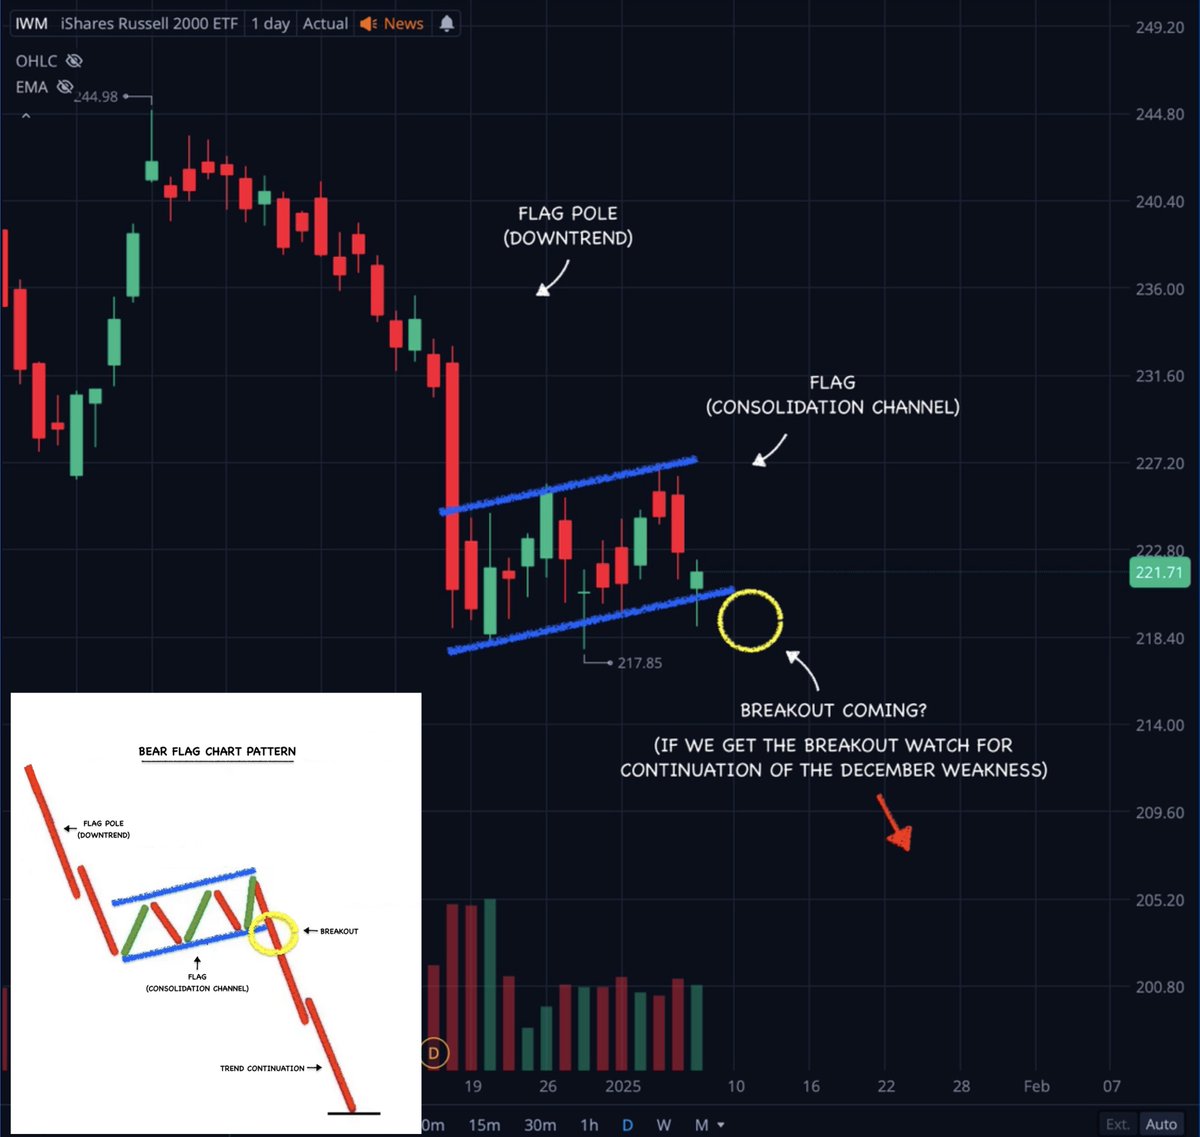
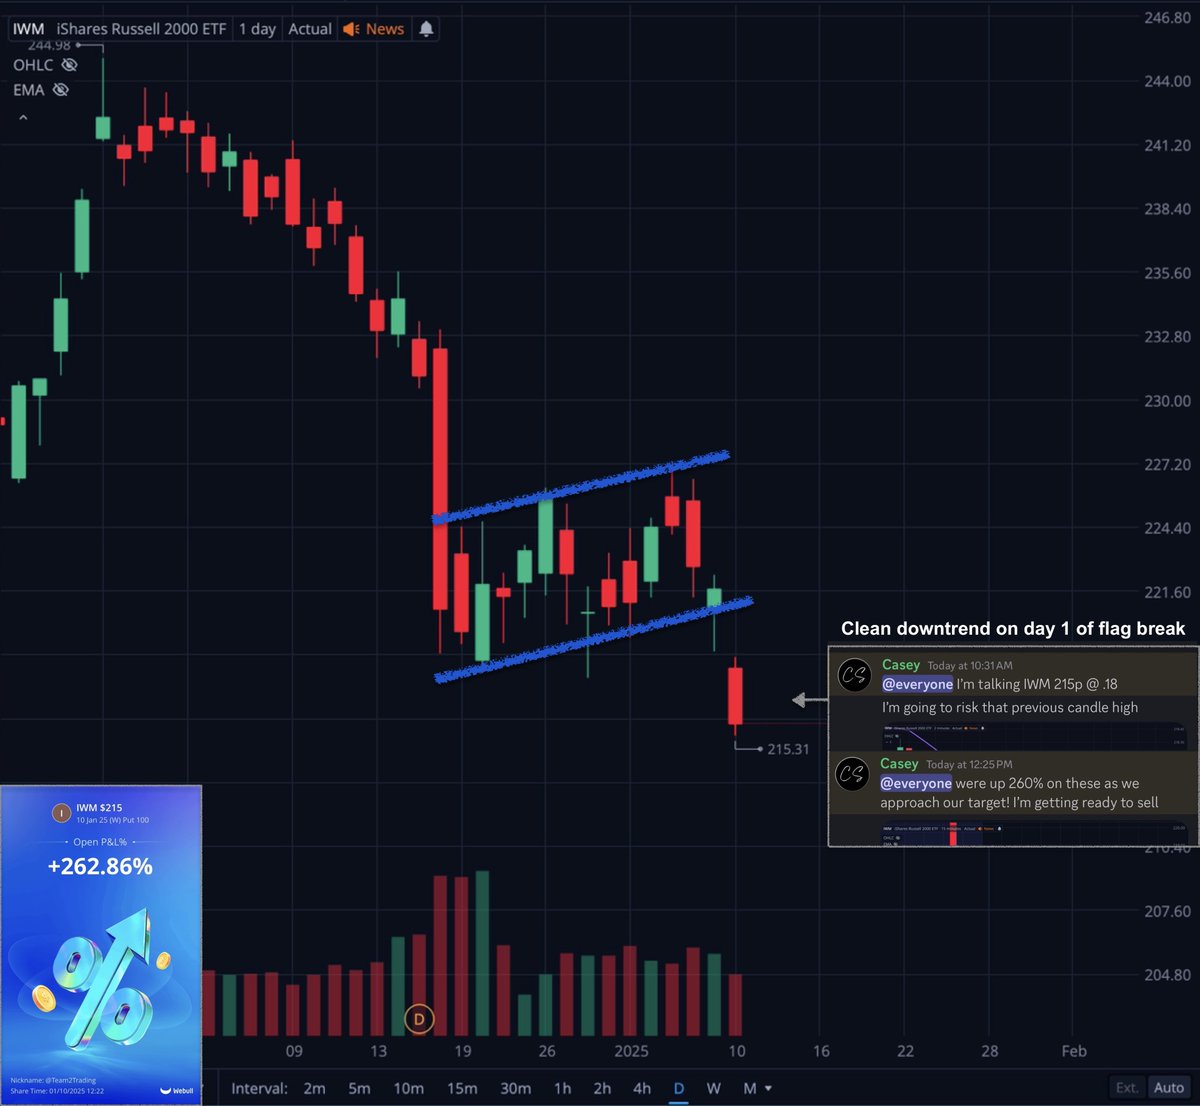
Rule #3 📝
Trade the Bear Flags 🚩
Rarely will a bullish reversals start with a bear flag.
There are plenty of nice reversal patterns... Bear flags are not one of them. Keep an eye out for them on pullbacks if we are in a current downtrend! ⬇️
Trade the Bear Flags 🚩
Rarely will a bullish reversals start with a bear flag.
There are plenty of nice reversal patterns... Bear flags are not one of them. Keep an eye out for them on pullbacks if we are in a current downtrend! ⬇️
Bullet Point check list 🔽
~ Below Previous Day Low ✅
~ Bearish EMA trends ✅
~ Bear Flags ✅
These are 3 simple and effective ways to identify and trade these downtrends! 🤙
~ Below Previous Day Low ✅
~ Bearish EMA trends ✅
~ Bear Flags ✅
These are 3 simple and effective ways to identify and trade these downtrends! 🤙
• • •
Missing some Tweet in this thread? You can try to
force a refresh