Mike Hoerger, PhD MSCR MBA Profile picture
Jan 16 1 tweets 1 min read Read on X
How are the top science programs handling high COVID-19 transmission, inclusivity, equity, and diversity in January 2025?

🔥Sick policies
🔥Virtual options
🔥High-quality masks supplied/required
🔥ASHRAE-level air cleaning

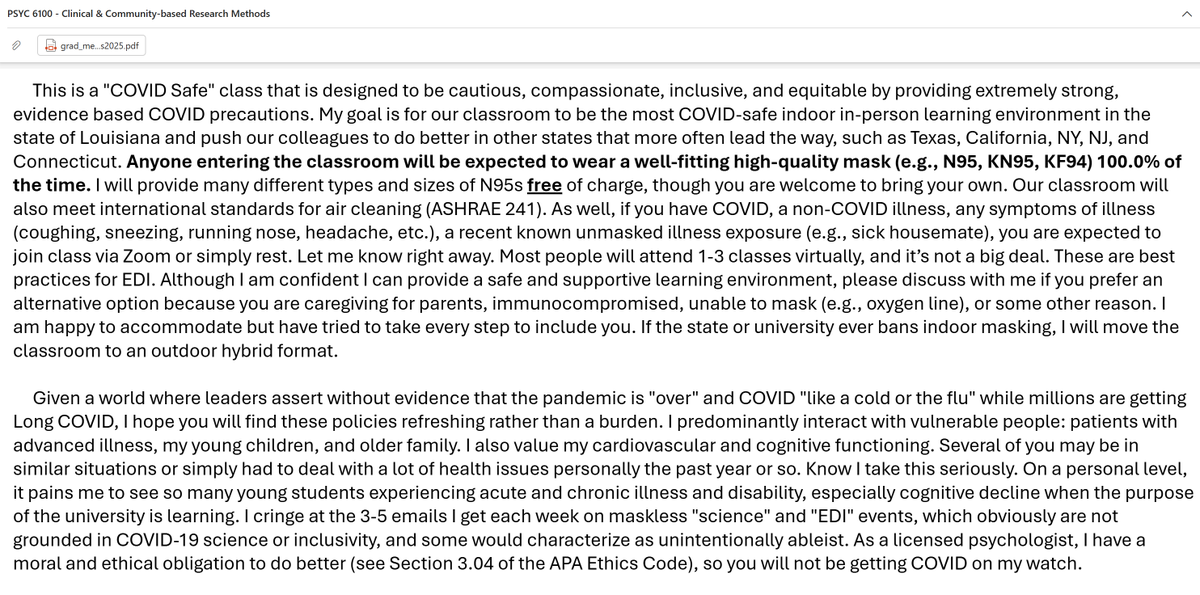
This is an excerpt of my welcome email to students:This is a "COVID Safe" class that is designed to be cautious, compassionate, inclusive, and equitable by providing extremely strong, evidence based COVID precautions. My goal is for our classroom to be the most COVID-safe indoor in-person learning environment in the state of Louisiana and push our colleagues to do better in other states that more often lead the way, such as Texas, California, NY, NJ, and Connecticut. Anyone entering the classroom will be expected to wear a well-fitting high-quality mask (e.g., N95, KN95, KF94) 100.0% of the time. I will provide many different type...

• • •

Missing some Tweet in this thread? You can try to force a refresh
 

Keep Current with Mike Hoerger, PhD MSCR MBA

Mike Hoerger, PhD MSCR MBA Profile picture

Stay in touch and get notified when new unrolls are available from this author!

Read all threads

This Thread may be Removed Anytime!

PDF

Twitter may remove this content at anytime! Save it as PDF for later use!

Try unrolling a thread yourself!

how to unroll video
  1. Follow @ThreadReaderApp to mention us!

  2. From a Twitter thread mention us with a keyword "unroll"
@threadreaderapp unroll

Practice here first or read more on our help page!

More from @michael_hoerger

Nov 8
PMC COVID Update, Week of Nov 10, 2025 (U.S.)
1/6🧵

🔹301,000 new daily infections based on wastewater-derived models
🔹1 in 162 people (0.6%) actively infectious
🔹Levels the past 2 months corrected upward by Biobot
🔹"Lull point" estimated between Nov 5-21. Rising soon. Year over year graph, emphasizing that levels commonly rise in mid November
PMC COVID Update, Week of Nov 10, 2025 (U.S.)
2/6🧵

The central estimate of the forecast suggests we will surpass 500,000 new daily infections on Nov 22.

There's a 25% chance of a prolonged lull like last year. More likely, we are in wave territory by the end of the month. Close up of the most recent 3 months of data, including the forecast.
PMC COVID Update, Week of Nov 10, 2025 (U.S.)
3/6🧵

We are presently in a lull between the 11th and 12th wave. Now is the time to get boosted and stock up on N95 masks, tests, and air purifier filters.

Do a DIY fit test if you've been putting it off. Graph of the 11 waves
Read 6 tweets
Nov 3
PMC COVlD Update, Nov 3, 2025 (U.S.)
1 of 9 🧵

The relative "lull" in SARS-CoV-2 transmission is unlikely to go much lower.

✨1 in 209 people are estimated actively infectious, likely the lowest levels of 2025 nationwide.

Get boosted. Stock up on masks, tests, & filters. Year-over-year graph
PMC COVlD Update, Nov 3, 2025 (U.S.)
2 of 9 🧵

No data presently suggest the rise of a winter wave any earlier than "usual."

If following historical trends, transmission will pick up Nov 15-29. Last year's rise was atypically late. Forecasted transmission
PMC COVlD Update, Nov 3, 2025 (U.S.)
3 of 9 🧵

Expect rising misinformation/disinformation as transmission heats up:
🔹Abuse of community notes, particularly surrounding wastewater methodology
🔹Paid bot army attacks, especially about boosters & masks
Read 9 tweets
Oct 28
PMC COVlD Update, Oct 27, 2025 (US)

Transmission typically accelerates in mid-November.

We are currently in a relative 'lull.' We estimate about a quarter-million new daily infections with 1 in 185 people actively infectious. Still bad, likely to get worse.

1/9 🧵 year over year graph
PMC COVlD Update, Oct 27, 2025 (US)

Our forecast through November 8 calls for flat transmission.

Nothing yet indicates the onset of a winter wave, but it would also be atypical for the lull to last much longer than another 2-3 weeks.

2/9 🧵 Graph of recent transmission and current forecast
PMC COVlD Update, Oct 27, 2025 (US)

We estimate 264,000 new daily infections during this 'lull' period.

Biobot data have returned. Our substitute data from WWS last week correlated r=.97 (near perfect) with that, but Biobot did retroactively increase recent estimates.

3/9 🧵 Graph of the 11 waves of the pandemic
Read 9 tweets
Oct 21
PMC COVlD Update, Oct 20, 2025 (U.S.)

SARS-CoV-2 transmission has fallen.
🔹1 in 191 (0.5%) actively infectious
🔹"Lull" levels at 20% of the summer peak
🔹255,000 new daily infections (still concerning)

Many will knock out higher-risk activities the next 2-4 weeks.
🧵1/11 Graph of the 11 waves, shows current lull.
PMC COVlD Update, Oct 20, 2025 (U.S.)

"Lull" transmission remains dangerous:
🔹1.8 million estimated new weekly infections
🔹>90,000 estimated new #LongCOVID conditions from this week's infections
🔹>500 excess deaths to result from this week's infections

🧵2/11 Infections						 Proportion Actively Infectious										1 in 191 (0.5%) New Daily Infections										 255,000  Infections the Past Week										 1,800,000  Infections in 2025										 191,000,000  Cumulative Infections per Person										 4.69  										 Long COVID										 Long COVID Cases Resulting								13,000 to 51,000		   from New Daily Infections										 Long COVID Cases Resulting								90,000 to 360,000		   from New Weekly Infections										 										 Excess Deaths										 Excess Deaths Resulting 									70 to 120	   from New Daily Infections										 Excess Deaths ...
PMC COVlD Update, Oct 20, 2025 (U.S.)

Exposure risk during "lull" transmission remains high when engaging in many social interactions.

Interacting with 25 people yields a 12% chance of exposure. 100 people? 41% chance of exposure, assuming no testing/isolation.

🧵3/11 Number of People		Chances Anyone is Infectious		 1				0.5% 2				1.0% 3				1.6% 4				2.1% 5				2.6% 10				5.1% 15				7.6% 20				10.0% 25				12.3% 30				14.5% 50				23.1% 75				32.5% 100				40.8% 200				64.9% 300				79.2%
Read 11 tweets
Oct 11
PMC COVlD Wave Update (Europe)
11 October 2025 🧵

The PMC website includes an international directory of websites with COVlD wastewater monitoring. It is more up to date than the directories of the EU and WHO.

Let's review what's happening in Europe...

1/ world map, nations with surveillance shown in blue. URL says pmc19.com/global
Data in #Austria show a rising COVlD wave. The x axis (bottom) has infrequent labels, but the data shown go through October 8th.

Find more here:

2/ pmc19.com/austrialongitudinal graph
COVlD levels have been percolating in #Belgium, with "moderate" levels overall.

The transmission pattern is similar across regions. Plants at Namur-Brumagne and Oostende report "high" levels.


3/ pmc19.com/belgiumheat map and longitudinal graph
Read 20 tweets
Oct 5
PMC COVlD Update, Week of Oct 6, 2025 (U.S.)
🧵1/9

An estimated 1 in 81 people are actively infectious during the ongoing 11th wave.

The "shutdown" has created a blackout at the state level.

Transmission is half that of the peak one month ago, and we anticipate a relative national "lull" in early-to-mid November, albeit still at dangerous levels.

Our model uses a combination of CDC and Biobot data, so we are able to estimate national statistics despite the CDC data going offline. On the map, note that Puerto Rico continues to update; they use a CDC-style system but were dropped by the CDC long ago. For full methodology, review the technical appendix on the website.Heat map, grayed out. 1 in 81 estimated actively infectious, or 602,000 new daily infections, per wastewater-derived estimates.
PMC COVlD Update, Week of Oct 6, 2025 (U.S.)
🧵2/9

#DuringCOVID is today. We estimate >600,000 new daily infections. This is about half the peak on September 6.

Notice current levels are similar to the estimated peaks of the first 3 waves. 11 wave graph
PMC COVlD Update, Week of Oct 6, 2025 (U.S.)
🧵3/9

Weekly estimates:
🔹4.5 million infections
🔹>200,000 resulting long-term health conditions
🔹>1,300 resulting excess deaths Infections						Oct 6, 2025				pmc19.com/data Proportion Actively Infectious										1 in 81 (1.2%) New Daily Infections										 602,000  Infections the Past Week										 4,540,000  Infections in 2025										 189,000,000  Cumulative Infections per Person										 4.69  										 Long COVID										 Long COVID Cases Resulting								30,000 to 120,000		   from New Daily Infections										 Long COVID Cases Resulting								227,000 to 910,000		   from New Weekly Infections										 										 Excess Deaths										 Excess Deaths Resulting 									170 to 280	   from New Daily Infe...
Read 9 tweets

Did Thread Reader help you today?

Support us! We are indie developers!


This site is made by just two indie developers on a laptop doing marketing, support and development! Read more about the story.

Become a Premium Member ($3/month or $30/year) and get exclusive features!

Become Premium

Don't want to be a Premium member but still want to support us?

Make a small donation by buying us coffee ($5) or help with server cost ($10)

Donate via Paypal

Or Donate anonymously using crypto!

Ethereum

0xfe58350B80634f60Fa6Dc149a72b4DFbc17D341E copy

Bitcoin

3ATGMxNzCUFzxpMCHL5sWSt4DVtS8UqXpi copy

Thank you for your support!

Follow Us!

:(