How do we how well the covid vaccines performed?
We can look at this question from multiple angles and see. 🧵
We can look at this question from multiple angles and see. 🧵
First, there was the "secondary attack rate".
When someone tested positive this measure could be taken of the percentage of household contacts that later tested positive.
If vaccines reduced risk of infection this should have fallen.
It did not.
When someone tested positive this measure could be taken of the percentage of household contacts that later tested positive.
If vaccines reduced risk of infection this should have fallen.
It did not.

Another measure is how many people developed antibodies before and after vaccine.

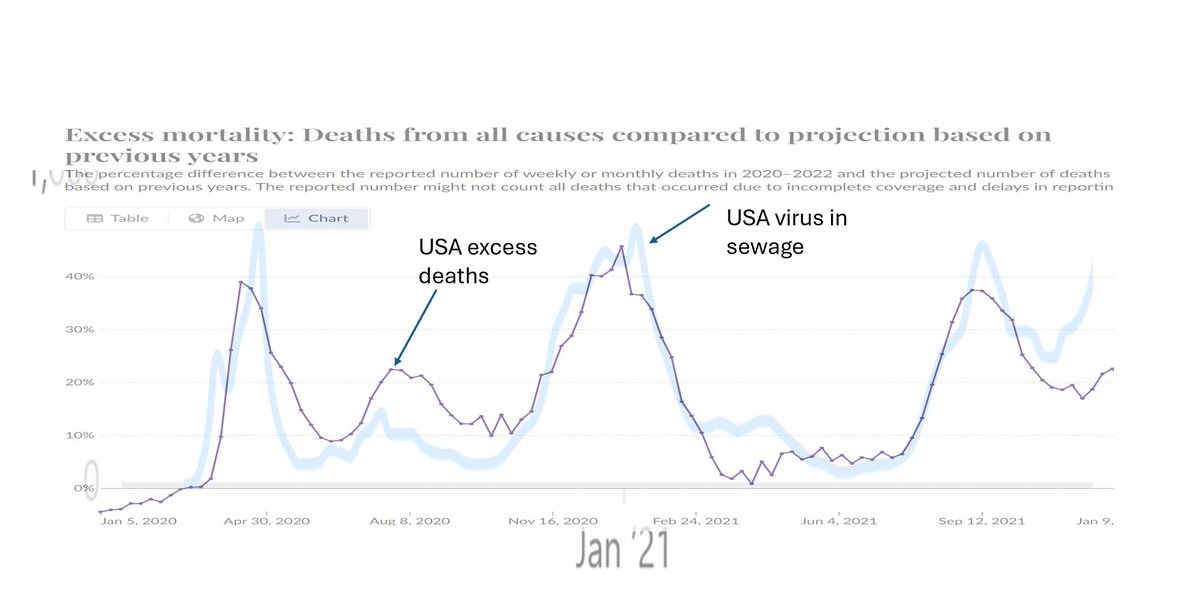
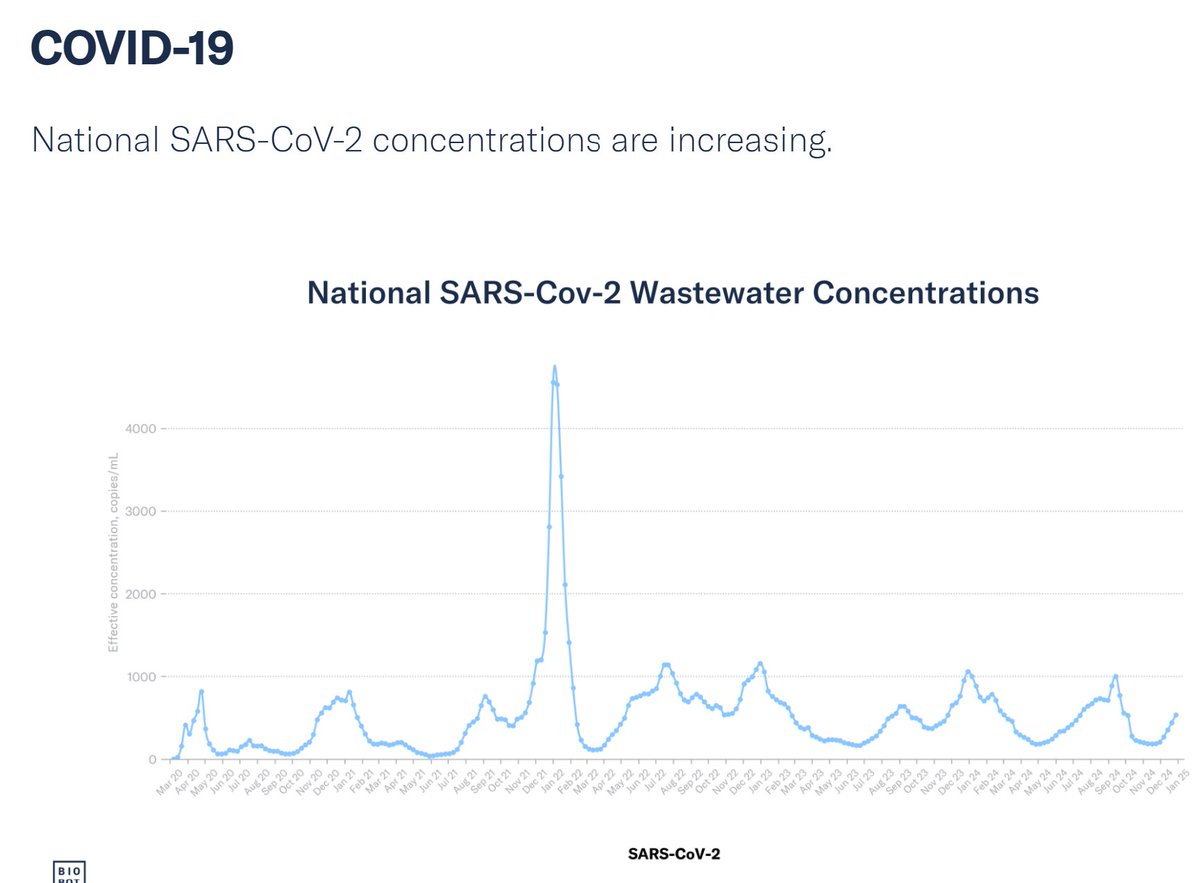
Next we can turn to USA to look at what happened to the amount of virus in the sewage.
Something weird happened in early 2022 (shortly after massive booster campaign) but the post vaccine waves prior to that were same dimensions as before.
Something weird happened in early 2022 (shortly after massive booster campaign) but the post vaccine waves prior to that were same dimensions as before.
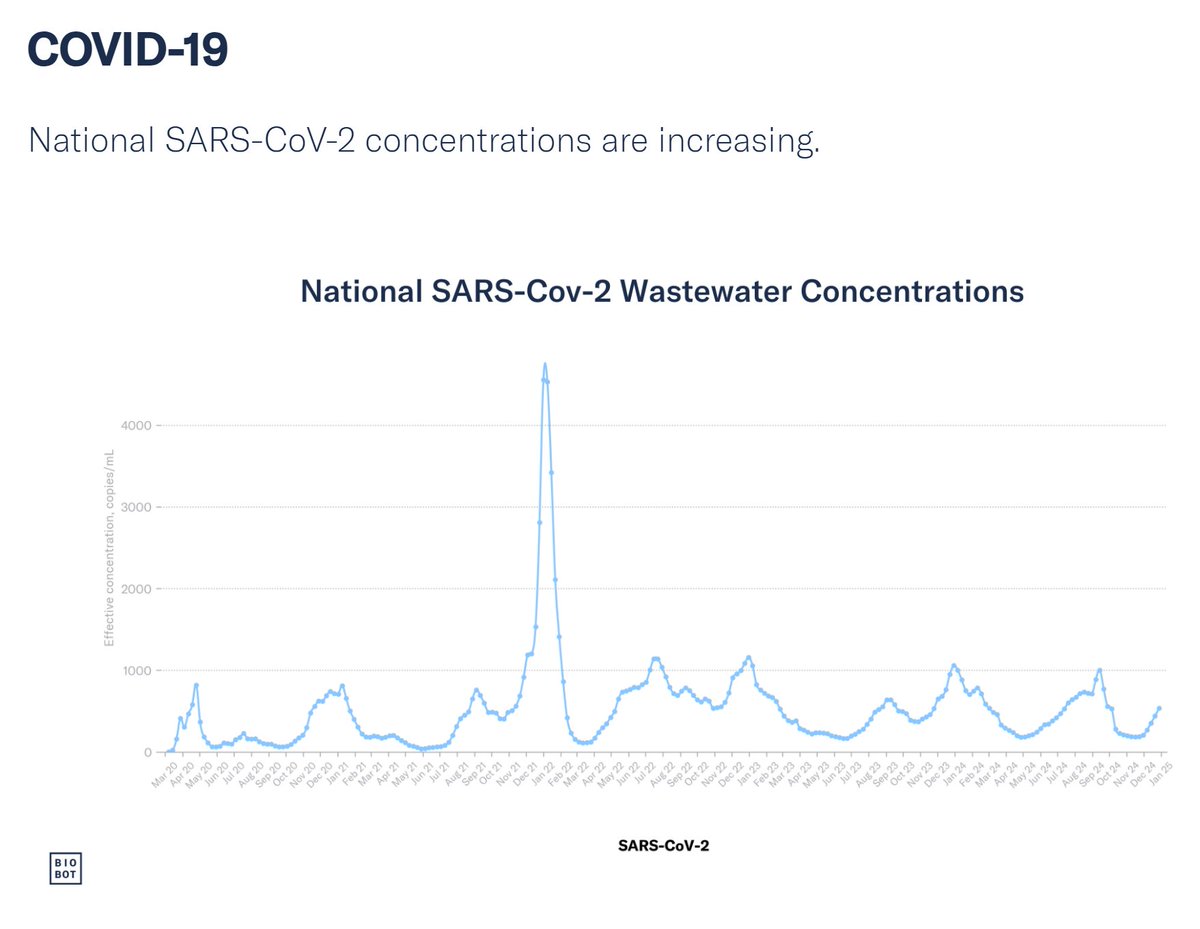
If vaccine reduced the susceptible population from 10% to 1% (which it didn't!) then a wave would take much longer to pass through the population (based on incorrect conventional beliefs) - because the virus would find it harder to find a new host.
The timing did not change.
The timing did not change.

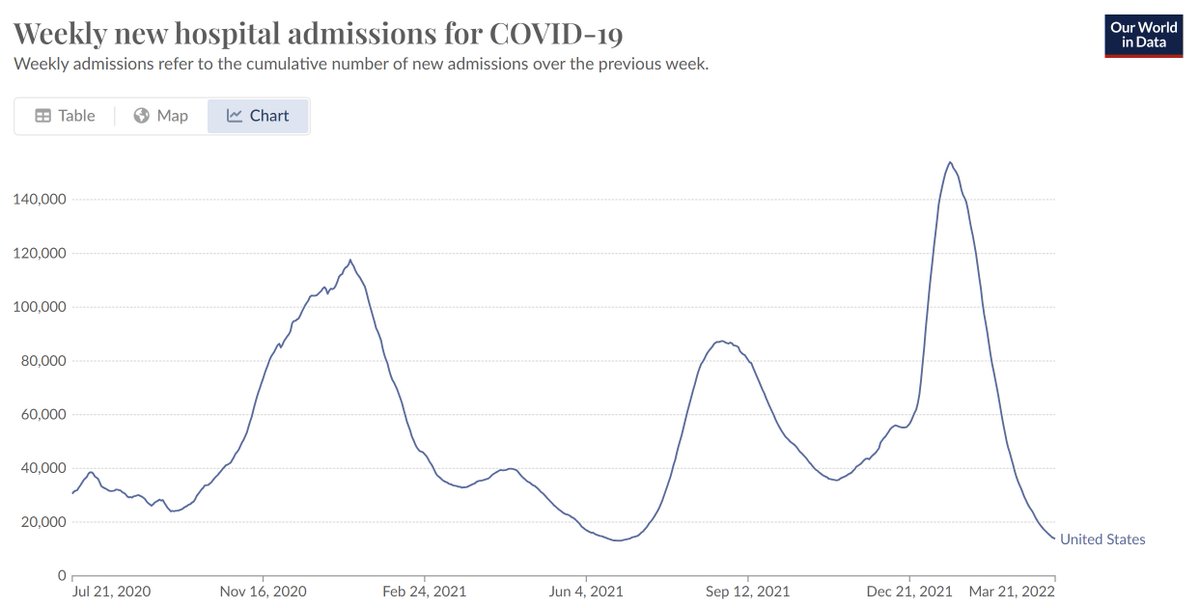
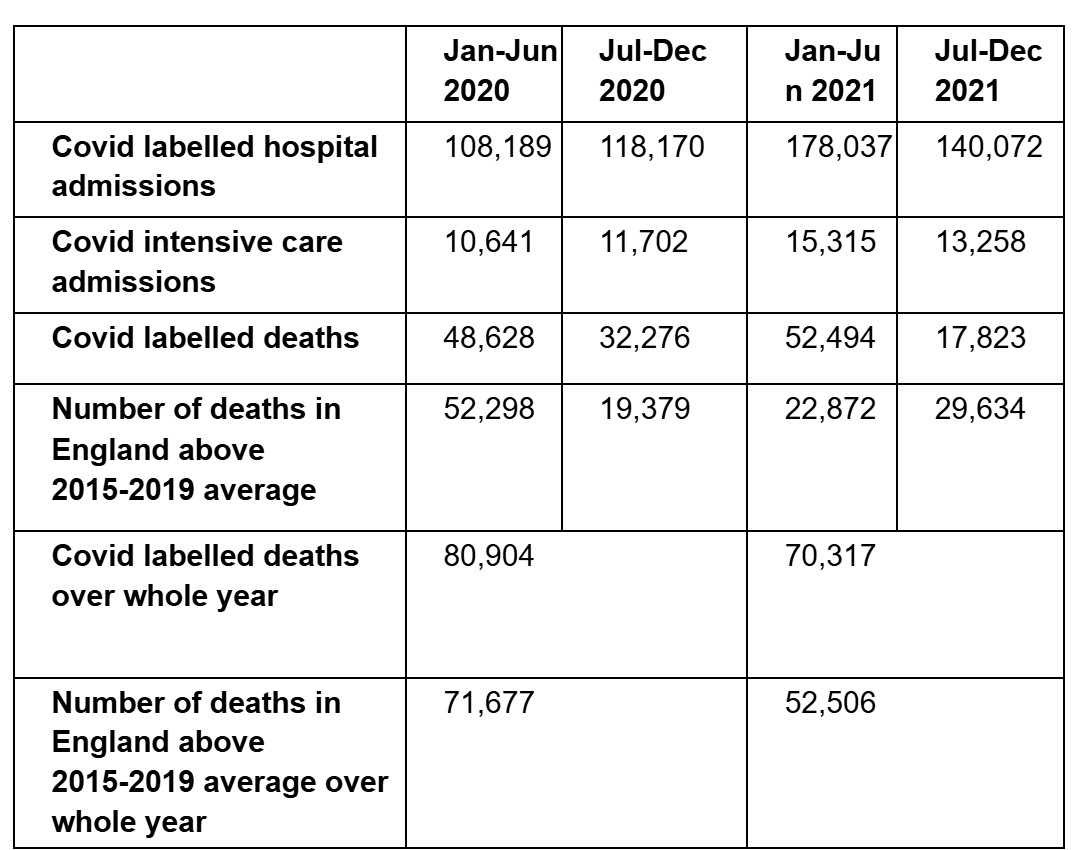
What about serious illness?
As with every wave there were geographical outliers unaffected. In summer and autumn 2021 those included UK, Portugal and Ireland - the most westerly European populations.
Elsewhere, there was little change in hospital admissions - perhaps some.
As with every wave there were geographical outliers unaffected. In summer and autumn 2021 those included UK, Portugal and Ireland - the most westerly European populations.
Elsewhere, there was little change in hospital admissions - perhaps some.
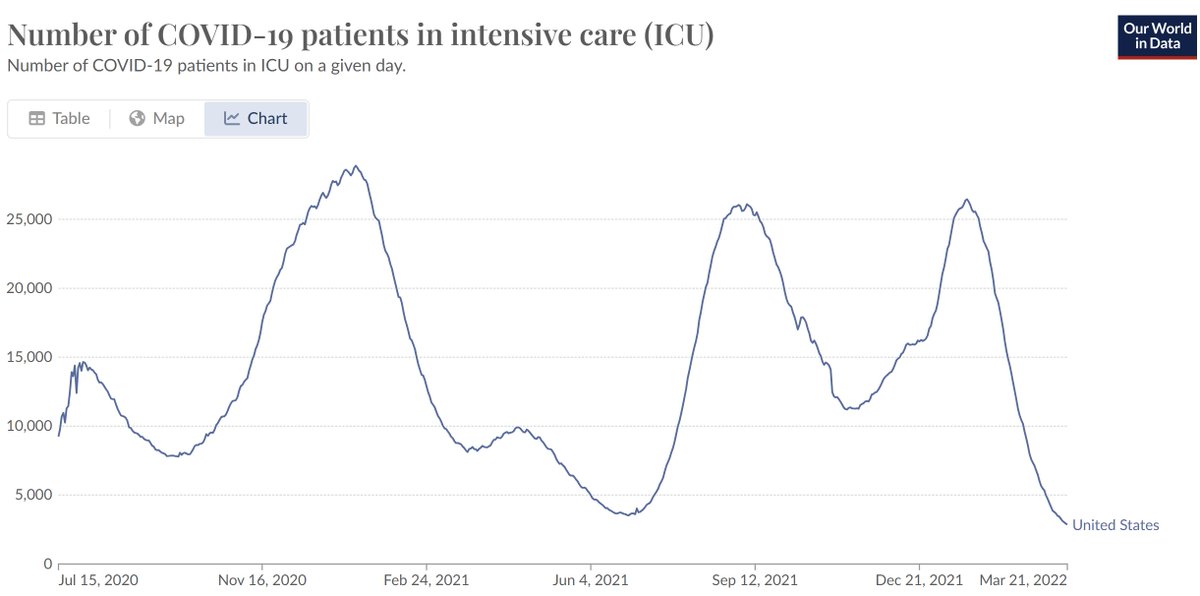
Nor in intensive care admissions.
Covid labelled deaths appear a little lower but...
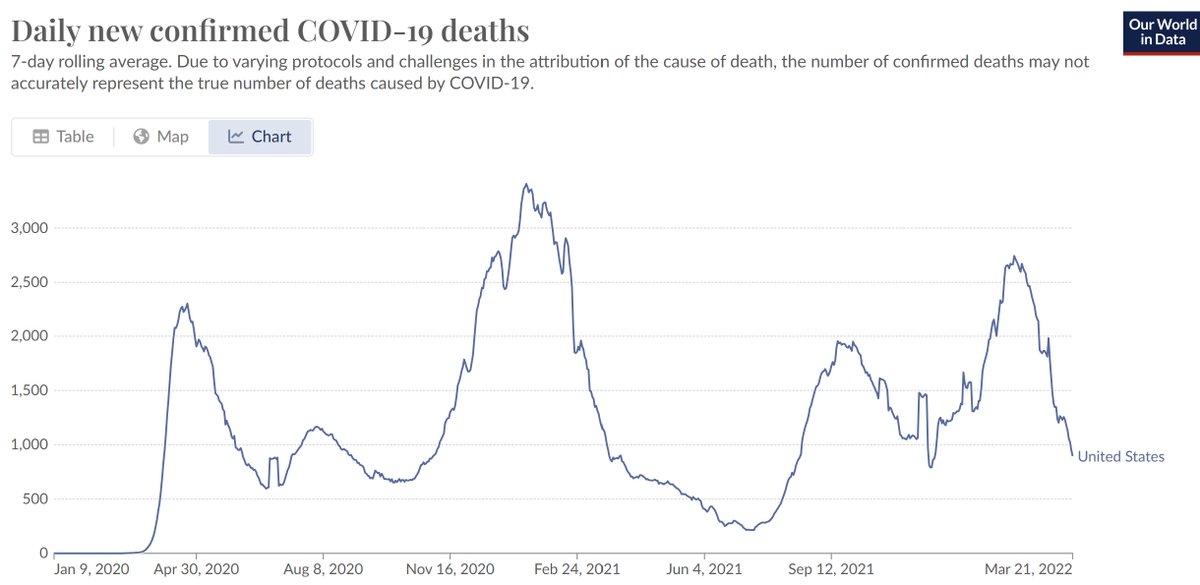
excess deaths match the virus in sewage trajectory.
The slight difference in spring 2021 is because of earlier deaths in the vaccinated who get their infections earlier because of immune suppression.
The slight difference in spring 2021 is because of earlier deaths in the vaccinated who get their infections earlier because of immune suppression.
Even in the UK, the Delta wave was flatter but over its full course nothing much changed in hospitals.
Covid labelled deaths were lower - but there are good reasons to think they were overdiagnosed earlier on.
Covid labelled deaths were lower - but there are good reasons to think they were overdiagnosed earlier on.
If there was a vaccine benefit then it should have been evident in geographical regions unaffected before 2022.
It wasn't.
Mortality was equivalent to US or Sweden in first wave.
It wasn't.
Mortality was equivalent to US or Sweden in first wave.
https://x.com/ClareCraigPath/status/1687825773208518657
To believe the vaccines were effective you need to believe all sorts of false assumptions fed into models by false prophets:
1. Everyone was susceptible to every variant
2. Lockdowns postponed a covid tsunami
3. Vaccines then stopped the covid tsunami
1. Everyone was susceptible to every variant
2. Lockdowns postponed a covid tsunami
3. Vaccines then stopped the covid tsunami
You also need to persuade yourself that the repetitive waves lasting ~16 weeks with peaks since at same times of year to before, are somehow different to what we should have expected all along.
You can comment that there is more virus around now...
You can comment that there is more virus around now...
That is because vaccinated people have a worse response to covid than the unvaccinated.
The third dose of mRNA presents a risk of the immune sytem switching to "let's ignore it as if it's food or pollen" response (IgG4 class switching).
The third dose of mRNA presents a risk of the immune sytem switching to "let's ignore it as if it's food or pollen" response (IgG4 class switching).
There's plenty of evidence that the vaccinated had a higher risk of infection as a consequence.
Far from making things better the vaccines increased risk in the first two weeks from immune suppression.
Increased risk long term.
Far from making things better the vaccines increased risk in the first two weeks from immune suppression.
Increased risk long term.
• • •
Missing some Tweet in this thread? You can try to
force a refresh