4-1/ My COVID update for epidemiological weeks 3-4 of 2025.
For the 1st time since 1952, the CDC stopped publishing its Morbidity and Mortality Weekly Report (MMRW)—the last update was on 16 Jan. Is the Trump administration emulating Chinese secrecy practices?
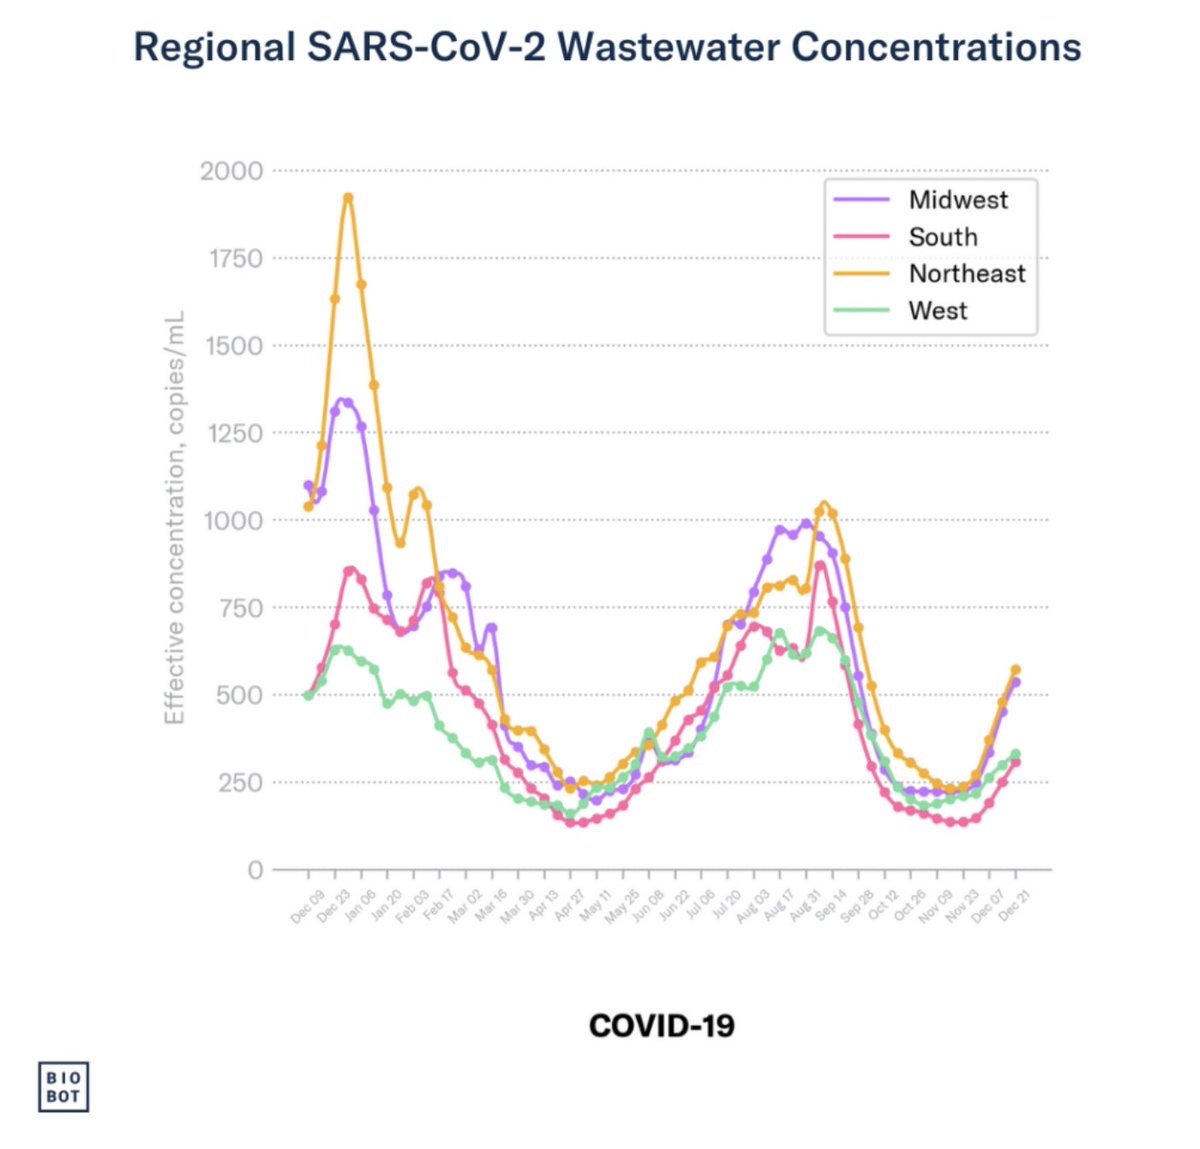
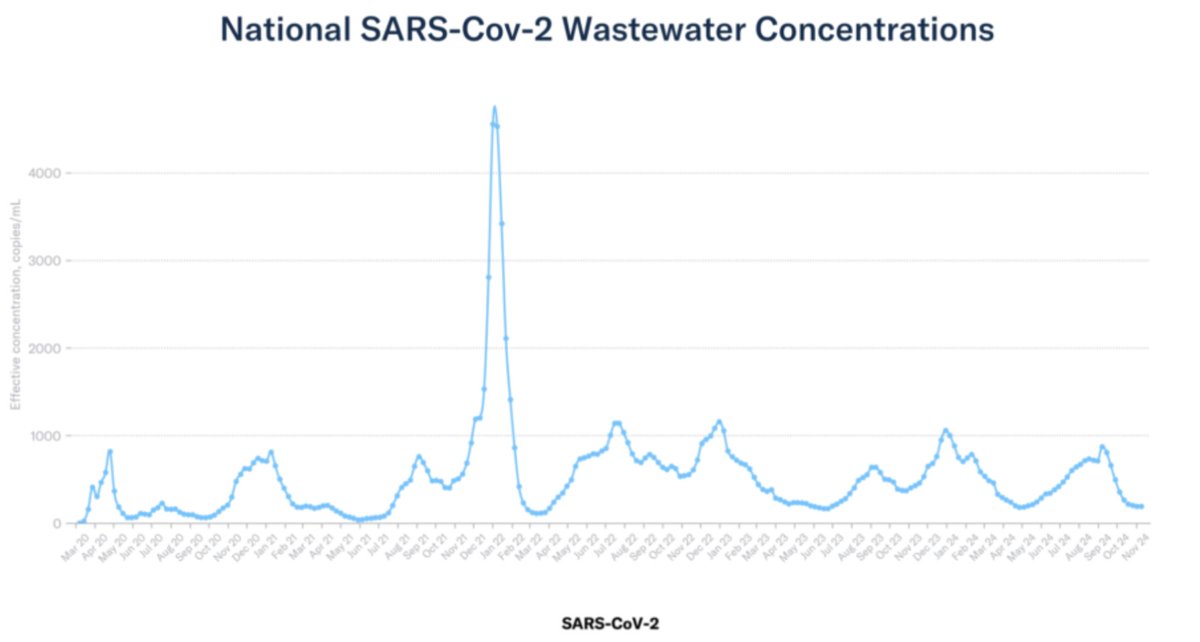
4-2/ Other CDC data pages seem to be up and running, though. Their wastewater numbers seem to indicate the current XEC COVID wave has peaked. Biobot hasn't published an update recently, so I don't have a reality check for CDC's data.
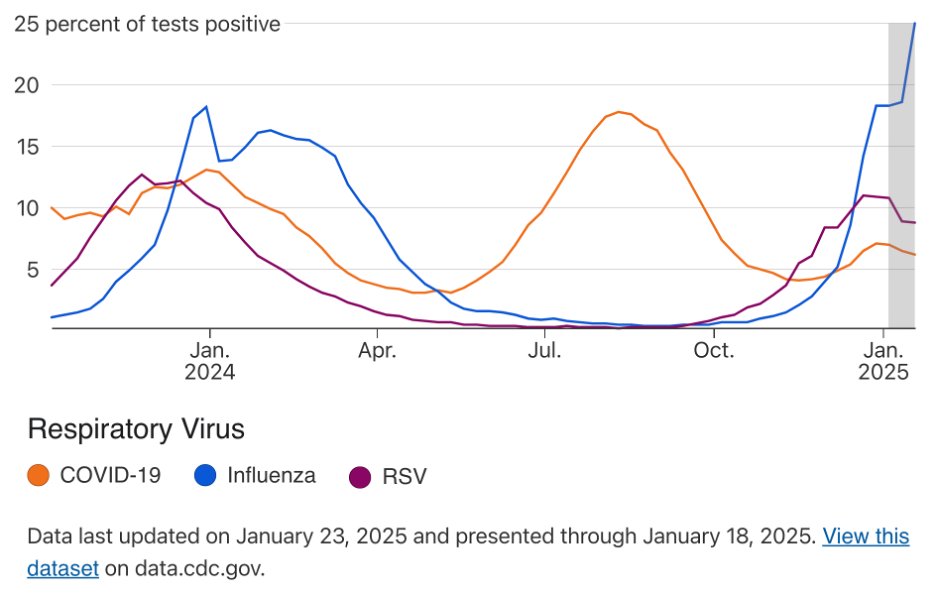
4-3/ Biofire's proprietary Syndromic Trends also shows COVID dropping off as a percentage of detected respiratory viruses. RSV may also be on downward curve, but influenza is rising fast.
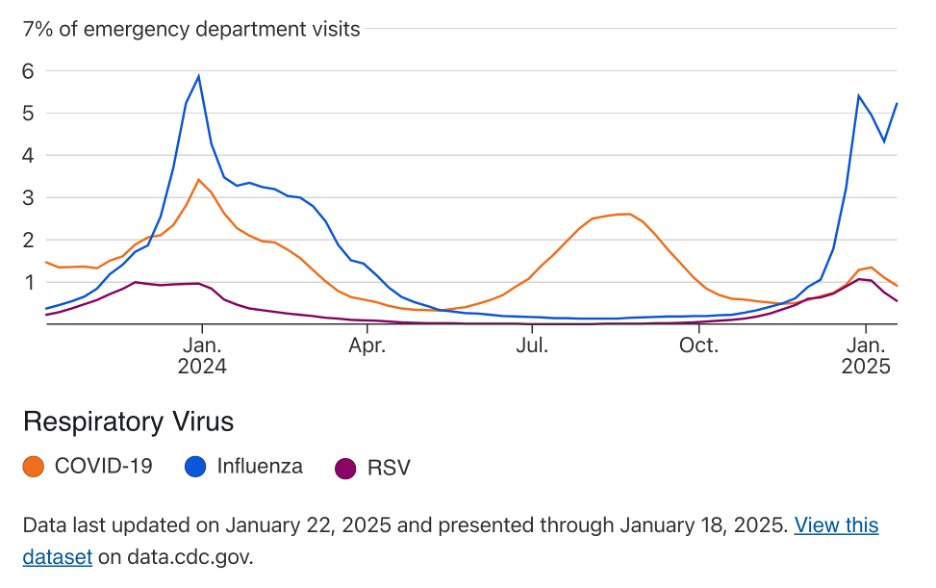
C4-4/ As of last week, COVID was 6.2% of positive tests, while RSV was 8.8%, and Influenza at 25% (!). Likewise, Flu is at 5.2% of ED visits, while COVID is 0.9% and RSV is 0.6%.
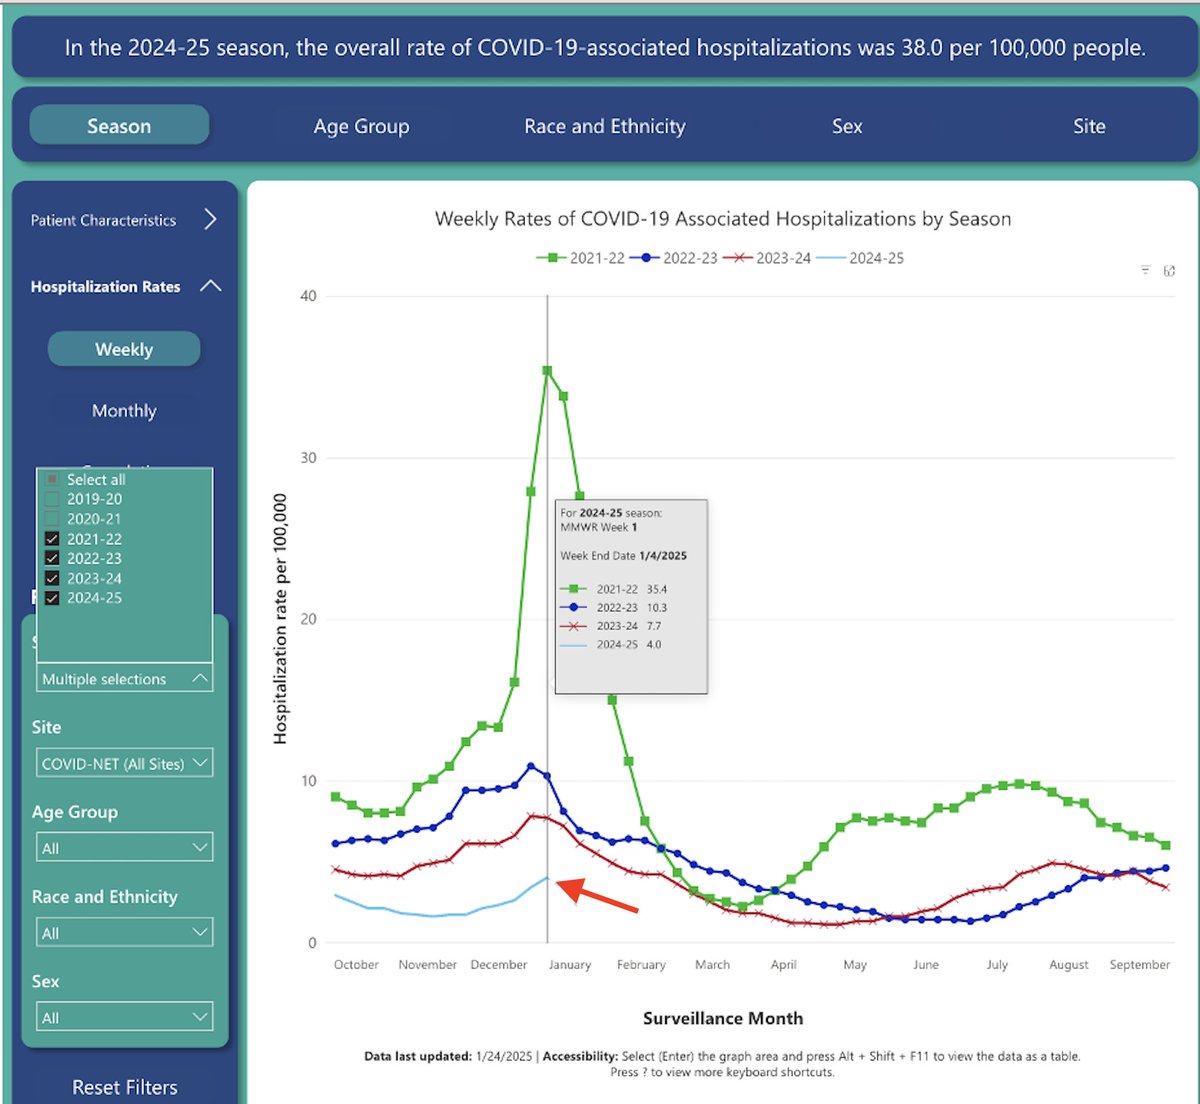
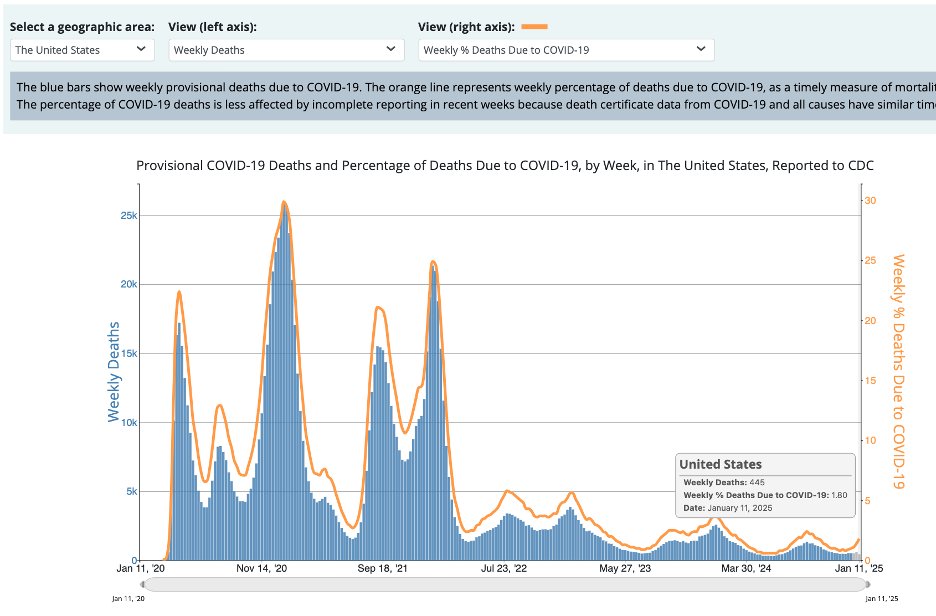
4-5/ COVID hospitalizations are lower than previous years—and about half of what last winter's were (4/100,000 vs 7.7/100,000). Despite the XEC wave, weekly deaths remain low. Not sure if we'll continue to see these numbers now that the MMWR reports have stopped.
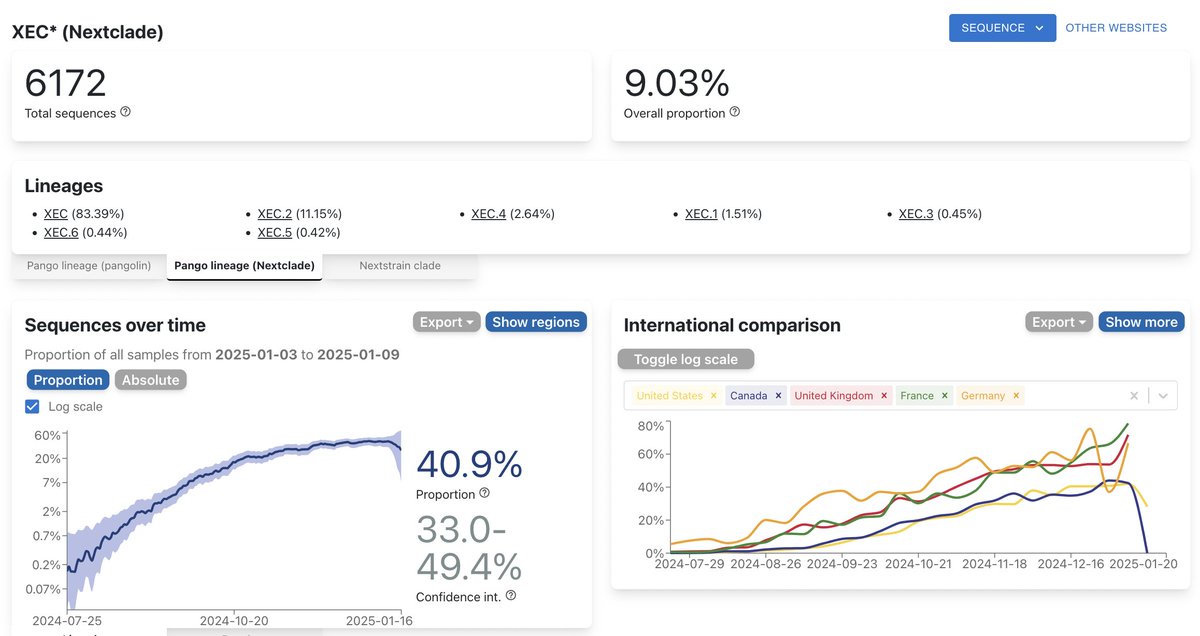
4-6/ It's very likely that we are past the peak of the current COVID wave. XEC seems to have lost steam. Cov-Spectrum shows it topping out at 41% of sequences. The CDC Nowcast shows it at ~47%, but their Nowcast isn't very sensitive to changes in growth rates.
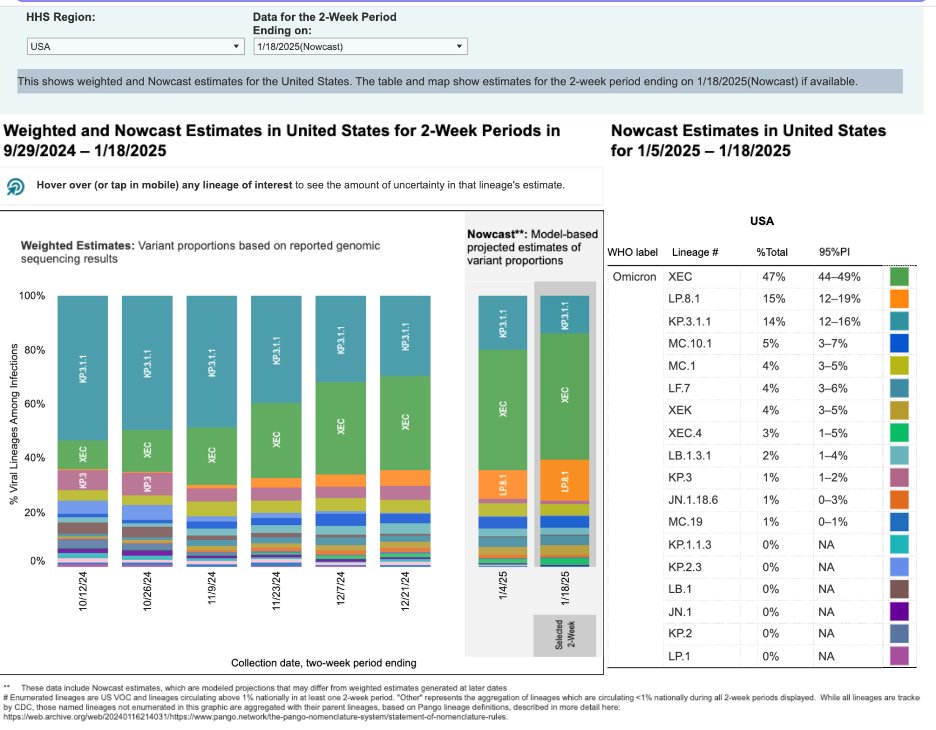
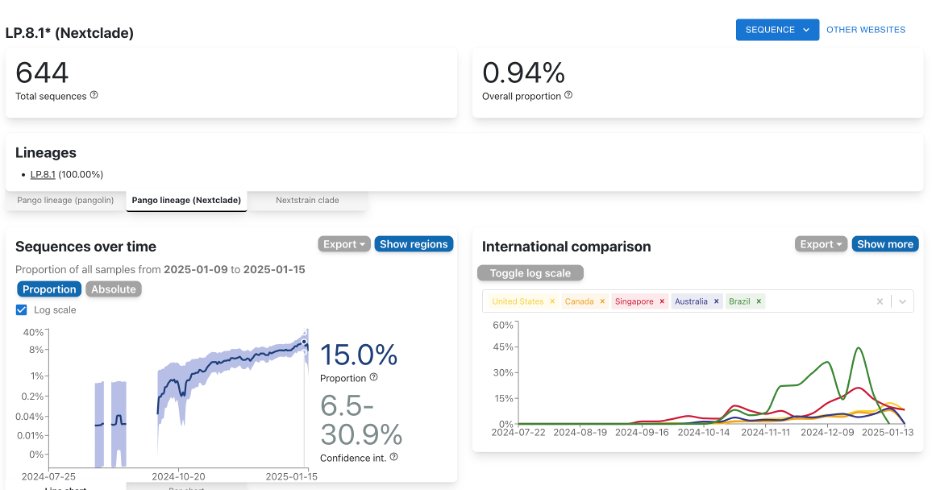
4-7/ What's next? LP.8.1 is the only major var that's showing any legs. But except in countries with low sampling rates, it hasn't gotten much above 20%. Maybe it will create a secondary wavelet on the tail end of our dinky winter wave, but I doubt it.
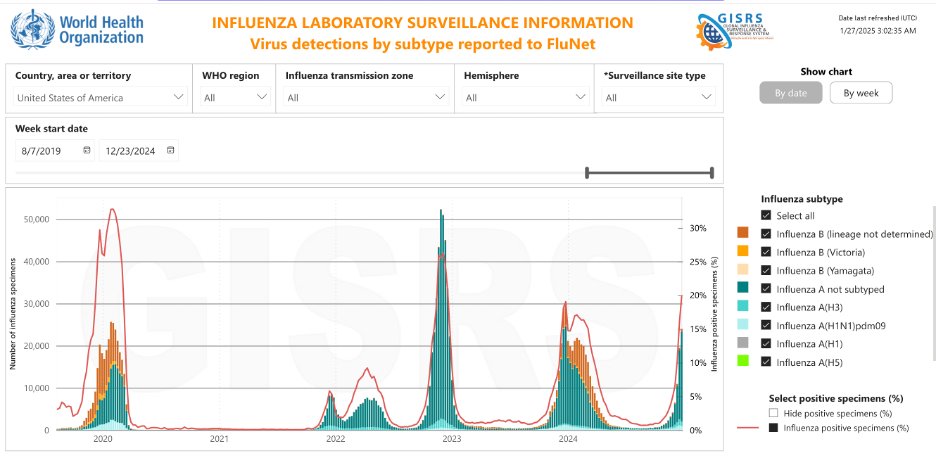
4-8/ While COVID and RSV may have peaked, this winter's Influenza wave is still growing.
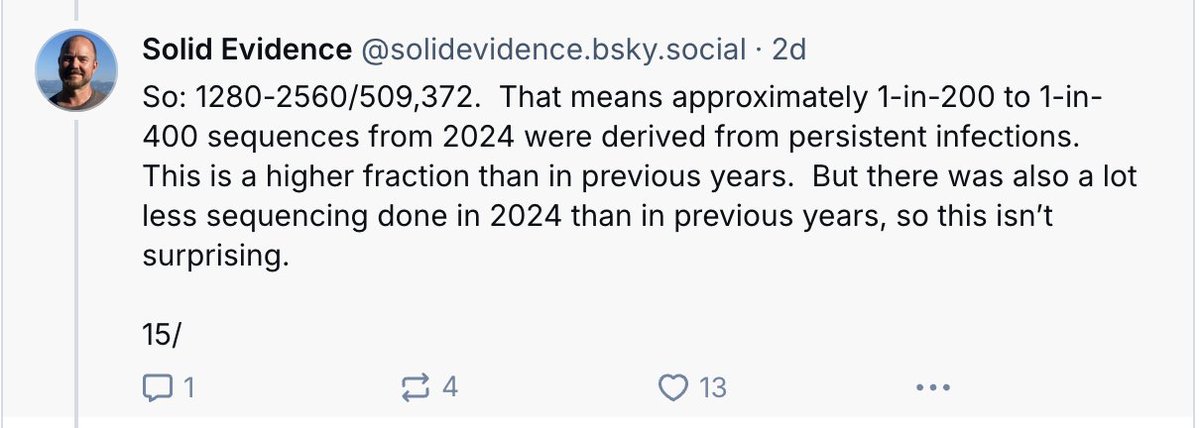
4-9/ Over on bsky, Marc Johnson (@SolidEvidence on X and bsky) calculates that between 0.25-0.5% of ww samples are from persistent infections. I'd be curious what percentage of these peeps are suffering from Long COVID or are asymptomatic.
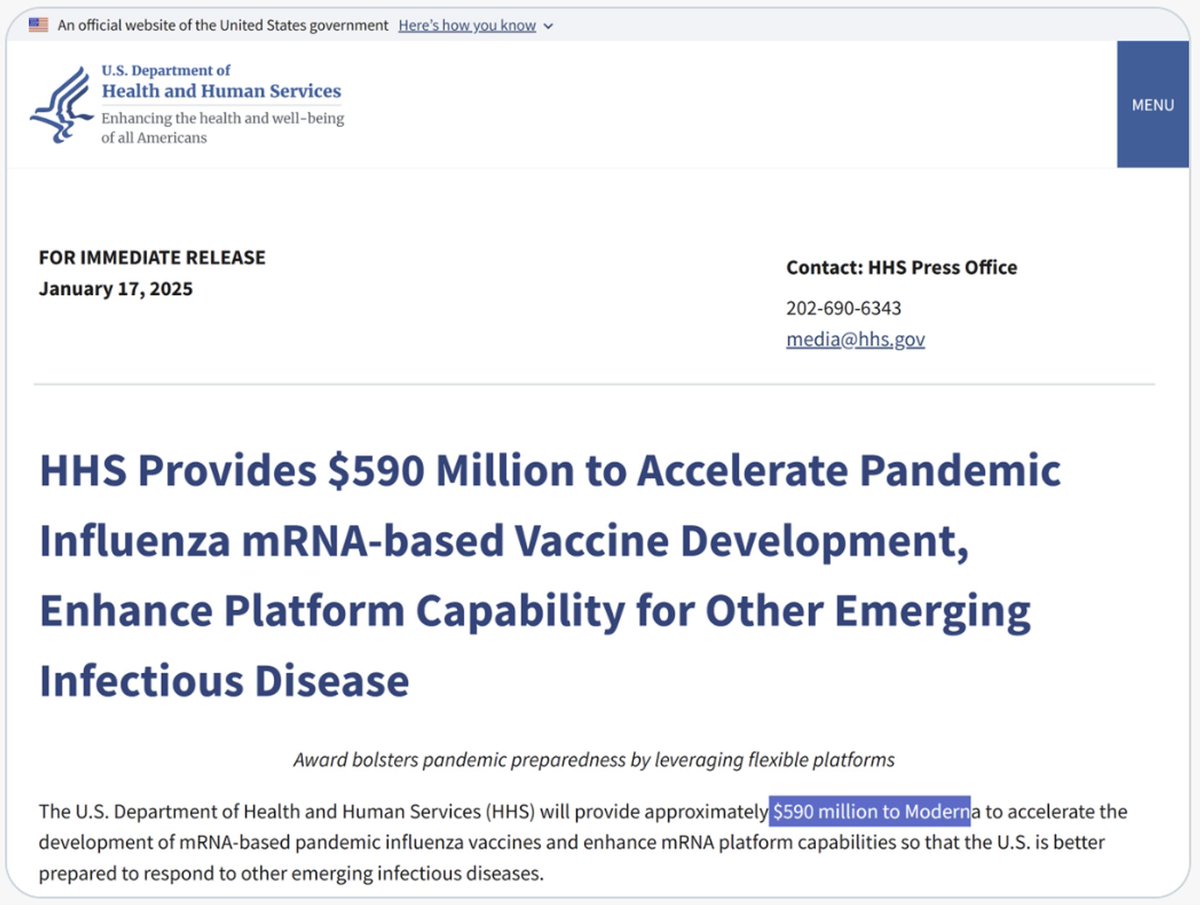
4-10/ In HPAI news, 3 days before Trump's inauguration, Biden awarded Moderna $590 million to develop mRNA-based pandemic vaccines. It's not clear if the Trump administration will try to cancel this grant.
4-11/ Finally, there are rumors that human-to-human transmission of HPAI has been happening in Shanxi and Hebei provinces (northern China) w/ deaths in the hundreds. Rumors only. Other rumors say this is an HMPV outbreak. I'm sure Bhatty and Brainworm are on it. #snarkasm
4-12/ That's it for now. See you in two epi weeks.
@threadreaderapp unroll
• • •
Missing some Tweet in this thread? You can try to
force a refresh
2-1/ Happy New Epidemiological Year! This is my COVID update for epidemiological weeks 1-2 of 2025.
Biobot shows wastewater concentrations rising steeply in the South and Midwest. 5 weeks into this wave nat'l ww concentrations have risen at ~2x rate of the previous KP.3x wave.
2-2/ CDC's ww graph shows a higher rise in the Midwest and less so in the South. Of course, the CDC normalizes its numbers against the previous year, so these are relative numbers—not avg SARS2/PMMoV concentrations in CpmL units. Biobot methodology seems more straightforward.
2-3/ COVID hospitalizations are on the rise, but for some reason, the CDC seems to be predicting that the data, once tabulated, will show a drop in hospitalizations in the final week of December. This seems counterintuitive, with wastewater numbers rising so steeply.
52-1/ COVID update for epidemiological weeks 51-52 of 2024.
Here we go again! National SARS2 wastewater numbers are climbing quickly, especially in the NE and Midwest.
52-2/ Of the big 3 respiratory viruses (per CDC), COVID still trails RSV and influenza in test positivity, but has now passed RSV in the number of ED visits.
52-3/ COVID deaths are probably still falling but hospitalizations (based on incomplete data) are rising. And a rise in deaths will follow as hospitalizations rise.
50-1/ COVID update for epidemiological weeks 49-50 of 2024.
As of a week ago (epi week 49), COVID joined Influenza and RSV as a URTI that shows an upward trend in ED visits.
50-2/ The folks at Biobot haven't posted an update for two weeks, so I don't have any good aggregate wastewater numbers for the US (b/c the CDC doesn't publish nat'l data in CpmL units). So, let's zoom in on what's happening in some big city sewersheds. NY State first...
50-3/ Notice that both the Buffalo and the greater NYC metro areas seem to be COVID hotspots. All of NYC's 14 sewersheds show upward trends in SARS2 wastewater concentrations.
Manhattan's two sewersheds below. Wards Island shows the steepest increase of all NYC's sewersheds.
48-1/ COVID update for epidemiological weeks 47-48 of 2024—but since this is the season of URT infections, and COVID-19 is on hiatus, this week's update will also look at the other respiratory viruses that are making us sick at the moment.
48-2/ Today is the fifth anniversary of the COVID-19 pandemic. The symptoms of patient zero, a 55-year-old male, began on 1 December 2019. He wasn't hospitalized until the following 8 Dec. But by the end of Dec, 41 people were hospitalized with a novel form of pneumonia.
48-3/ On 28 Dec 2019, Dr. Lili Ren, a virologist at Union Medical College in Beijing submitted a complete sequence of SARS-CoV-2 to GenBank, but it failed to include the proper annotations & wasn't made public. Not until 10 Jan that a sequence was available on GenBank & GISAID.
46-1/ COVID update for epidemiological weeks 45-46 of 2024.
I wanted to move these updates over to the blue skies beyond Muskland, but ThreadReader doesn't work over there yet. Also, I bookmark a lot of interesting posts, but that's not a feature over there. So here we go...
46-2/ COVID wastewater numbers remain low, but SARS2 is still circulating. XEC's growth rate has plateaued in the US (and it might be dropping), so I don't think the next wave will be an XEC.x wave. But...
46-3/ But Ben Murrell's model seems to indicate that XEC still has wave potential—h/t to @BenjMurrell (at least, I think that's his TwiXter handle). Cov-Spectrum shows It's taking off in the UK and Germany. But UK cases are still dropping. From this, I conclude that XEC is...
44-1/ COVID update for epidemiological weeks 43-44 of 2024.
National COVID wastewater numbers dropped fast, but have probably leveled out. From the 1 Nov Biobot report...
44-2/ I'll point out again: COVID interwave ww concentrations are order of magnitude higher than flu and RSV ww concentrations (peak Flu A is that little red X under COVID)—perhaps due to differences in their viral shedding? But SARS2 is always circulating relatively high levels.
44-3/ I point this out because SARS2 is behaving differently from other respiratory viruses, and its continued transmission during the interwave periods may contribute to its a-seasonal behavior.