This key chart from @SemiAnalysis_ appears to have been the key source for claims of "50,000 Hoppers" and more detailed disclosure on their CapEx buildup analysis ("$1.3B").
But the table has errors/inconsistencies. More significantly, key assumptions don't pass sanity checks.
But the table has errors/inconsistencies. More significantly, key assumptions don't pass sanity checks.

1⃣ First thing you might notice is that it says 60,000 in the Total column.
But the A100s aren't "Hoppers". So the 50,000 is just the last three columns.
Ok, so far so good.
But the A100s aren't "Hoppers". So the 50,000 is just the last three columns.
Ok, so far so good.

This is where it starts to get confusing.
The Total column only seems to SUM the first three columns.
Also "ASP" and "per GPU" are average numbers, so you cannot just sum it up. You need to do a weighted average. So the Total figures make no sense.
The Total column only seems to SUM the first three columns.
Also "ASP" and "per GPU" are average numbers, so you cannot just sum it up. You need to do a weighted average. So the Total figures make no sense.

While the top "# of GPUs" line sums up all four columns, down below only the first three columns are added together.
So the $1.3B capex figure doesn't include the H100s?
Careless formula error? Or do we read more into it?
So the $1.3B capex figure doesn't include the H100s?
Careless formula error? Or do we read more into it?
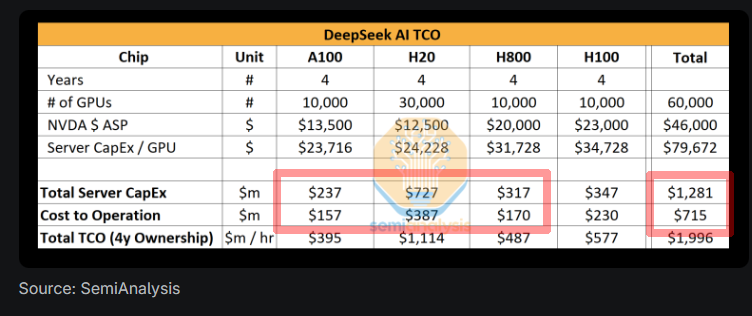
And then this last line seems to be a sum of Server CapEx and "Cost to Operation".
But TCO (4y Ownership) implies that it should be a per year figure (the label says "$m/hr").
I think it should be the sum of the Server CapEx + Cost to operation divided by 4 but hard to say.
But TCO (4y Ownership) implies that it should be a per year figure (the label says "$m/hr").
I think it should be the sum of the Server CapEx + Cost to operation divided by 4 but hard to say.

Anyway I put together what I think is a corrected version of this chart if we are counting all 60,000 chips it is $1.6B and $640M p.a. of TCO.

If we are only doing "Hoppers" then it is $1.4B of CapEx and $545M p.a. of TCO.

2⃣ Ok all these might just be chalked up to basic first-year analyst spreadsheet errors and may or may not impact the ultimate analysis.
More substantively ... how credible is the "50,000 Hoppers" estimate in the first place?
More substantively ... how credible is the "50,000 Hoppers" estimate in the first place?
The article links to a proprietary "Accelerator Model" that is paywalled so difficult for me to confirm rationale here beyond pure speculation ...
... but what I can do is run a sanity check based on basic understanding of the economics of fund management.
... but what I can do is run a sanity check based on basic understanding of the economics of fund management.
Some people out there are saying High Flyer managed $8B in funds, implictly assuming that those sums could support such a large CapEx number.
But that's not how the hedge fund business works.
But that's not how the hedge fund business works.
What we know about High Flyer and DeepSeek:
▪️ High-Flyer was a quant fund with $8 billion in AUM.
▪️ DeepSeek was "self funded" by High-Flyer.
Can a $7B AUM hedge fund self fund $1.6B of capex? Highly unlikely.
▪️ High-Flyer was a quant fund with $8 billion in AUM.
▪️ DeepSeek was "self funded" by High-Flyer.
Can a $7B AUM hedge fund self fund $1.6B of capex? Highly unlikely.

The economics of a hedge fund are typically a management fee and performance fees.
1%/20% is typical.
So on $7B, High Flyer would generate an estimated $70M in management fees.
1%/20% is typical.
So on $7B, High Flyer would generate an estimated $70M in management fees.
Performance fees are calculated only on gains. Note below High Flyer's performance of ~13% annualized since 2017.
However, note also how returns have basically been down since 2021. There are unlikely to have been significant performance fees since 2021.
However, note also how returns have basically been down since 2021. There are unlikely to have been significant performance fees since 2021.

So while strong fund performance through '21 — albeit likely on much lower AUM as it was ramping up — could have arguably funded the reported purchase of ~¥1B in GPUs in 2021, it is unlikely that the hedge fund itself could have continued self-funded that level of CapEx going forward.

$130M is already an extreme amount of CapEx for an $7B fund.
Blackstone, which has more than 100x the AUM (which drives revenue), has an annual capex budget of ~$250M.
Goldman Sachs generates close to 1,000x the revenue as High Flyer, and has an annual CapEx budget of ~$2.5B.
Blackstone, which has more than 100x the AUM (which drives revenue), has an annual capex budget of ~$250M.
Goldman Sachs generates close to 1,000x the revenue as High Flyer, and has an annual CapEx budget of ~$2.5B.
Similarly companies like Alibaba, Baidu and Bytedance generate tens of billions in revenue, orders of magnitude above High Flyer.
They can afford to spend billions buying nVidia chips and building out their own internal datacenters.
They can afford to spend billions buying nVidia chips and building out their own internal datacenters.
There is absolutely no way an $8 billion fund (with flat/negative returns over the period) could have "self-funded" another $1.6 billion in CapEx.
You know what it could have reasonably funded? 2,048 H800 datacenter worth ~$70M ...
You know what it could have reasonably funded? 2,048 H800 datacenter worth ~$70M ...
... and even here that is quite an extreme CapEx ratio for a fund generating a total of ~$70M (maybe) of management fees that need to pay for fund operations themselves.
So the only possible way that High Flyer could have funded the purchase of another even just 10,000 H800s would have been to have raised secret outside funding for DeepSeek, which of course contradicts the article itself.
Of course, there are now rumors of that swirling around — maybe as people figure out the above math — but then we should just be up front that these estimates are based on pure unsubstantiated speculation and just leave it at that.
A model (even one riddled with basic formula errors) is only as good as its assumptions and it looks like the assumptions here of DeepSeek having access to "50,000 Hoppers" to build out v3 are built on an increasingly shaky foundation.
This is what it looks like with DeepSeek's actual reported cluster of 2,048 H800 GPUs.
These still seem high, but are at least within the realm of reason.
These still seem high, but are at least within the realm of reason.

High-Flyer Quant Fund CEO Lu Zhenghe disclosed in an interview in 2020 that "70% of annual revenue is reinvested back into research and development" with strong implication that it is mostly production related, and not CapEx.
pekingnology.com/p/ceo-of-deeps…
pekingnology.com/p/ceo-of-deeps…

P.S. A very common Excel mistake is when you add a column and formula doesn't pick it up.
I suspect this is what happened here: Analyst added "H100" column, Total formula didn't pick it up + while top row is easy to spotcheck, bottom ones were missed
I suspect this is what happened here: Analyst added "H100" column, Total formula didn't pick it up + while top row is easy to spotcheck, bottom ones were missed
https://x.com/GlennLuk/status/1885306503252300024
P.P.S.

P.P.P.S. Call me when AGI can figure out Excel, amirite @abcampbell ?
P.P.P.P.S. This is just a very quick estimate of the lifetime revenue that High Flyer funds would have generated with accompanying assumptions.
~$400 million available for reinvestment into both R&D and CapEx.
~$400 million available for reinvestment into both R&D and CapEx.

As mentioned earlier, this estimated P&L would support the self-funded buildout of the initial dataclusters (up to 10,000 A100s) through 2021 but hard to see how it could have self-funded anything close to the implied OoM increase in CapEx.
https://x.com/GlennLuk/status/1885306523120730422
The 10,000 A100s bet was already an extraordinary bet for Liang / High Flyer, with parallels to Elon Musk investing nearly all his PayPal sale proceeds into Tesla + SpaceX.
It's also inconsistent with Quant Fund CEO's comments in 2020 of redirecting reinvestment efforts at R&D (a.k.a. smart people) instead of CapEx.
It's also inconsistent with Quant Fund CEO's comments in 2020 of redirecting reinvestment efforts at R&D (a.k.a. smart people) instead of CapEx.
And yes it makes much more sense that DeepSeek rented from the bigger players and didn’t even own the “2,048 H800s” that they mentioned in the v3 paper.
The H800s that they owned would have been for limited R&D purposes, like trying to hack the PTX code.
So bottom line is I think we violently agree the 50,000 number makes no sense.
The H800s that they owned would have been for limited R&D purposes, like trying to hack the PTX code.
So bottom line is I think we violently agree the 50,000 number makes no sense.
@YouJiacheng @angelusm0rt1s @blob_watcher Until they close that loophole
@FarazKh78685502 @dylan522p @SemiAnalysis_ Just to save you the suspense - no Liang doesn’t have a trust fund
https://twitter.com/cdtchinese/status/1885020946404434233
• • •
Missing some Tweet in this thread? You can try to
force a refresh