These 2 Candle Ranges Will Retire You
Secret Sauce Revealed
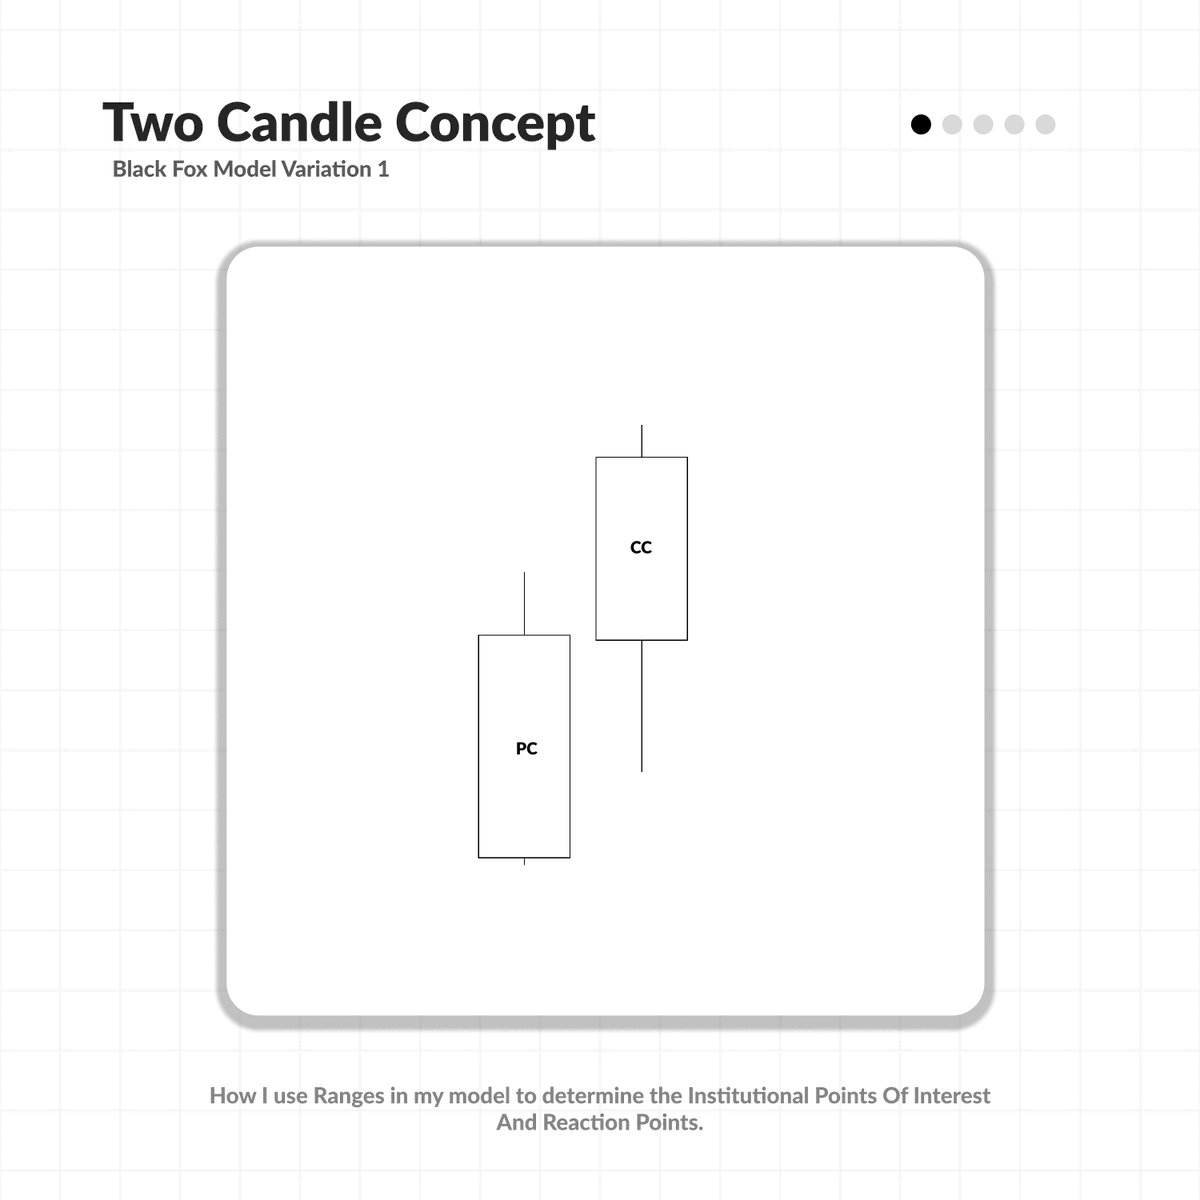
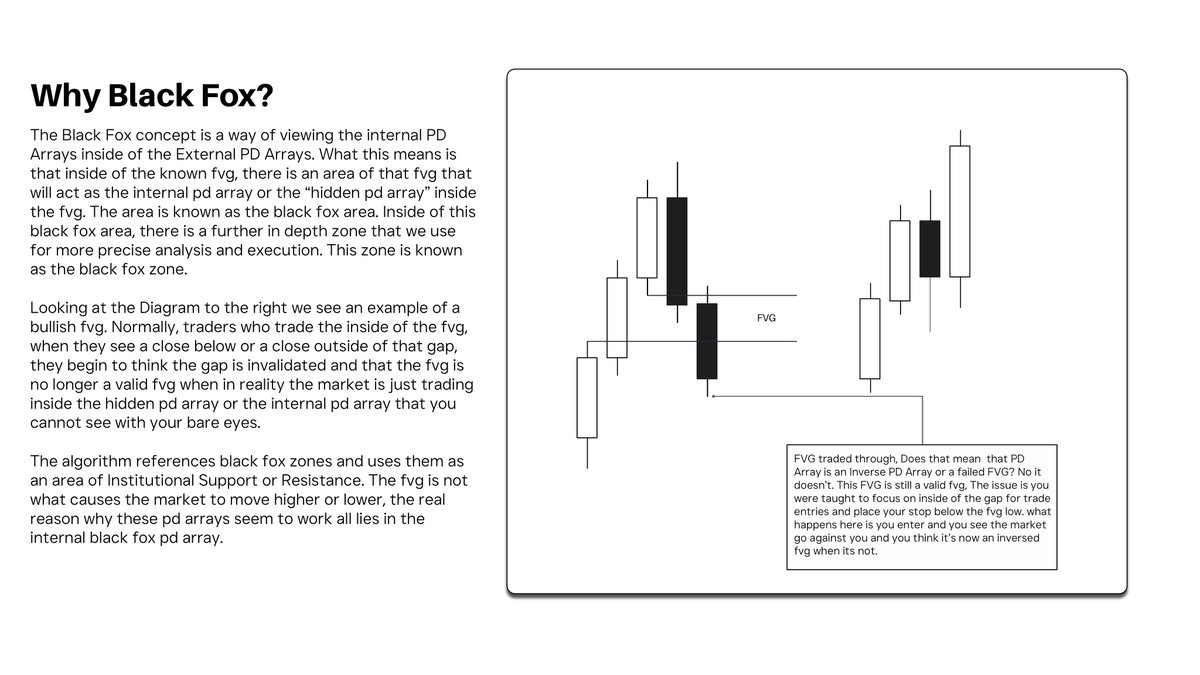
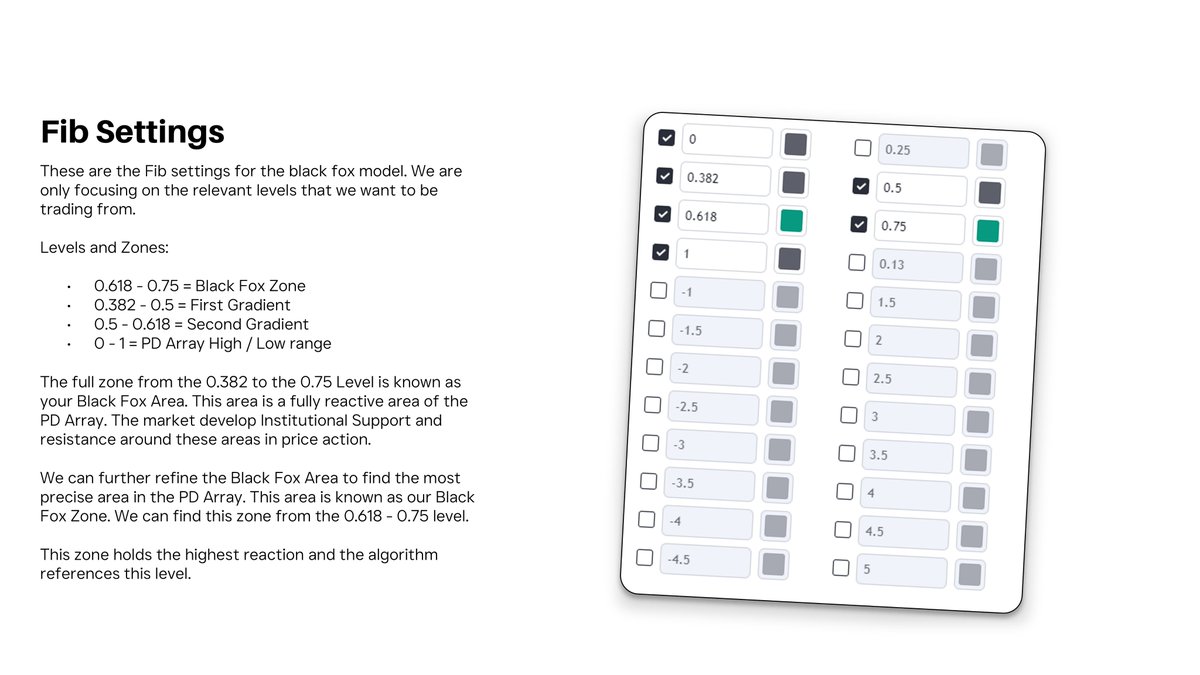
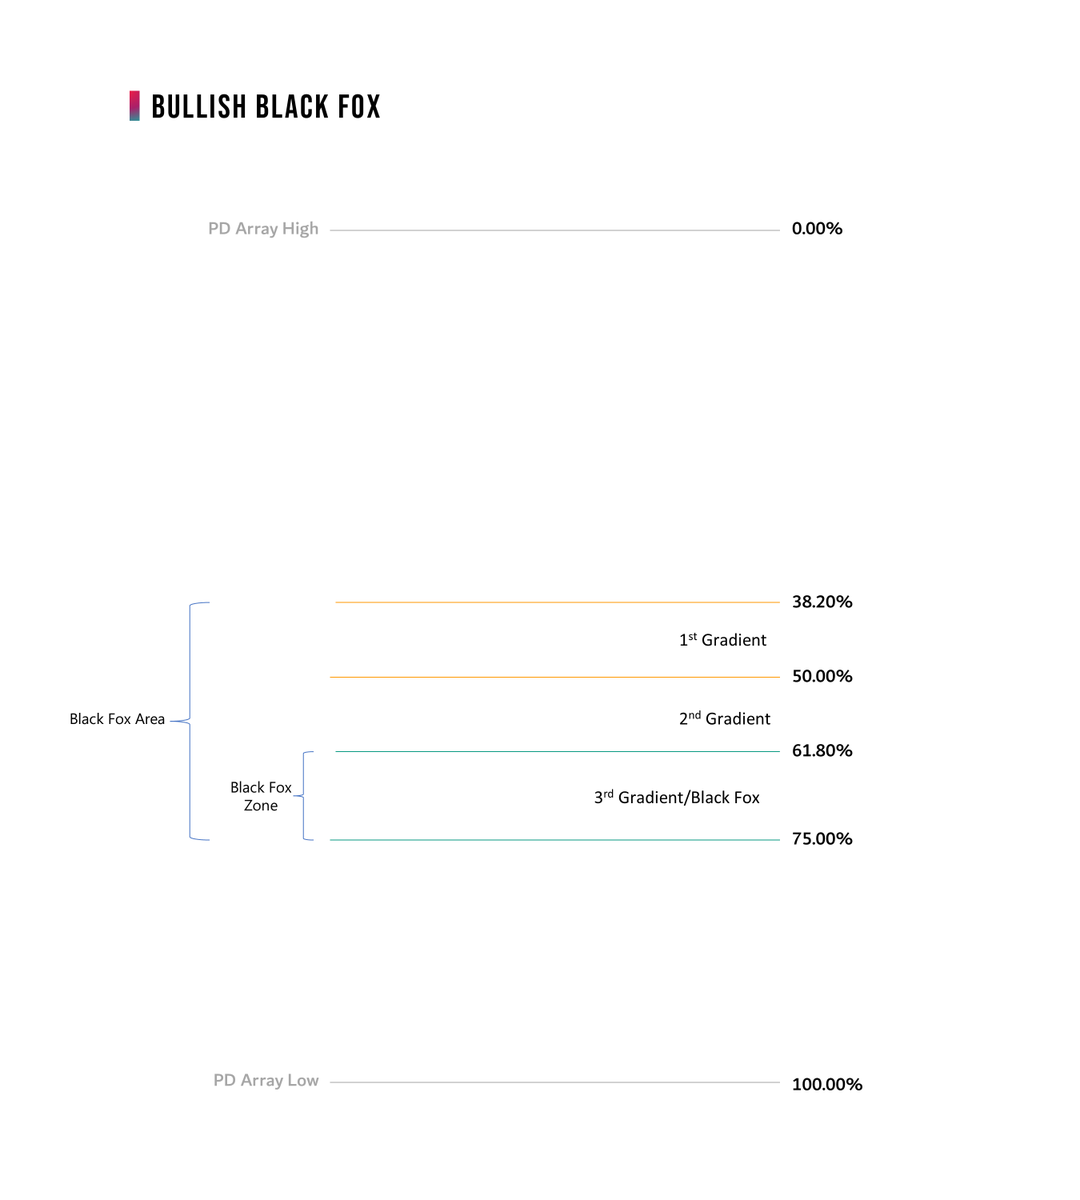
The Black Fox Range Model
Part II (Full Range Model)
No more analysis paralysis.
No more indicator overload.
Pure price action mastery.
The secret?
Previous Candle (PC) + Current Candle (CC) + Fibonacci🧵
Secret Sauce Revealed
The Black Fox Range Model
Part II (Full Range Model)
No more analysis paralysis.
No more indicator overload.
Pure price action mastery.
The secret?
Previous Candle (PC) + Current Candle (CC) + Fibonacci🧵

Defining Ranges:
I will first cover how long a range stays valid for
Below you have a chart. The Timeframes section tells you the timeframes we use in Black Fox and the section on the right date ranges tells you how long a Black Fox is valid for.
I will first cover how long a range stays valid for
Below you have a chart. The Timeframes section tells you the timeframes we use in Black Fox and the section on the right date ranges tells you how long a Black Fox is valid for.

Understanding The Logic:
The timeframes are specific to the type of trader you are. We go from the 12 Months all the way down to the 6H Chart.
As an Intraday trader which most of us are, the most important ranges will be the Weekly, Daily, and 6H Ranges.
The timeframes are specific to the type of trader you are. We go from the 12 Months all the way down to the 6H Chart.
As an Intraday trader which most of us are, the most important ranges will be the Weekly, Daily, and 6H Ranges.

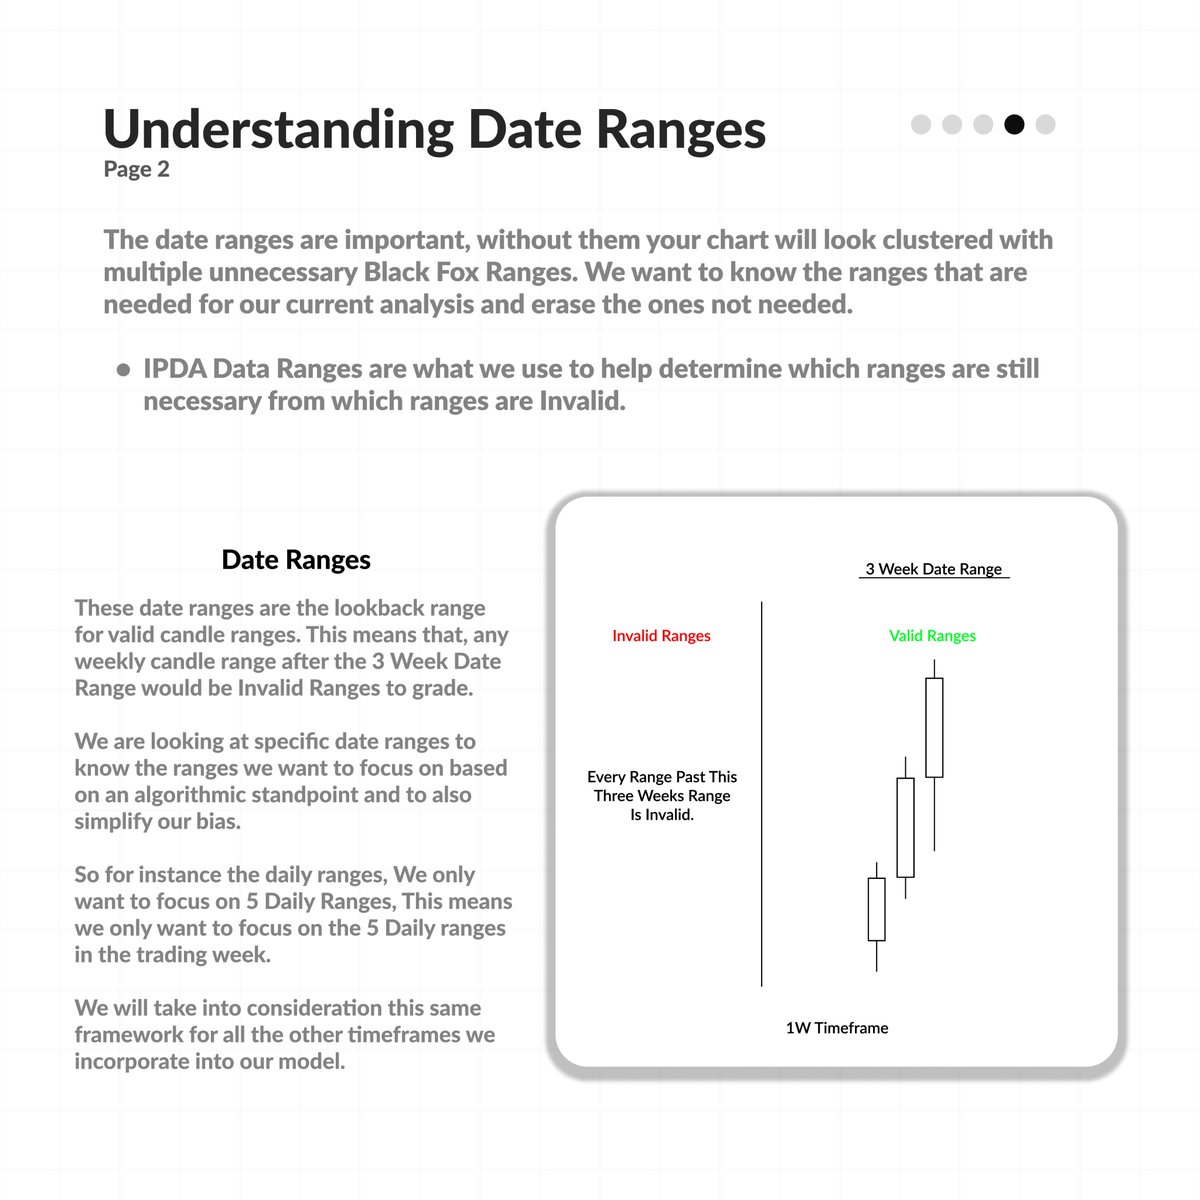
Understanding Date Ranges:
Below is an example of how we would use date ranges to Identify valid vs invalid ranges.
As you can see, We have a 3-week date range. Anything that is not the previous 3 weeks on the weekly chart is an invalid range for us.
Below is an example of how we would use date ranges to Identify valid vs invalid ranges.
As you can see, We have a 3-week date range. Anything that is not the previous 3 weeks on the weekly chart is an invalid range for us.
Full Model Outline:
1. HTF Range Black Fox (Weekly, Daily 6H)
2. SMT Divergence
3. LTF CISD/Inverse Entry
4. Stop Above/Below SMT Swing
5. Target 161.80% or 1.618
1. HTF Range Black Fox (Weekly, Daily 6H)
2. SMT Divergence
3. LTF CISD/Inverse Entry
4. Stop Above/Below SMT Swing
5. Target 161.80% or 1.618

Black Fox CISD:
This is an entry framework we will use for entries.
If you are looking for a bearish move after price traded into Bearish HTF Range and has Bearish SMT, then you would look to the left and the most recent range of opposing candles you grade them:
Low > High
This is an entry framework we will use for entries.
If you are looking for a bearish move after price traded into Bearish HTF Range and has Bearish SMT, then you would look to the left and the most recent range of opposing candles you grade them:
Low > High

Being that you are looking for a CISD, The range of candles you are waiting for the break above/below, should not have a Fair Value Gap.
If it's not a range and just one candle, it's the same procedure.
Wait for a close above/below 75.00%
That is your CISD
If it's not a range and just one candle, it's the same procedure.
Wait for a close above/below 75.00%
That is your CISD

Black Fox Inverse:
This is the 2nd entry framework we will use for entries.
If you are looking for a bearish move after price traded into Bearish HTF Range and has Bearish SMT, then you would look to the left and the most recent FVG, you grade it.
Grade: FVG Low > FVG High
This is the 2nd entry framework we will use for entries.
If you are looking for a bearish move after price traded into Bearish HTF Range and has Bearish SMT, then you would look to the left and the most recent FVG, you grade it.
Grade: FVG Low > FVG High

Being that you are looking for an Inverse, The candles you are waiting for the break above/below, should have a Fair Value Gap.
You grade that FVG if it's bullish from Low > High
If it's bearish from High > Low
Wait for a close above/below 75.00%
That is your Inverse
You grade that FVG if it's bullish from Low > High
If it's bearish from High > Low
Wait for a close above/below 75.00%
That is your Inverse

Understanding Entries:
Now that we know what a BF CISD and Inverse is, we can now do the full framework.
- HTF Bearish BF [1]
- SMT [2]
- BF CISD/Inverse Entry [4]
- Target 161.80 (1.618) [5]
That is the full model in a step-by-step format.
Now that we know what a BF CISD and Inverse is, we can now do the full framework.
- HTF Bearish BF [1]
- SMT [2]
- BF CISD/Inverse Entry [4]
- Target 161.80 (1.618) [5]
That is the full model in a step-by-step format.

The next part I will drop will incorporate a thread with examples of this model playing out.
I will also make a video about this model to make it easier to understand.
Ensure to Like and Share and be ready for part three. Comment "Part 3" If you are ready.
I will also make a video about this model to make it easier to understand.
Ensure to Like and Share and be ready for part three. Comment "Part 3" If you are ready.
• • •
Missing some Tweet in this thread? You can try to
force a refresh