
 Understanding Previous Day's Range:

 The daily chart is the first step in the Essence Model.
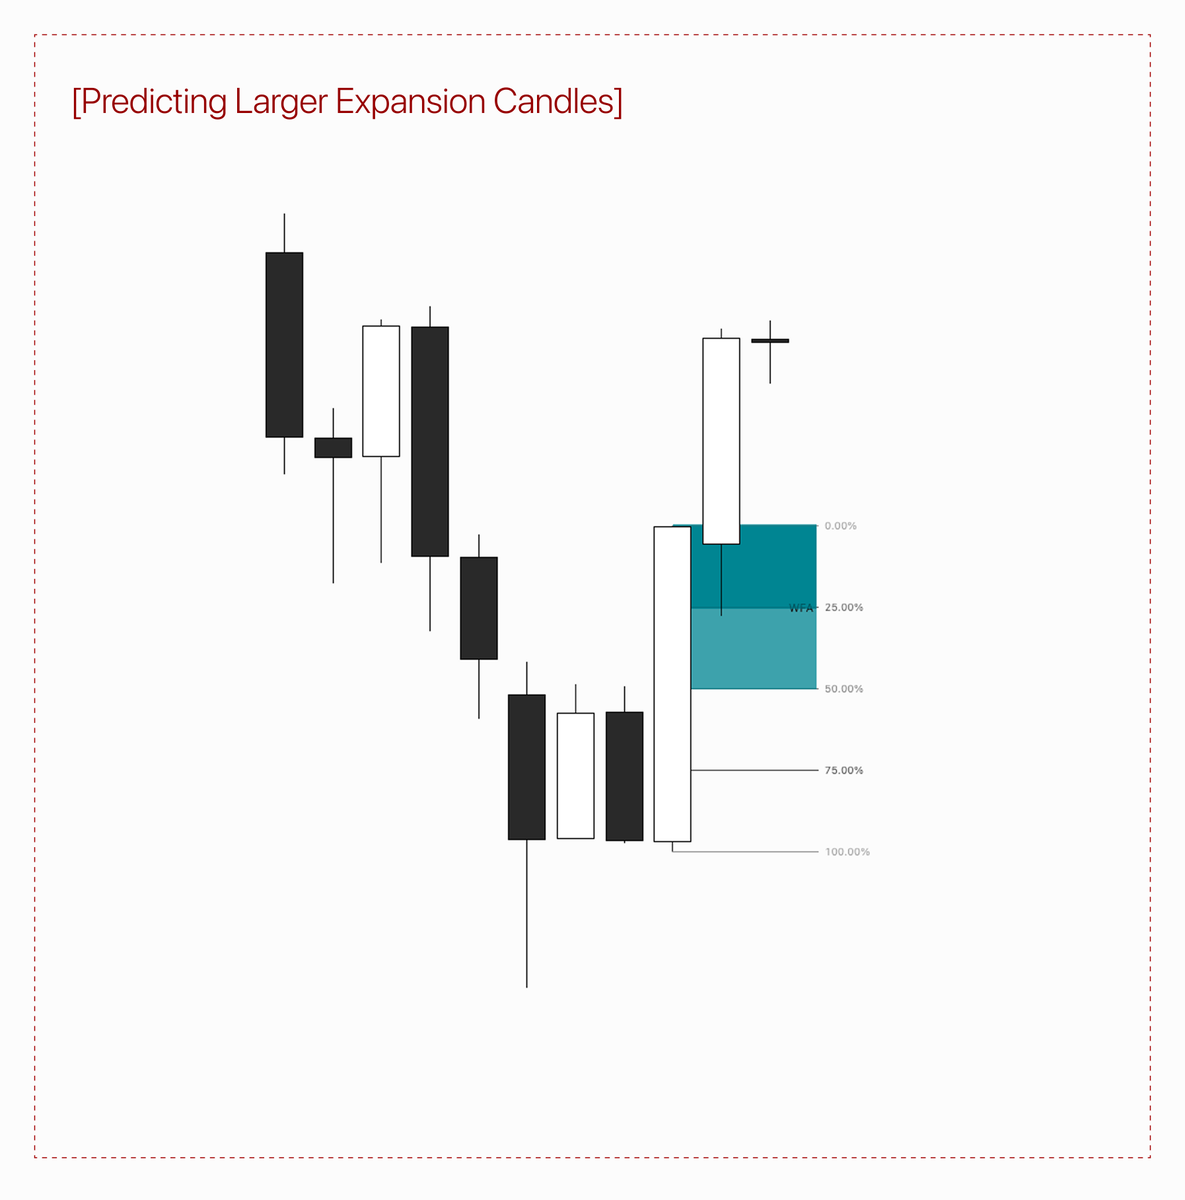 why is this important and how can we do this?
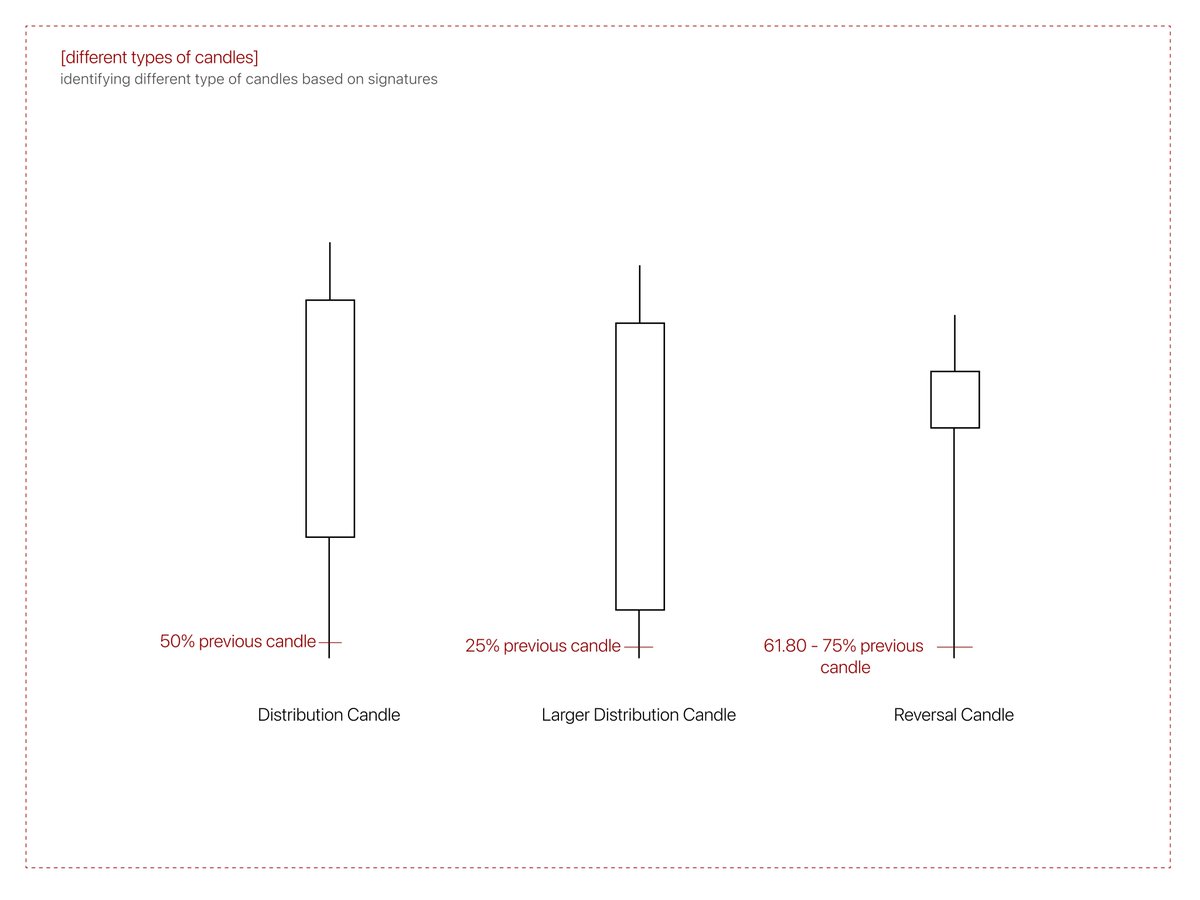
 the stages of the trading system:
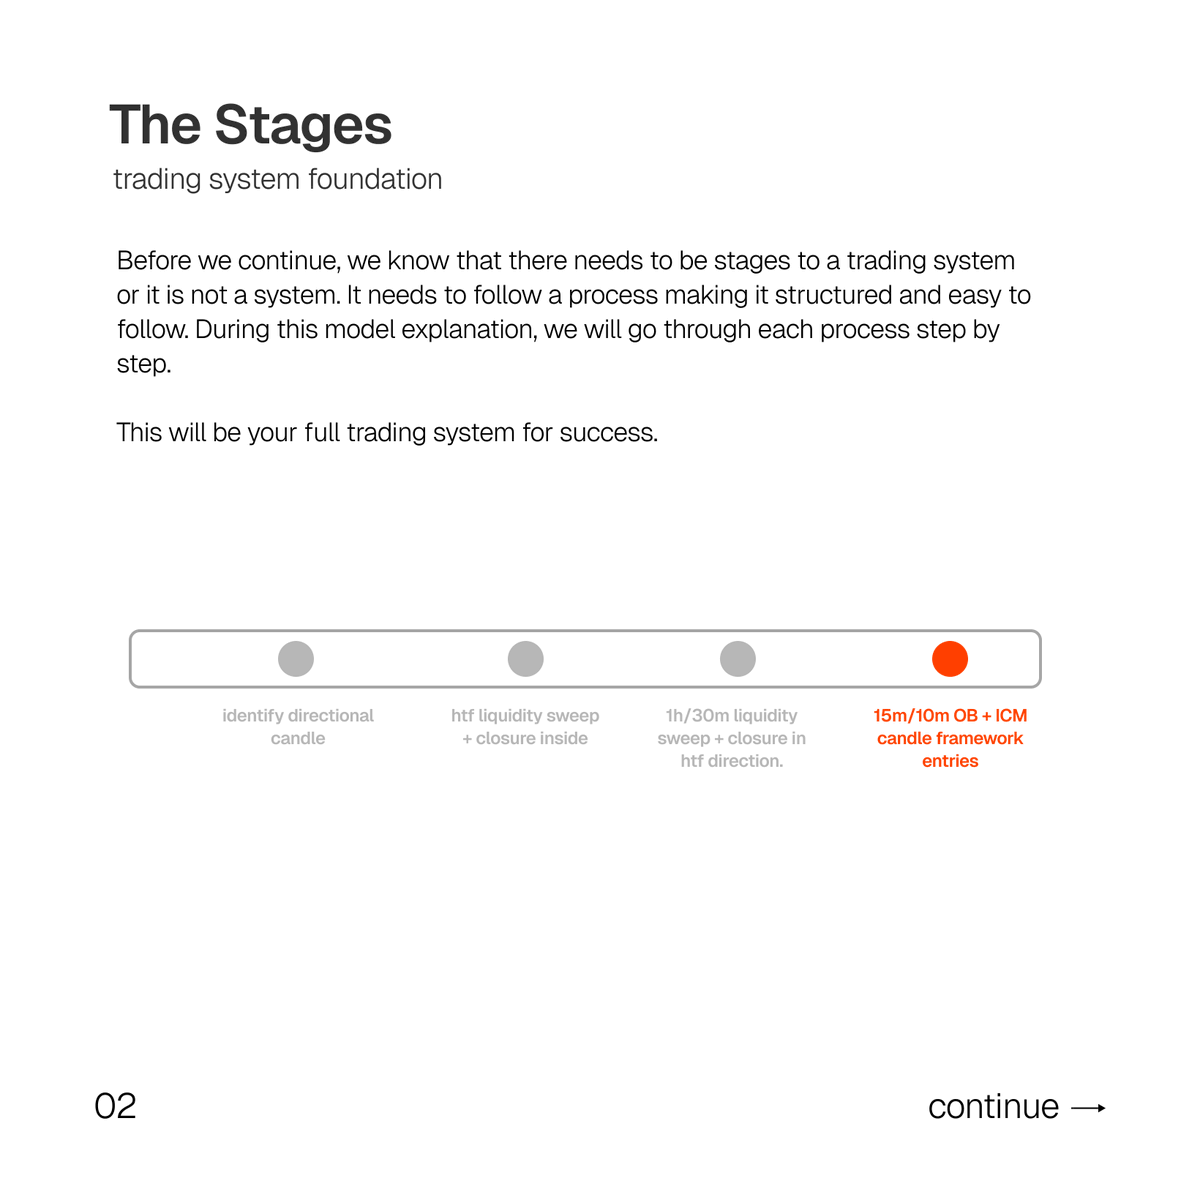
 Why is trading the correct asset so important and why it applies not only to ES and YM and NQ but also to other correlating assets.
 At first look on the 8h going into the 10AM candle, we can see that we had Low resistance liquidity lows.
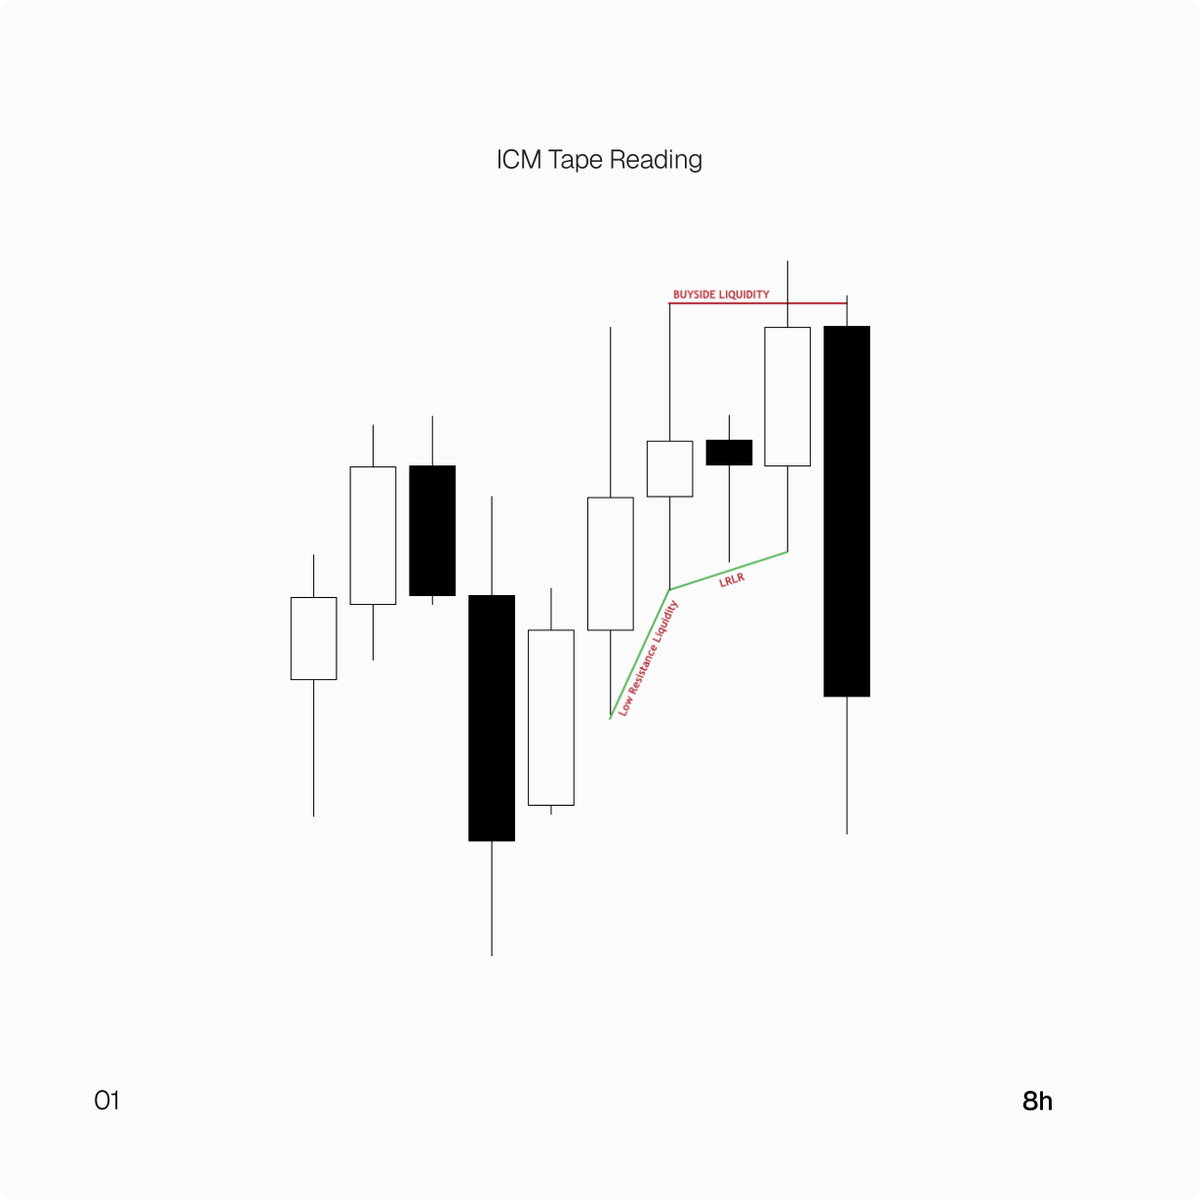
 On the NQ today, the first thing we had in mind on the 12H chart was that there was a large bearish candle.
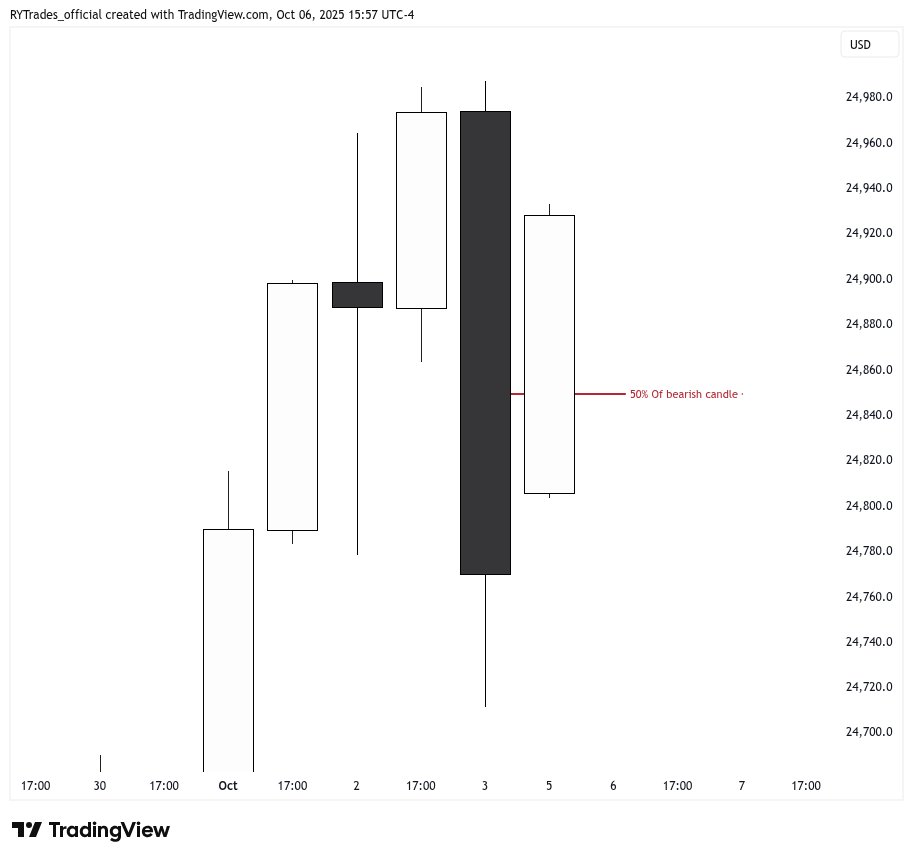
 8H Chart
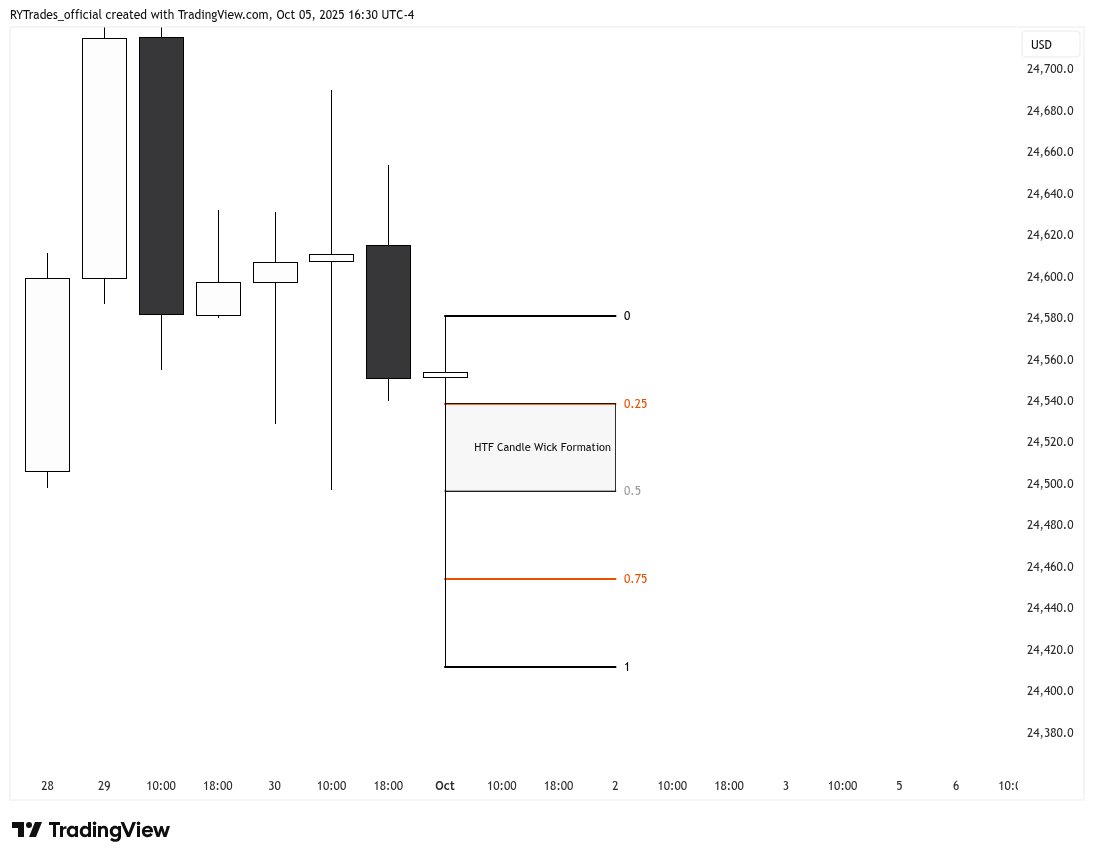
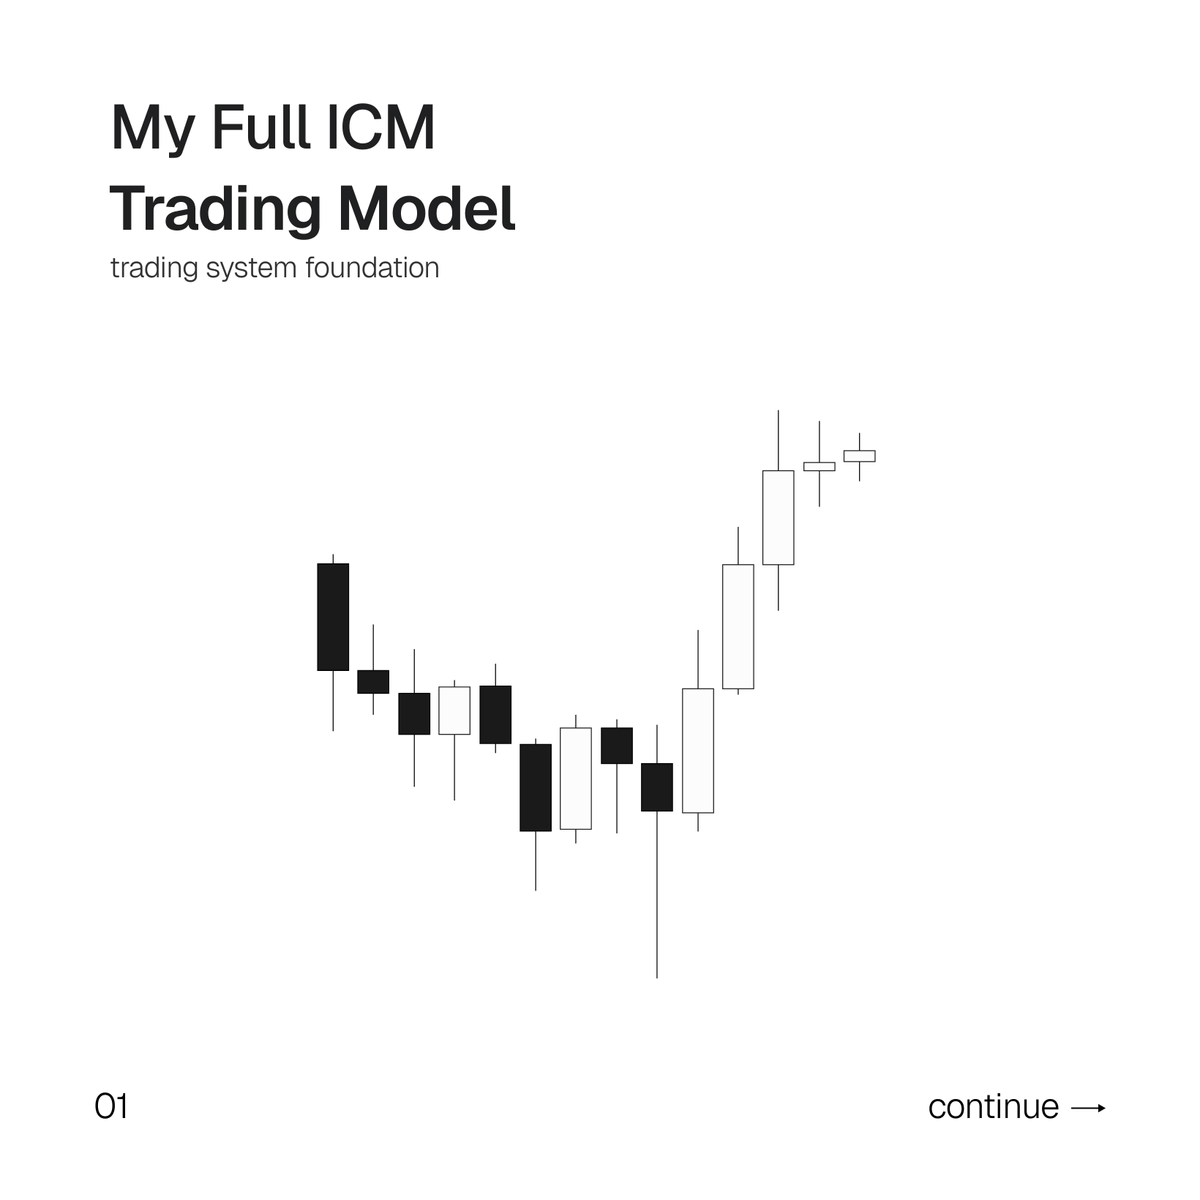
 What is ICM:
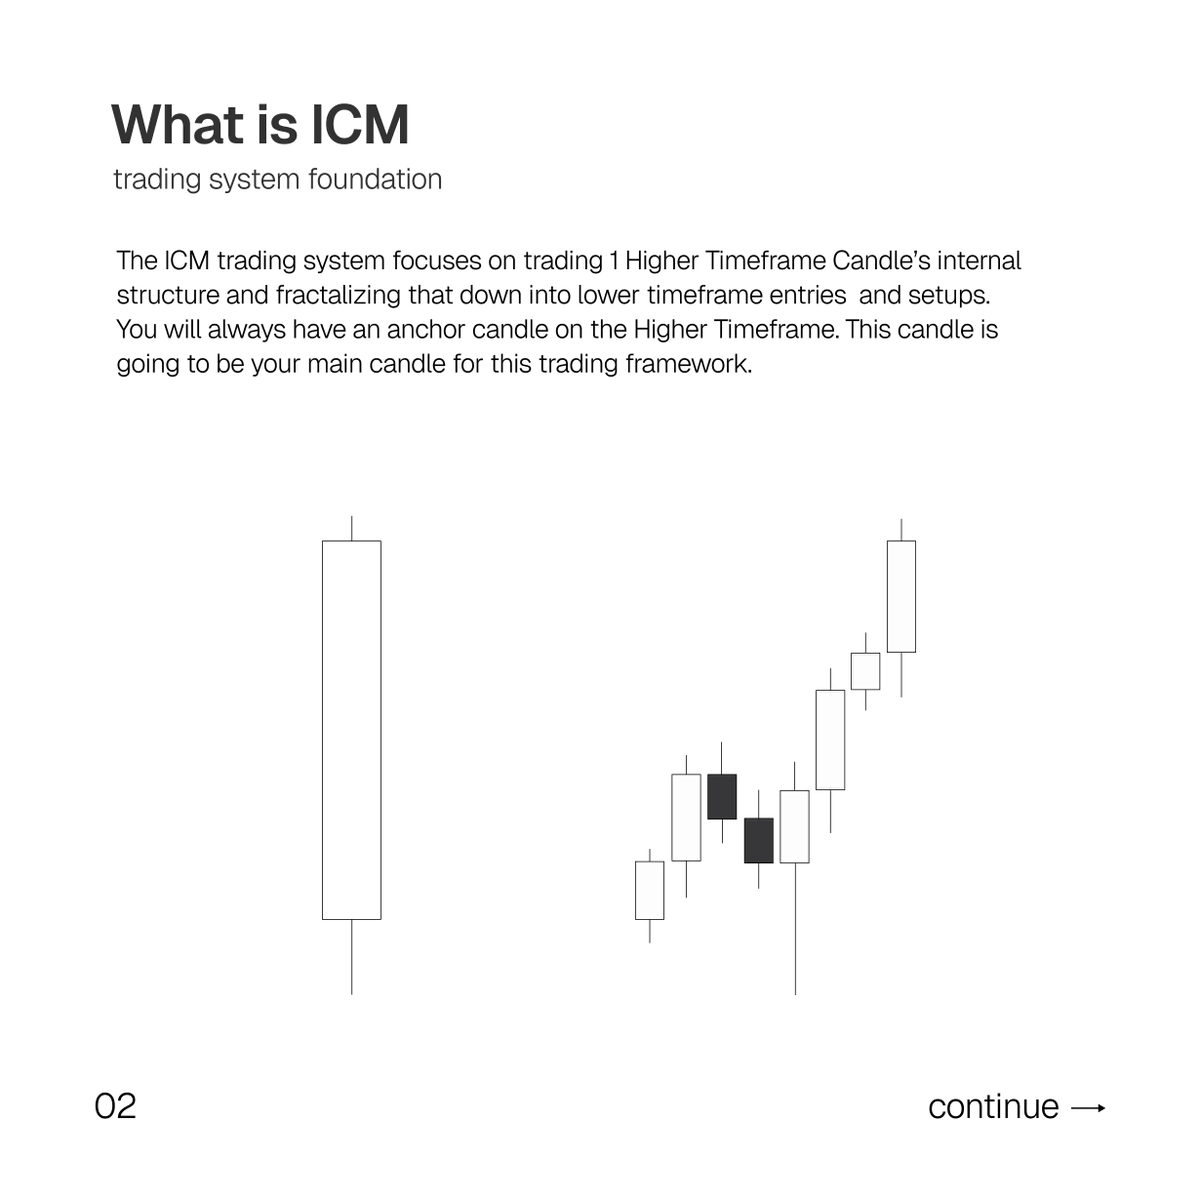
 Every HTF candle has natural retracement zones
 I first check the weekly chart and identify my potential direction for the week.
 The first post I made was a post indicating that the low of the week was most likely in and an expansion is in play to the upside.
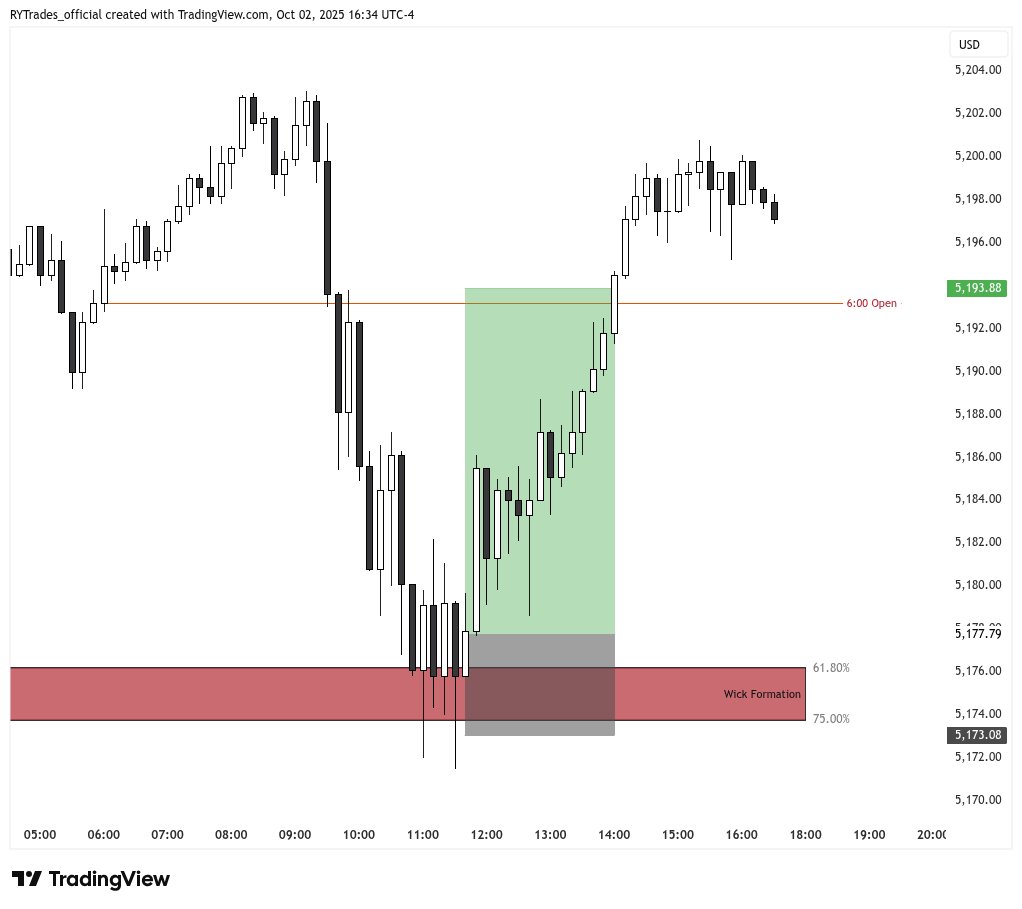
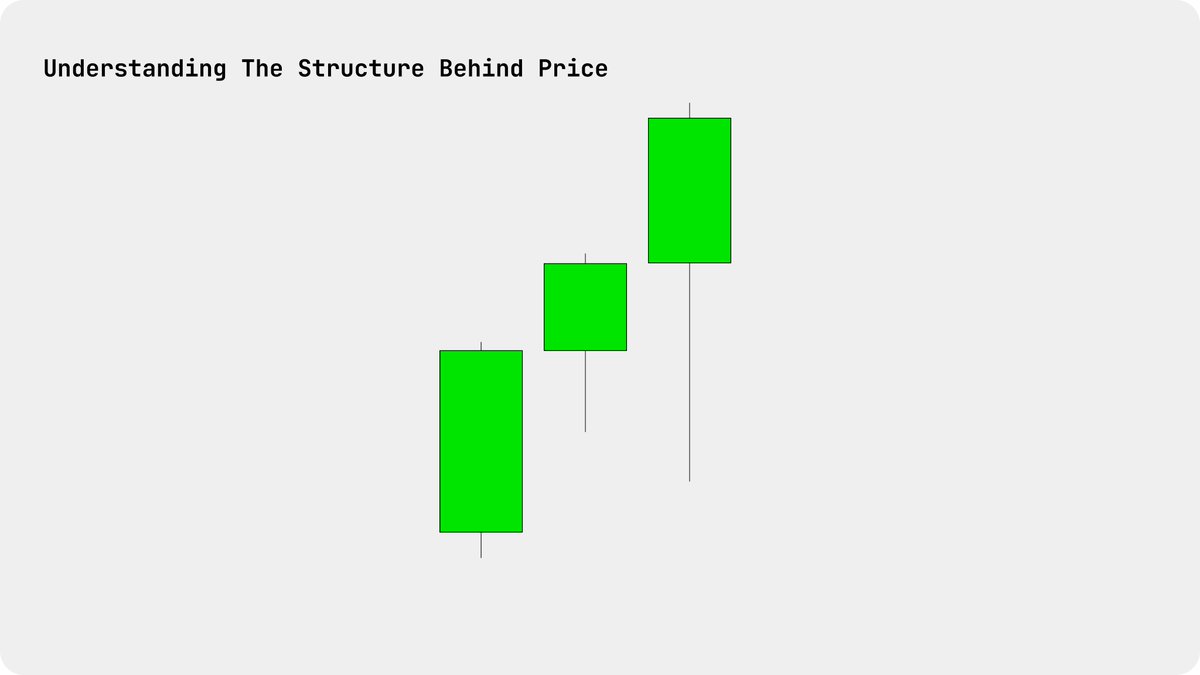 Using Ranges To Frame Expansions
 {Made the call in the Discord This morning}
 Defining Ranges:
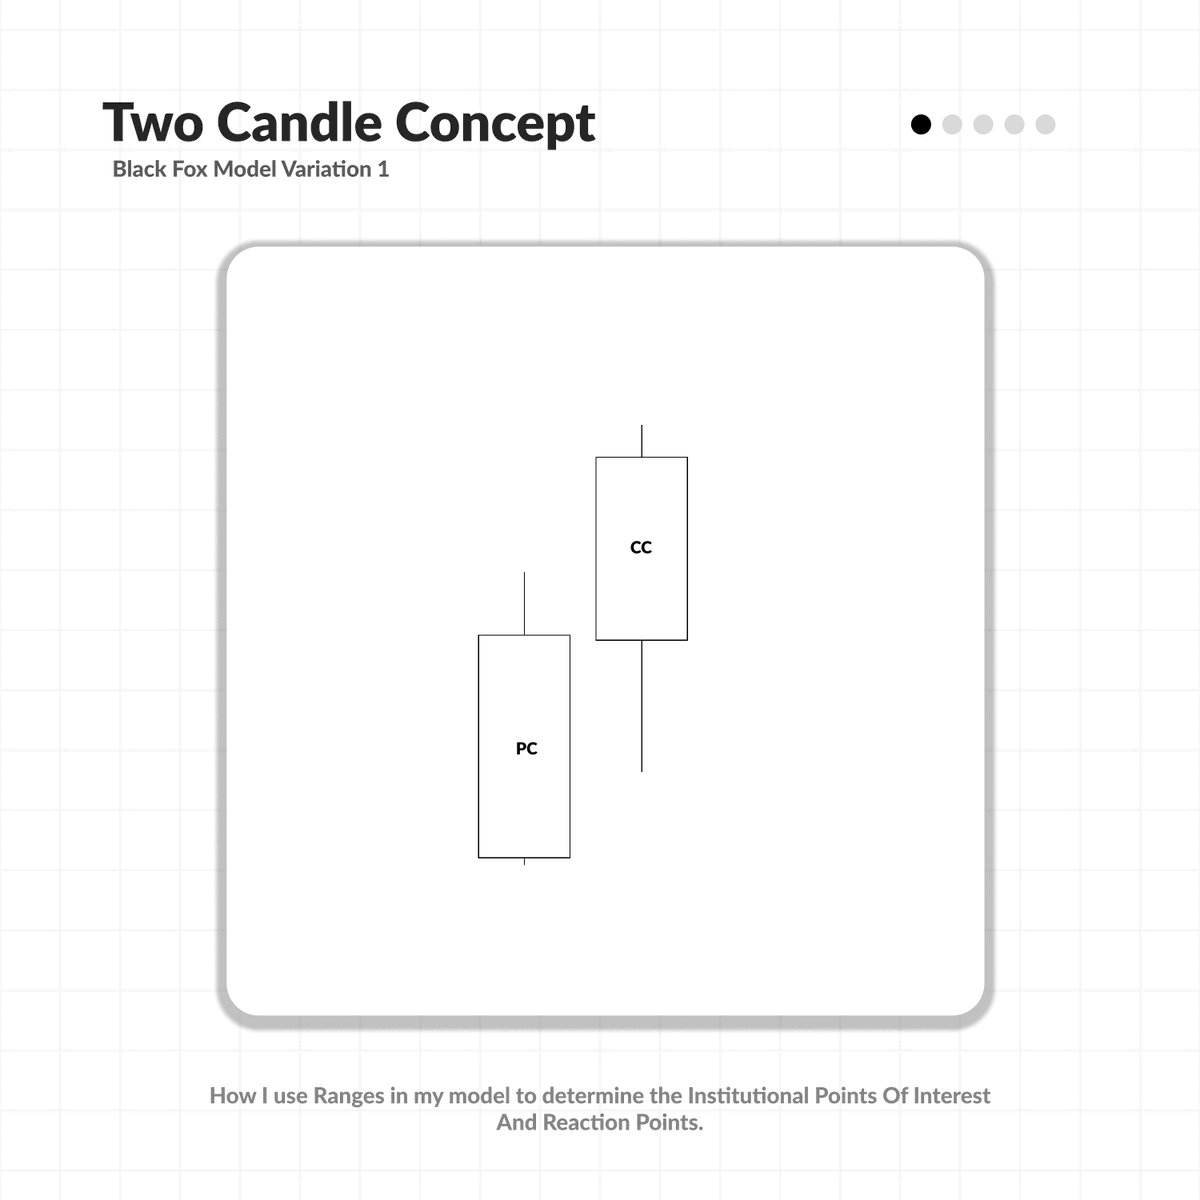 The first thing we need to know is what ranges are.
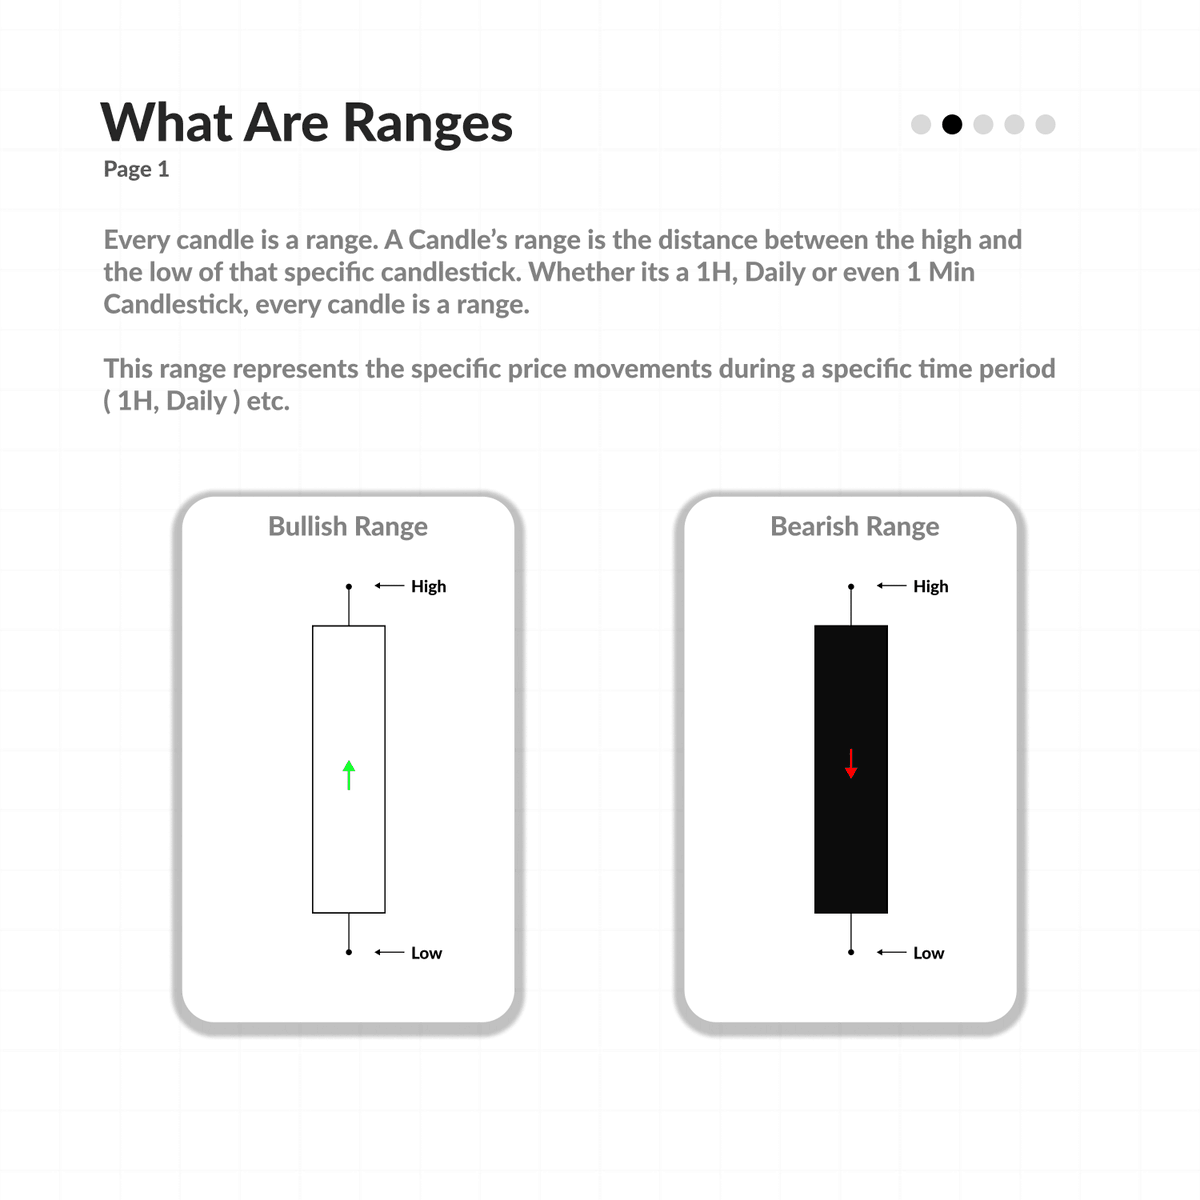

 Why Black Fox? Black Fox gives you a view inside the PD Arrays that you cannot see with your bare eyes.
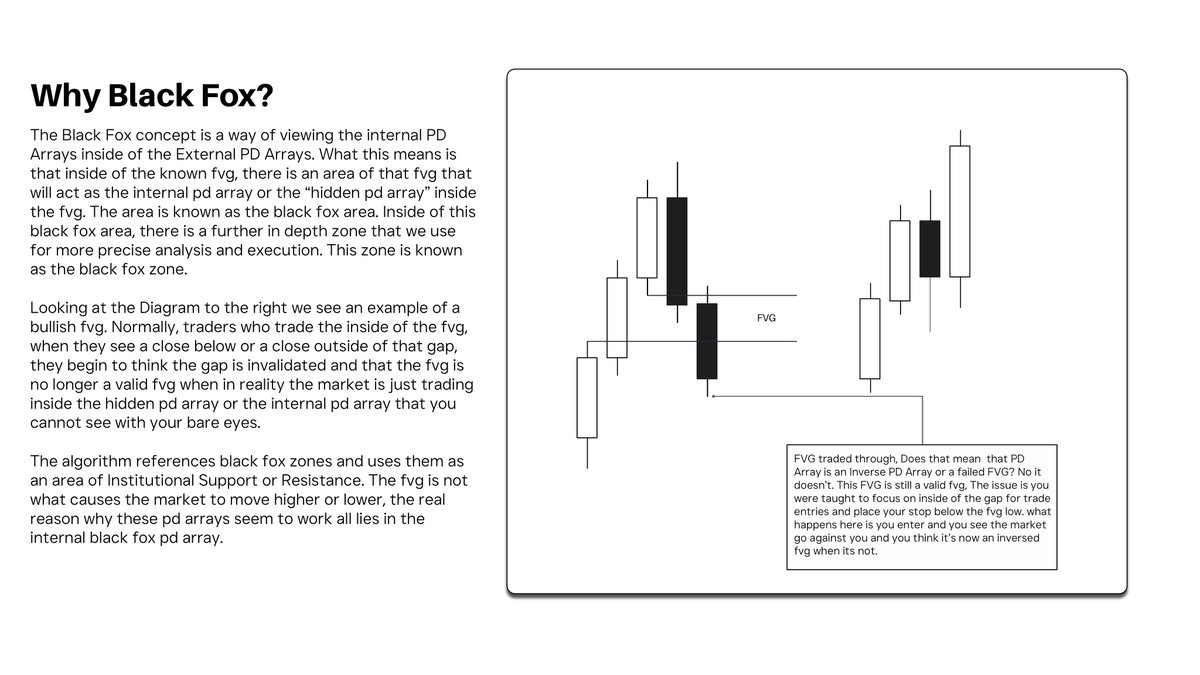
 I discovered this model in my constant search for the logic behind the points of interests that I was using in my trading.
 Time Windows For All Assets: