Smart Money concept Full course FREE
Part 1 : Fair Value Gap (FVG) : A Detailed Thread 🧵
Open this thread 👇to learn topic FVG which is part of Smart money concept course
Part 1 : Fair Value Gap (FVG) : A Detailed Thread 🧵
Open this thread 👇to learn topic FVG which is part of Smart money concept course
1️⃣ What is a Fair Value Gap (FVG)?
🔹 Definition: A Fair Value Gap (FVG) is an imbalance in price caused by aggressive buying or selling, leaving a gap in liquidity.
🔹 Why does it happen?
When institutions place large orders, price moves fast without filling all orders in between.
The market later retraces to "fill" these gaps before continuing its trend.
📌 Key Insight:
✅ If price is bullish, FVGs act as support.
✅ If price is bearish, FVGs act as resistance.

2. How to Identify a Fair Value Gap
To identify an FVG, follow these steps:
Step 1: Look for a Strong Move
Identify a strong bullish or bearish candle (e.g., a large engulfing candle or a candle with a long body and small wicks).
This candle should be followed by another candle that does not fully overlap the wicks of the previous candle.
Step 2: Define the FVG Area
For a Bullish FVG:
The FVG is the area between the high of the previous candle and the low of the next candle.
This gap represents a buying imbalance.
For a Bearish FVG:
The FVG is the area between the low of the previous candle and the high of the next candle.
This gap represents a selling imbalance.
Step 3: Mark the FVG on the Chart
Use horizontal lines or a rectangle tool to mark the FVG area on your chart.
This area acts as a zone of interest for potential trades.

3. How to Trade FVGs
Trading FVGs involves waiting for price to return to the gap and then entering a trade with confirmation. Here’s how to do it:
Entry
Wait for Price to Return to the FVG:
Once you identify an FVG, wait for price to return to this area.
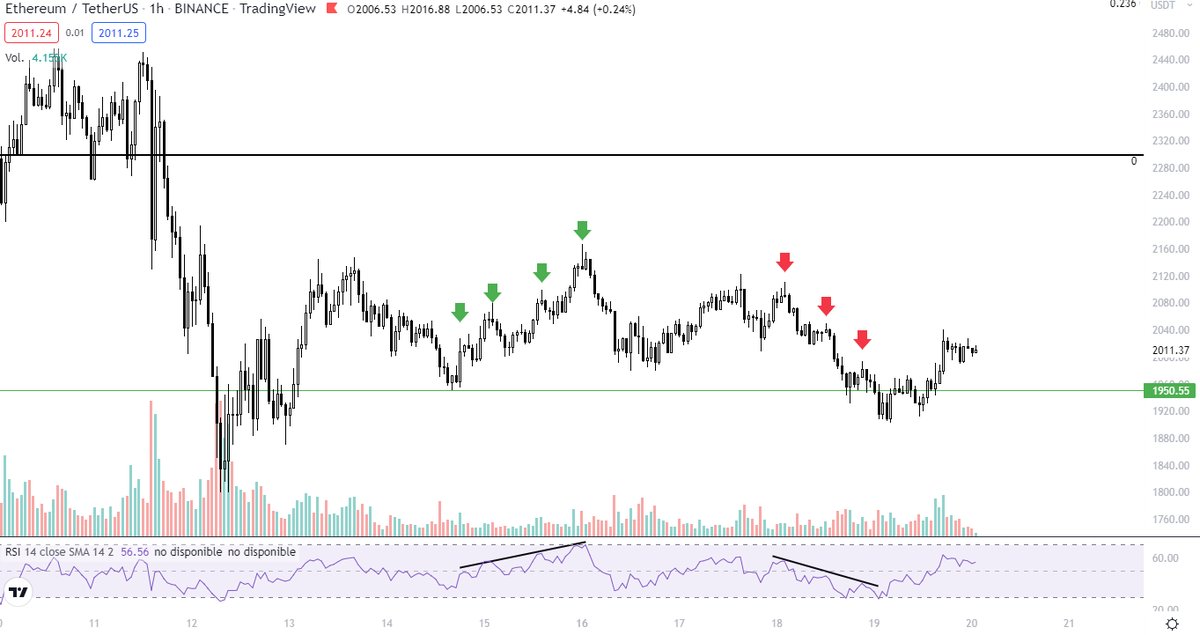
Look for Confirmation:
Use candlestick patterns (e.g., pin bars, engulfing candles) or other indicators (e.g., RSI, volume) to confirm the trade.
For a Bullish FVG, look for bullish reversal patterns.
For a Bearish FVG, look for bearish reversal patterns.
Stop Loss
Place your stop loss below the FVG for a buy trade or above the FVG for a sell trade.
This ensures you are protected if the trade goes against you.
Target
Take profit at the next key level or liquidity pool.
You can also use a risk-reward ratio (e.g., 1:2 or 1:3) to set your target.
Trading FVGs involves waiting for price to return to the gap and then entering a trade with confirmation. Here’s how to do it:
Entry
Wait for Price to Return to the FVG:
Once you identify an FVG, wait for price to return to this area.
Look for Confirmation:
Use candlestick patterns (e.g., pin bars, engulfing candles) or other indicators (e.g., RSI, volume) to confirm the trade.
For a Bullish FVG, look for bullish reversal patterns.
For a Bearish FVG, look for bearish reversal patterns.
Stop Loss
Place your stop loss below the FVG for a buy trade or above the FVG for a sell trade.
This ensures you are protected if the trade goes against you.
Target
Take profit at the next key level or liquidity pool.
You can also use a risk-reward ratio (e.g., 1:2 or 1:3) to set your target.

4️⃣ Stock Selection for FVG Trading
💡 How to Find the Best Stocks for FVG Trading?
📌 Criteria :
✅ High volume stocks (institutions trade here)
✅ Stocks with strong trend movements
✅ Look for FVGs on higher timeframes (1H, 4H, Daily) for accuracy
📊 Best Sectors for FVG Trading:
Banking Stocks (HDFC Bank, ICICI Bank, SBI)
Tech Stocks (TCS, Infosys, Wipro)
Energy Stocks (Reliance, Adani Green)
🚀 Use a stock screener to filter stocks with large momentum candles.

Example of Trading with FVG
Stock: Reliance Industries
FVG found on 1H chart at ₹2600 – ₹2620
Price later retraced into this zone
📌 Trade Setup:
1️⃣ Entry: Buy at ₹2610 when price enters the FVG and shows bullish confirmation.
2️⃣ Stop Loss (SL): Below the FVG at ₹2595 (Risk = ₹15).
3️⃣ Target: Previous high at ₹2650 (Reward = ₹40).
🛠 Risk-Reward Ratio :
RR=Risk/Reward=40/15=2.67
🎯 Potential Gain: 2.67x Risk!
6. Advanced Tips for Trading FVGs
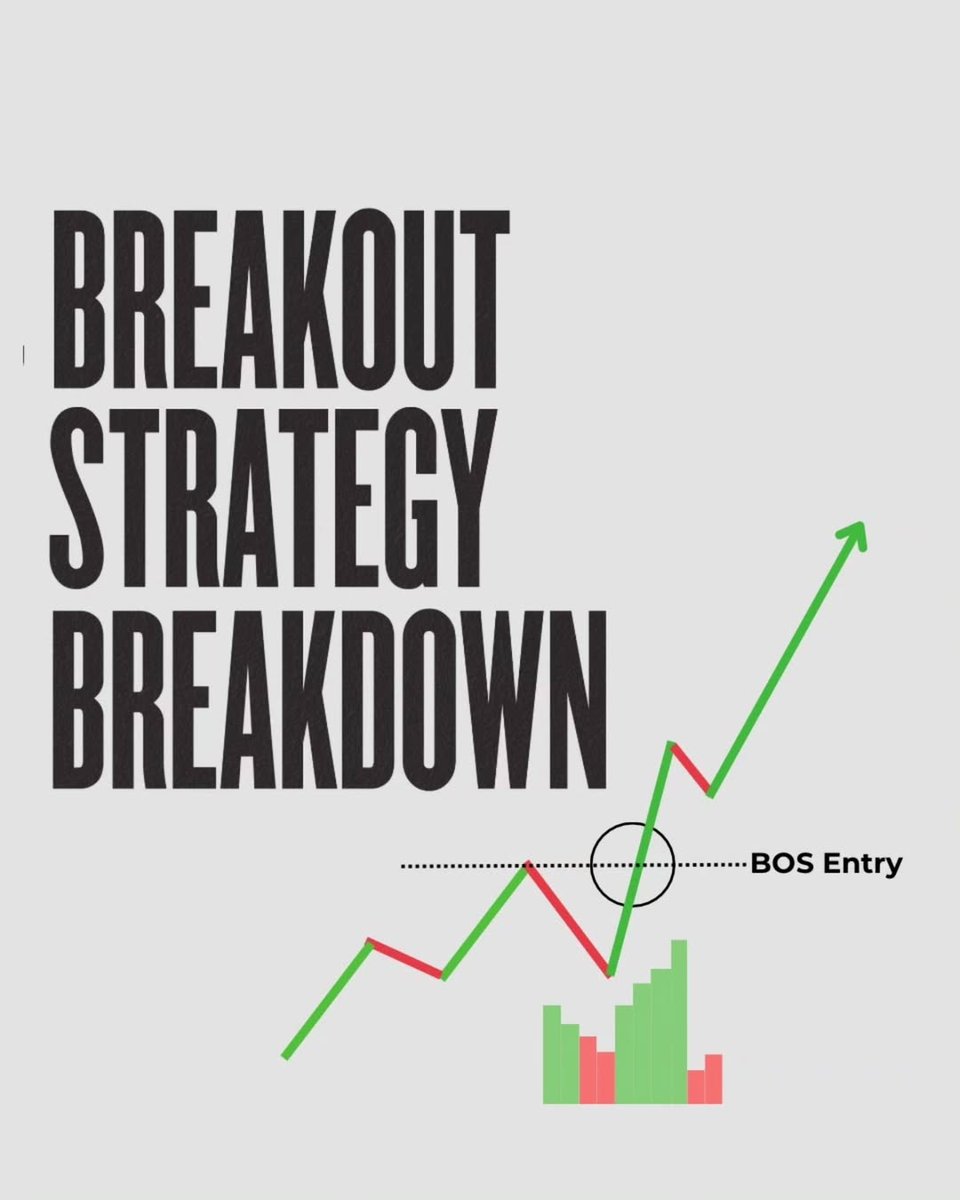
Combine with Market Structure:
Use FVGs in conjunction with market structure (e.g., higher highs, lower lows) to increase accuracy.
Look for Confluences:
Combine FVGs with other key levels like support/resistance, trendlines, or Fibonacci retracements.
Timeframe Selection:
Use higher timeframes (e.g., 1H, 4H, Daily) for more reliable FVGs.
Avoid Overcrowded Gaps:
If multiple FVGs are clustered in one area, the market may not respect each gap individually.

7. Common Mistakes to Avoid
Trading Every FVG:
Not all FVGs are valid. Wait for confirmation before entering a trade.
Ignoring Market Context:
FVGs work best in trending markets. Avoid trading FVGs in choppy or sideways markets.
Poor Risk Management:
Always use stop losses and proper position sizing to protect your capital.
Trading Every FVG:
Not all FVGs are valid. Wait for confirmation before entering a trade.
Ignoring Market Context:
FVGs work best in trending markets. Avoid trading FVGs in choppy or sideways markets.
Poor Risk Management:
Always use stop losses and proper position sizing to protect your capital.

• • •
Missing some Tweet in this thread? You can try to
force a refresh