
Trader | Investor | Scalper in stocks and Nifty sensex
SEBI Registered ❌
Paid Course ❌
All tweets are for educational purposes 💚
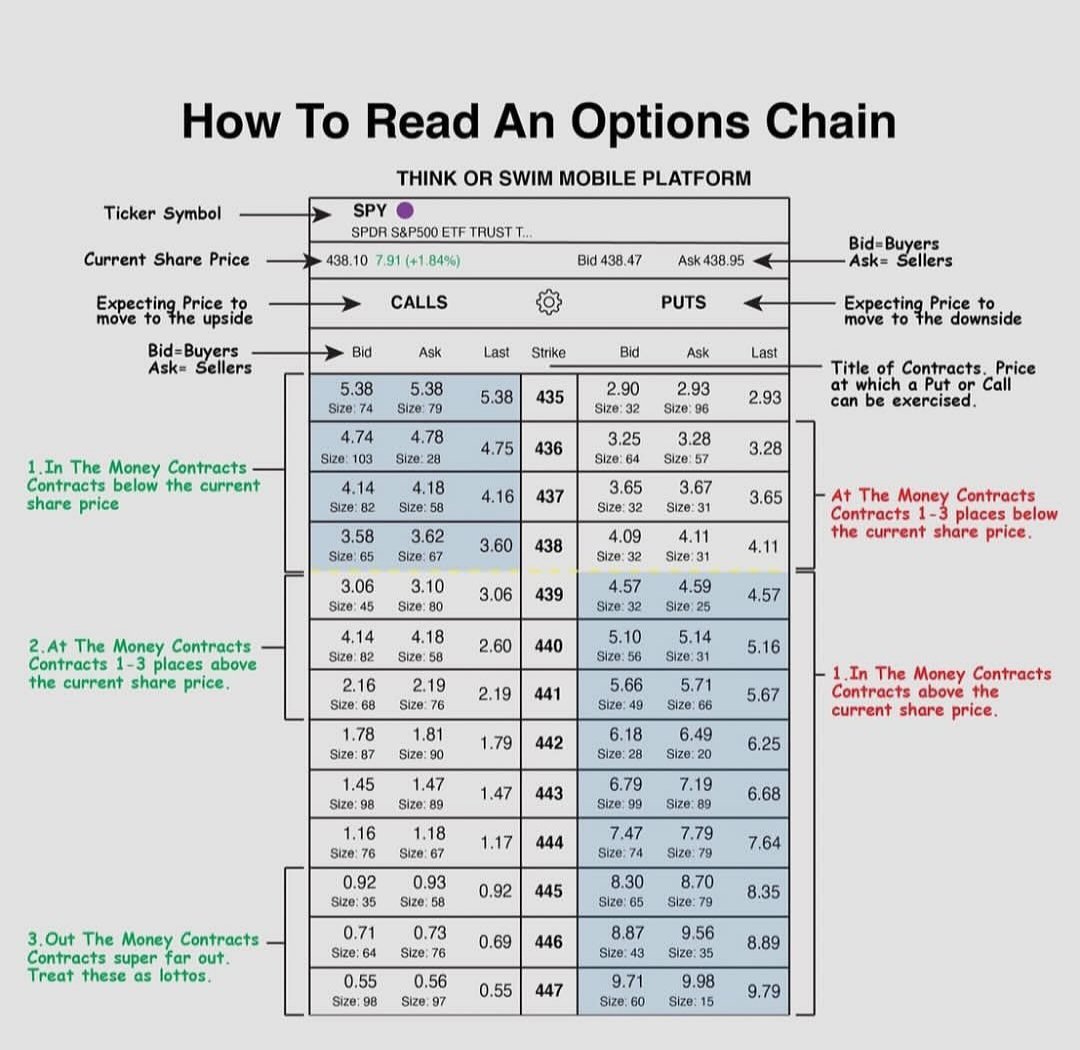
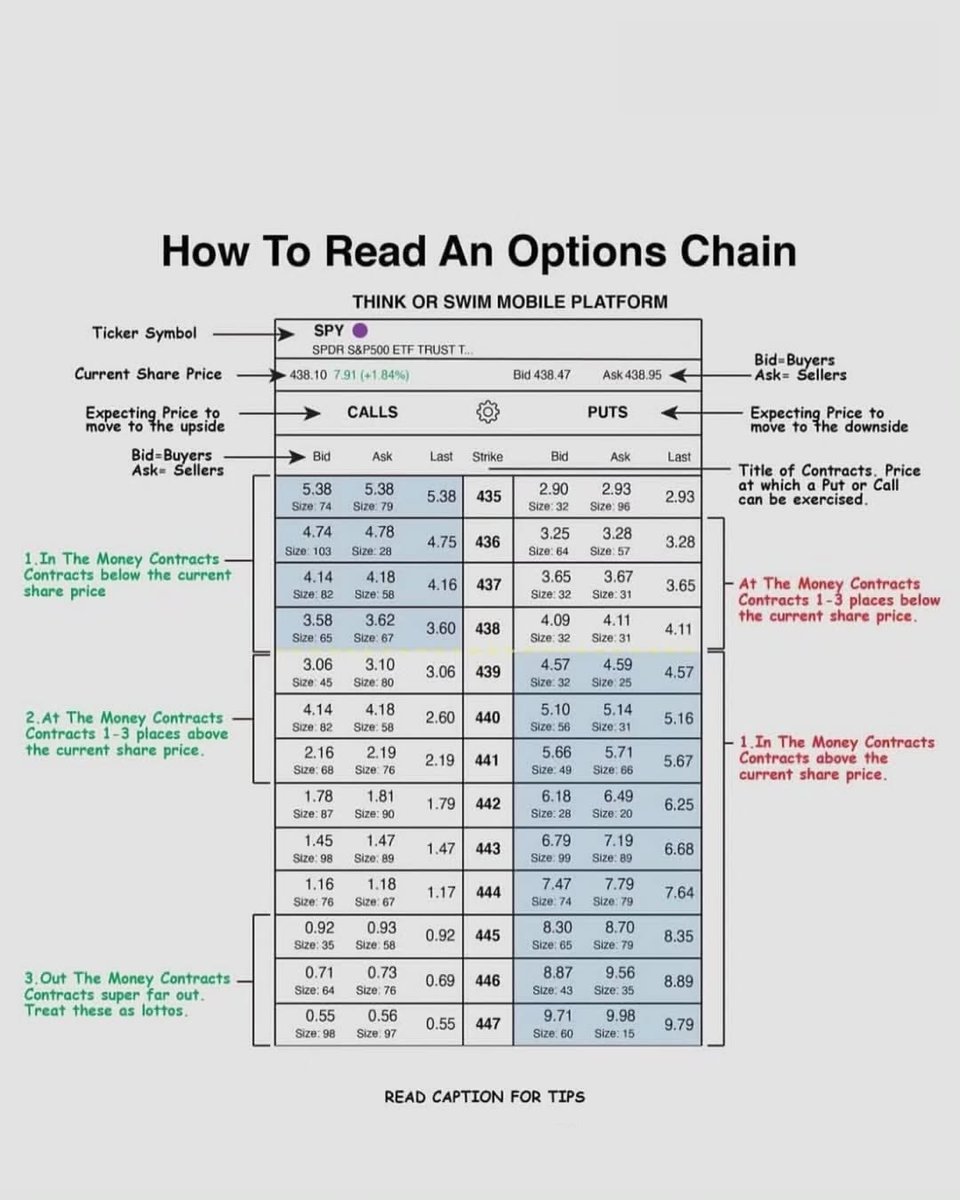 At the money contracts in Nifty Sensex options
 1) Audio tool
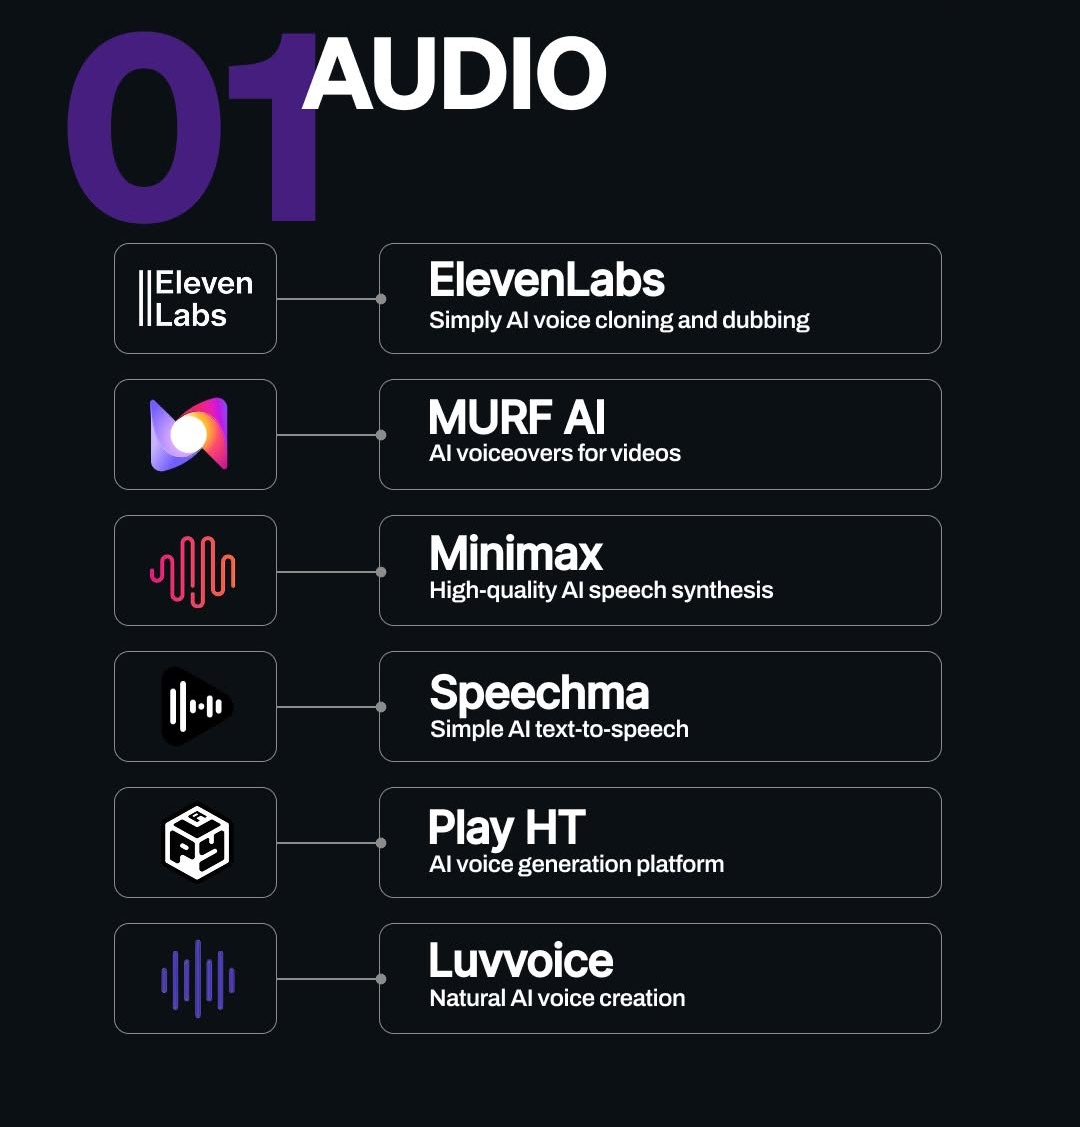
 Wife's name can reduce cost quietly
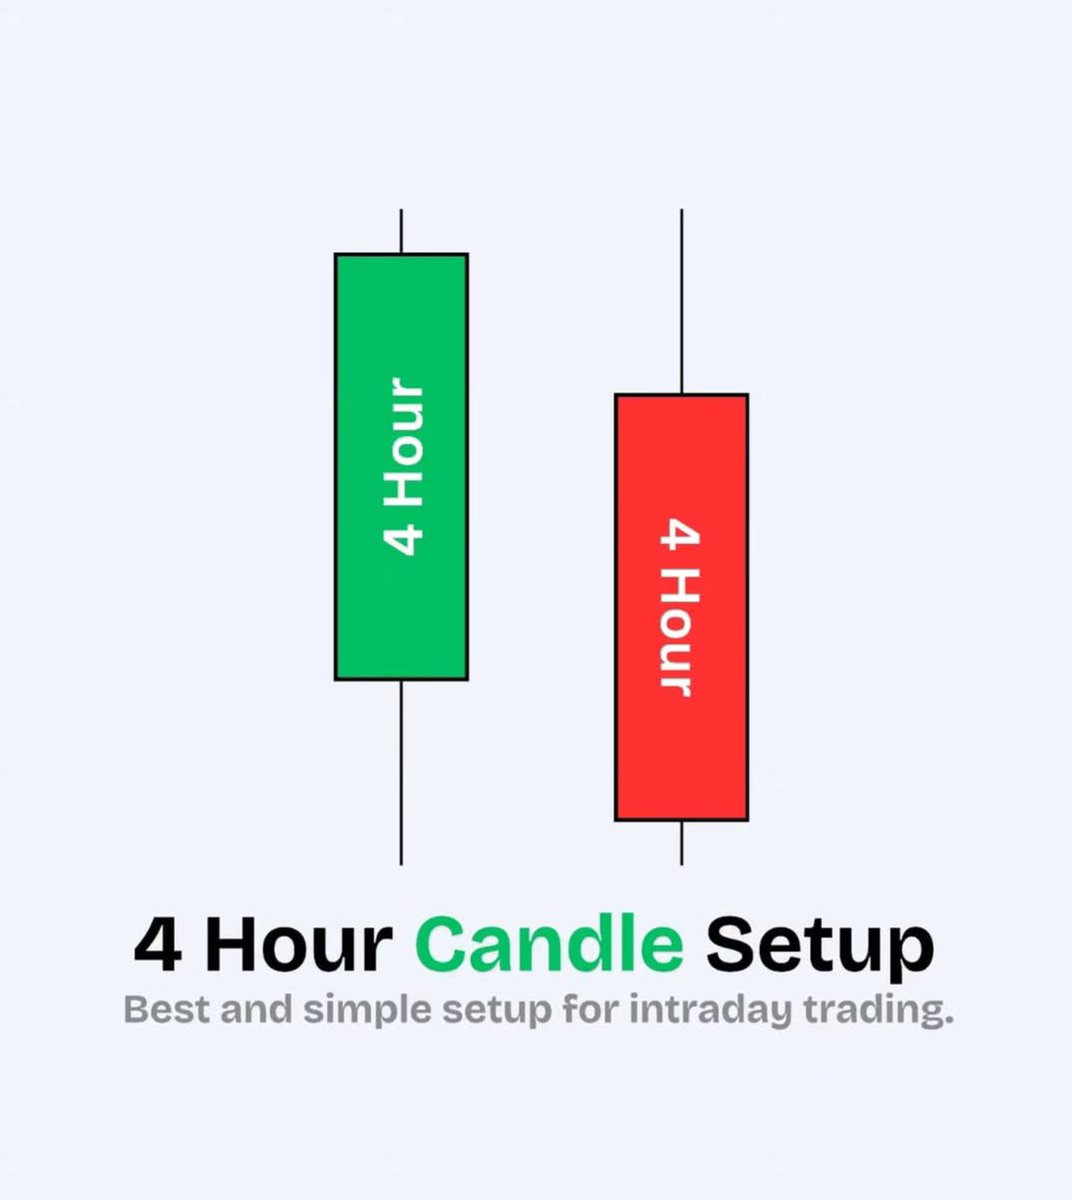 First find a green 4 hour candle and mark its low and High
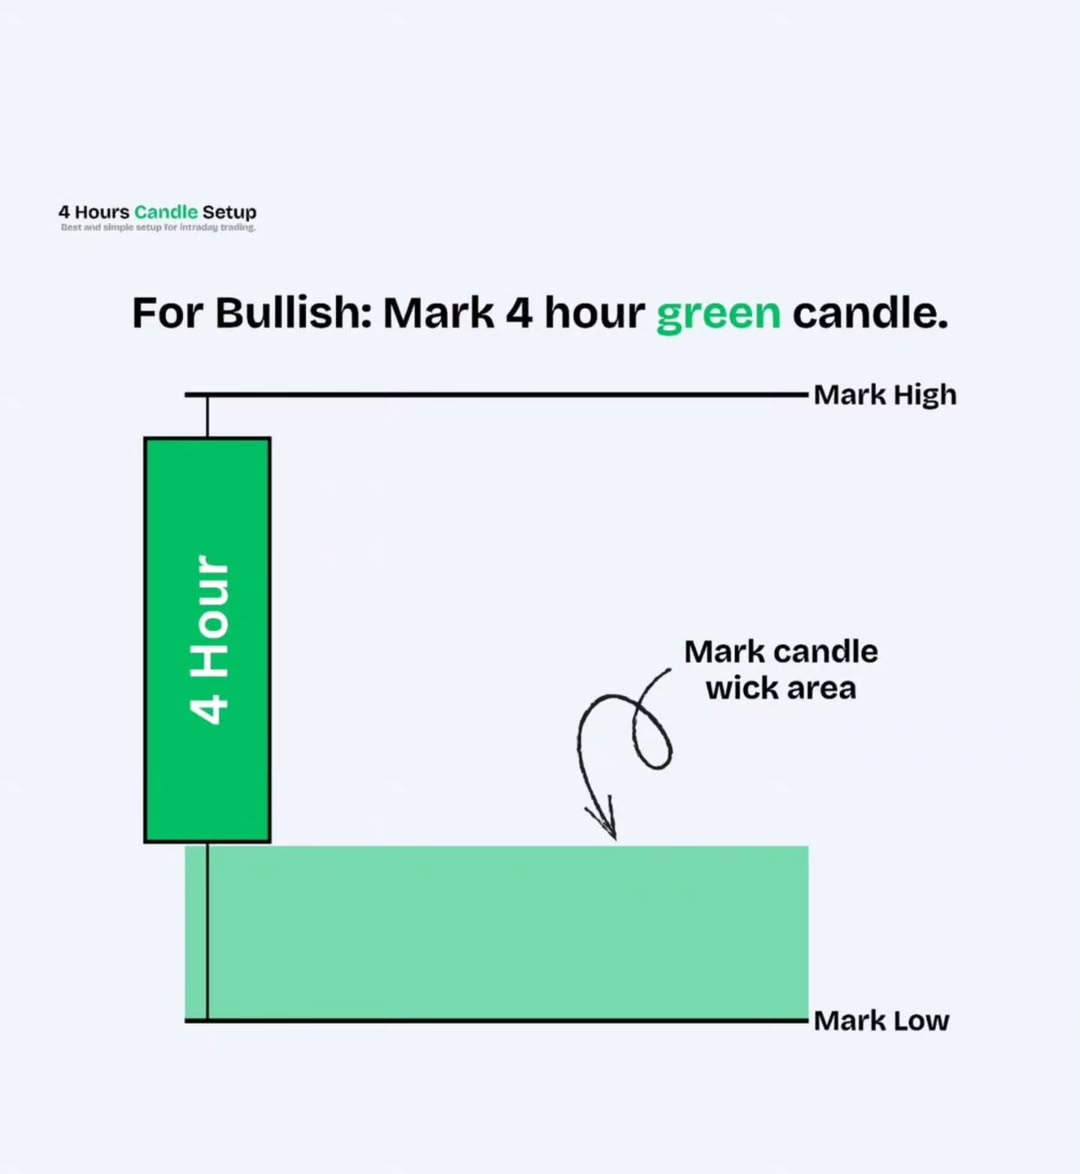
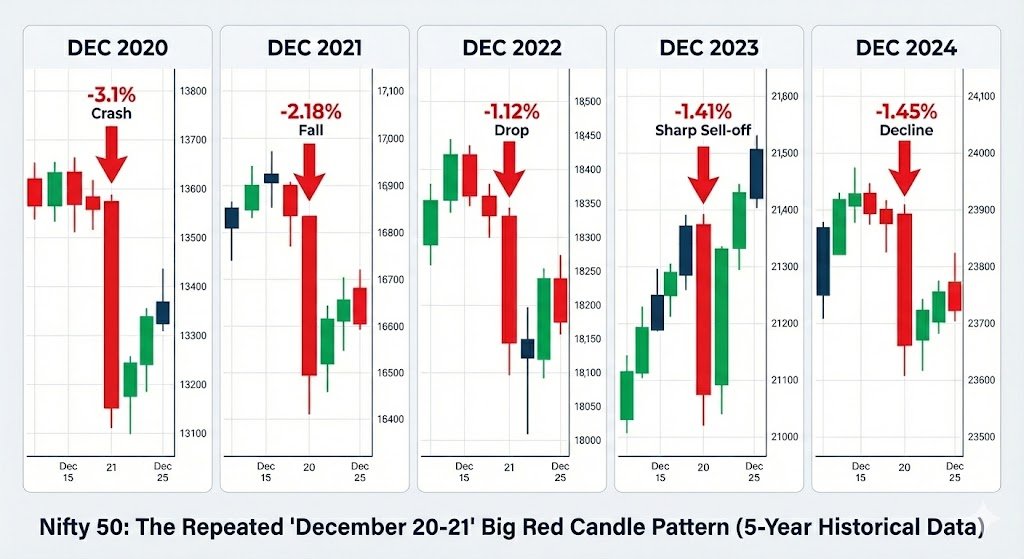 December 21, 2020:
 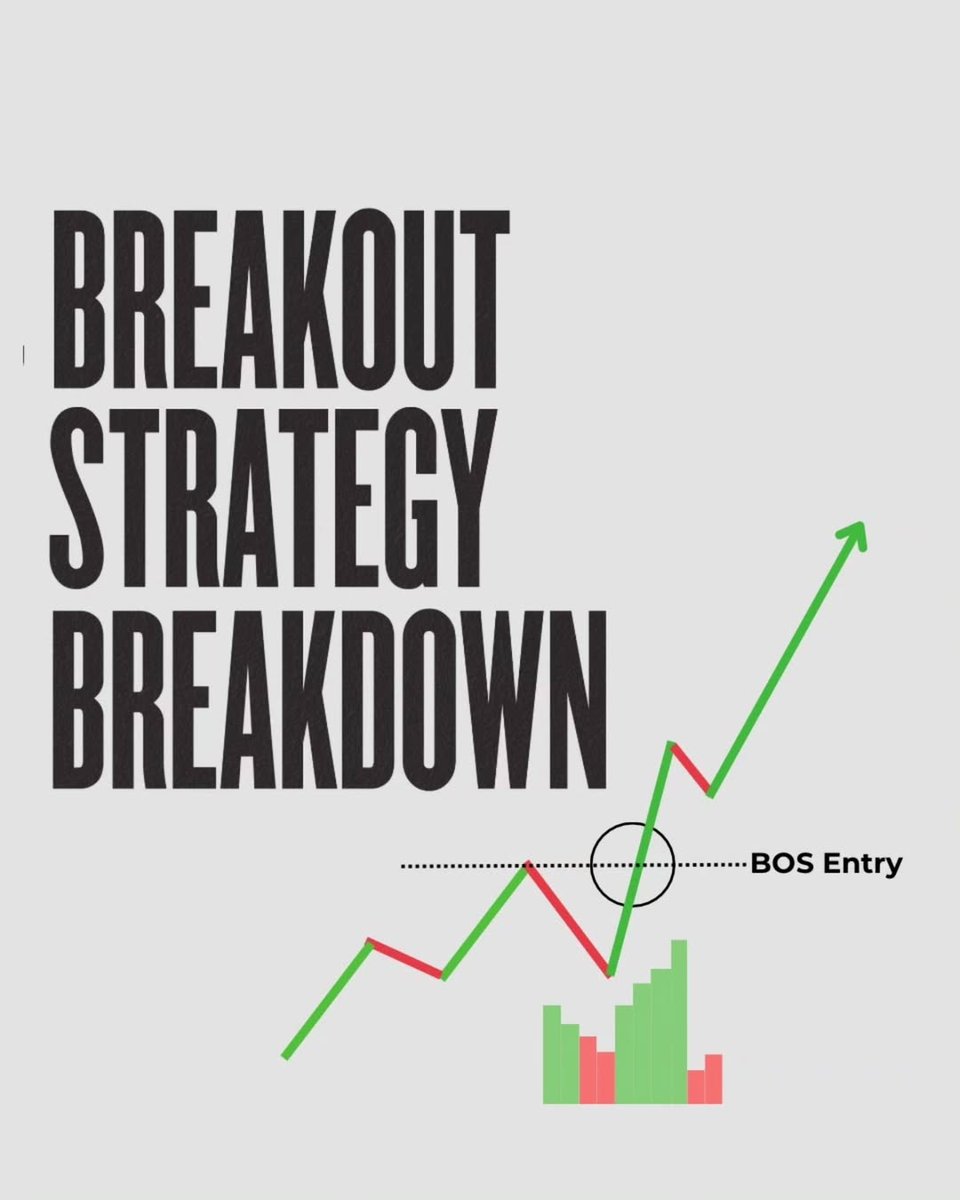 Break of structure understanding in uptrend or downtrend
 In the money (ITM) contract in the option chain. How in the money contract helps in the option chain.
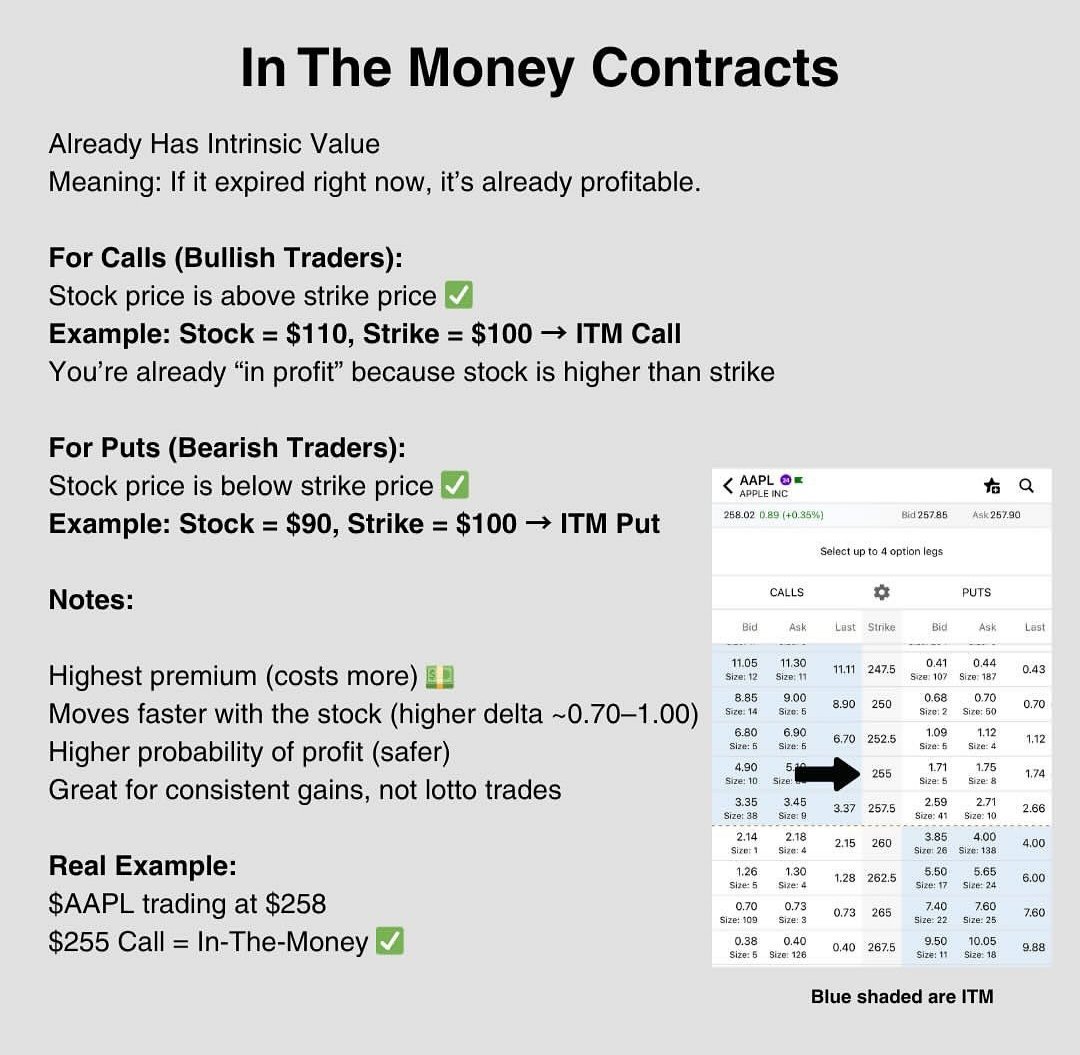
 Why trading psychology matters in the stock market trading
 What's A Reversal?
 QM shadow Bullish and bearish Patterns.
 Watch for Stop loss clusters in the stock market.
 In the money contract in the option chain. How in the money contract helps in the option chain.


