beowulf888 Profile picture
Feb 11 11 tweets 5 min read Read on X
6-1/ My COVID update for epidemiological weeks 5-6 of 2025.

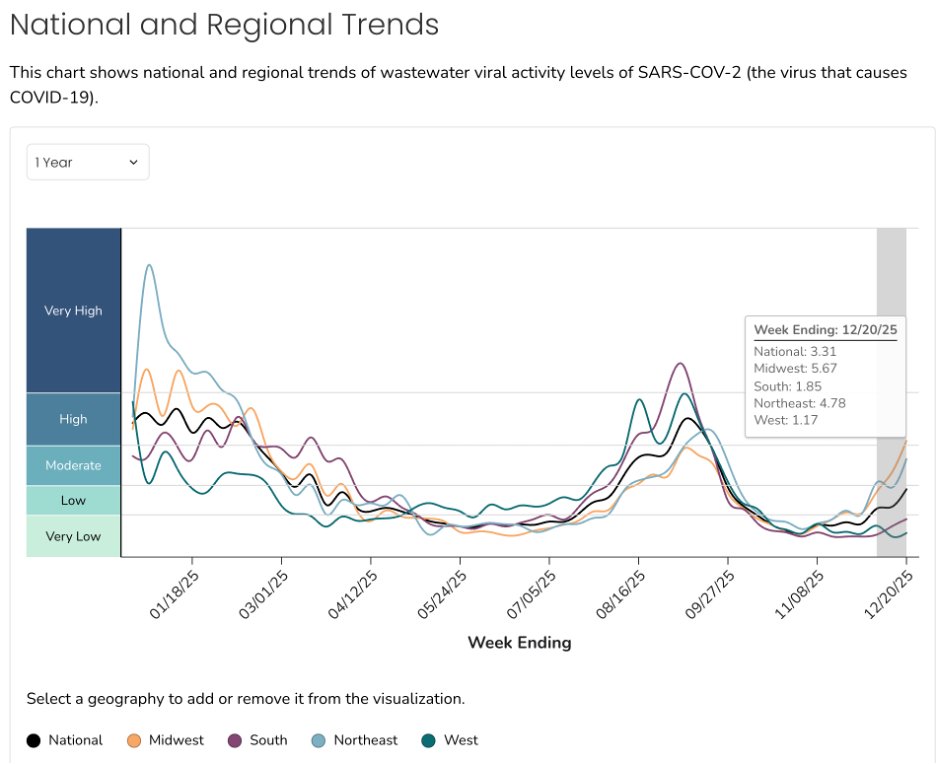
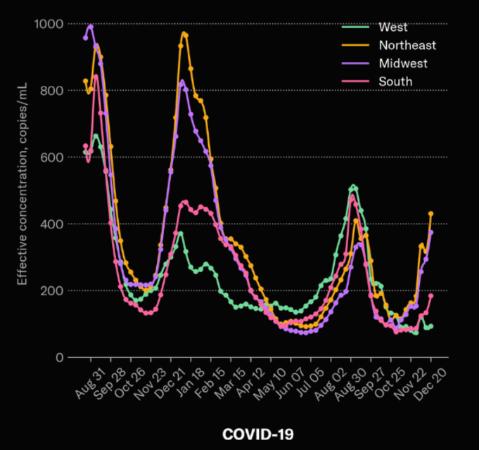
Biobot's latest wastewater numbers indicate the current XEC wave has receded a bit—but we might see a secondary bump as the numbers level off in West and Midwest, and climb a bit in the South. Image
6-2/ As US COVID waves go, wastewater numbers indicate this has been on the low side, but we don't really know if the viral shedding of JN.1 and its descendants has remained consistent with previous variants. Image
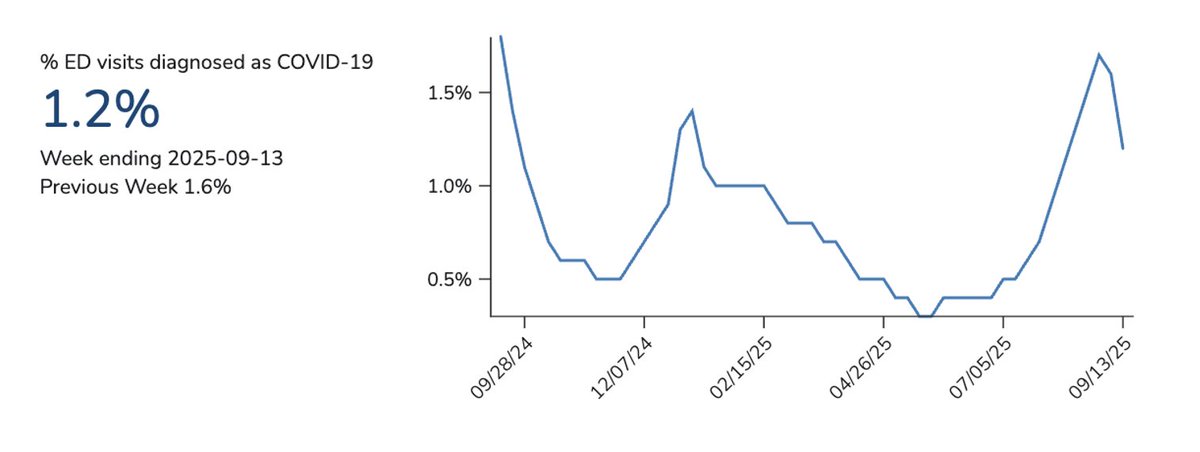
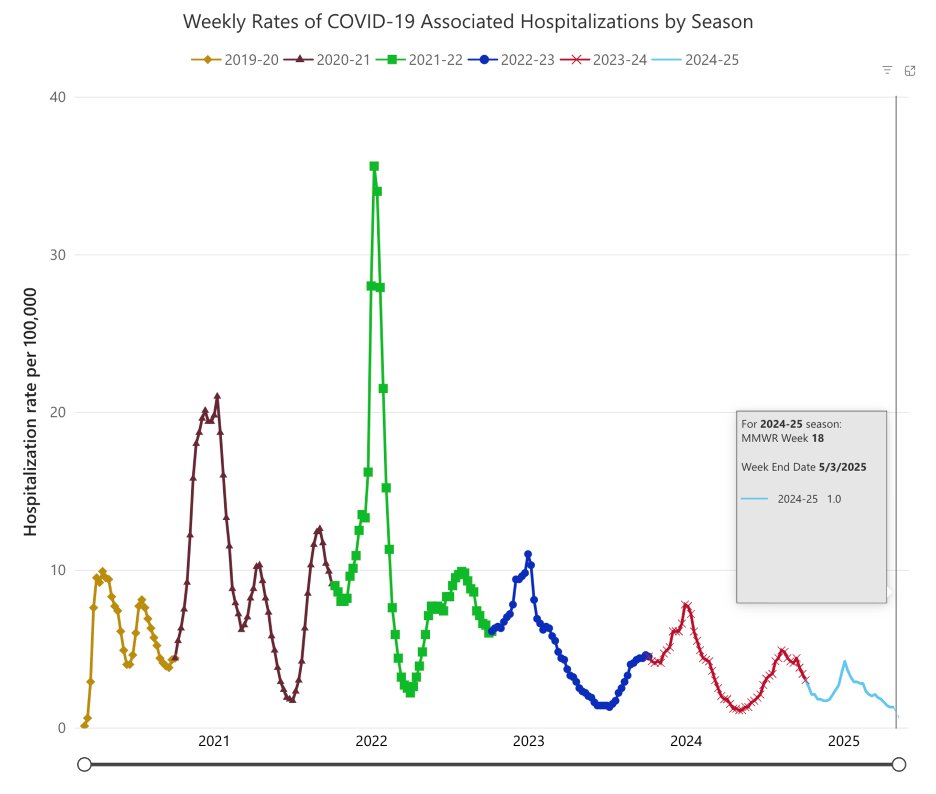
6-3/ When it comes to ED visits, hospitalization, and mortality, this has been the mildest wave ever in the US. But... Image
Image
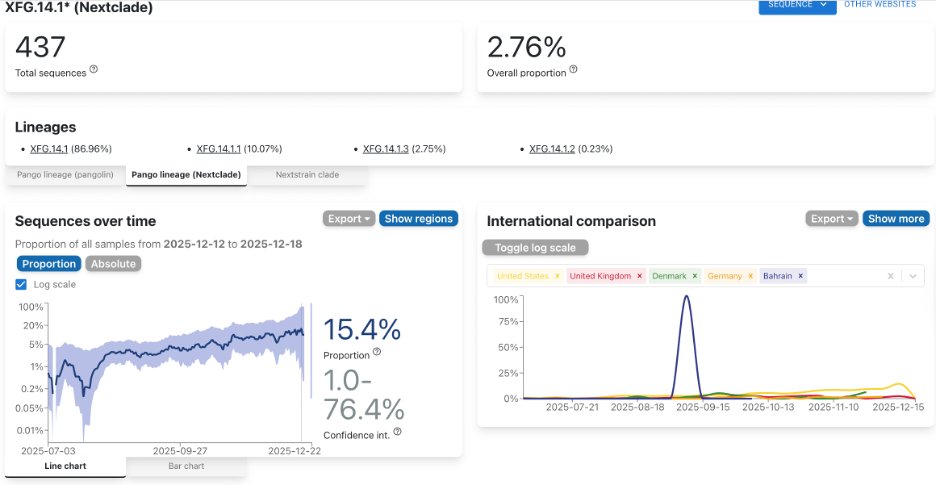
6-4/ But compared to the dominant XEC, LP.8.1x has a high growth rate. Maybe it will create a smaller secondary wave at the tail end of this one? Or maybe it will surpass XEC?—but I suspect our refreshed NAbs from JN.1 and XEC will prevent it from creating a bigger wave. Image
Image
6-5/ Even though the Morbidity and Mortality stats are no longer being updated and displayed on the CDC website, we can still get the archived stats out of Wonder. And Wonder shows us that COVID came in 14th out of the 15 most common causes of death in 2024. Image
Image
6-6/ Meanwhile, as a percentage of ED visits and test positivity, influenza is leaving COVID in the dust this respiratory season. Flu A (of the non-Avian kind) still dominates, but influenza B cases are starting to rise. Image
Image
Image
6-7/ RSV rates are dropping now. But this is the third respiratory season in row where RSV infections have been higher than the pre-COVID RSV waves. According to this paper in Nature, RSV-B at least, has some new mutations that make it more infectious.
nature.com/articles/s4146…Image
Image
6-8/ The USDA and APHIS are still reporting on A(H5) in poultry and livestock. Poultry infections may have peaked in December. The January Livestock, Dairy, and Poultry Outlook says there are indications that fewer birds were slaughtered last month. Image
Image
6-9/ In the last 30 days, 35 new dairy herds were infected with A(H5) in California, and 7 in Nevada. inThe NV infections were all in the past 10 days. And a dairy worker in Nevada was infected. His only symptoms were pink eye, though. Image
6-10/ That's it for this update. See you again in two epi weeks.
@threadreaderapp unroll

• • •

Missing some Tweet in this thread? You can try to force a refresh
 

Keep Current with beowulf888

beowulf888 Profile picture

Stay in touch and get notified when new unrolls are available from this author!

Read all threads

This Thread may be Removed Anytime!

PDF

Twitter may remove this content at anytime! Save it as PDF for later use!

Try unrolling a thread yourself!

how to unroll video
  1. Follow @ThreadReaderApp to mention us!

  2. From a Twitter thread mention us with a keyword "unroll"
@threadreaderapp unroll

Practice here first or read more on our help page!

More from @beowulf888

Apr 22
16-1/ My pathogen update for epi weeks 15-16 of 2025.
Per Biobot, national SARS2 wastewater concentrations as of 12 April were almost down to the levels of post-Omicron interwave gaps. I suspect they're there now. Image
Image
16-2/ If patterns hold, SARS2 should maintain this low level of circulation for a few weeks before climbing again in an upward curve. Though previous summer peaks have been late Aug/early Sept, I wouldn't be surprised to see the next wave peak in July or early Aug. We'll see.
16-3/If the trends hold, COVID-19 weekly mortality rates and ED visits will drop below levels of previous interwave gaps in the next few weeks. COVID-19 is still holding on to 14th place as most common cause of death, but I wonder if it won't drop off the top 15 by the end of 25. Image
Image
Read 14 tweets
Apr 7
14-1/ My pathogen update for epi weeks 13-14 of 2025.

As of 28 March, we're not down to previous interwave SARS2 circulation levels yet—except for the Western region of the US. But the rest of the US should be there by the 3rd week of April. Image
14-2/ COVID hospitalizations, ED visits, and deaths all tracking downward as of two weeks ago. Image
Image
14-3/ Flu season is receding as well. As with most previous seasons, we've got a long tail of influenza B cases, but they're nowhere near the numbers of influenza A cases. Image
Image
Read 15 tweets
Mar 25
12-1/ My pathogen update for epi weeks 11-12 of 2025. The XEC COVID wave hasn't fully receded yet. Biobot shows that as of March 15, SARS2 wastewater levels haven't fallen to previous interwave gaps except for the Western region of the US. Image
12-2/ The CDC's ww numbers indicate a long tail for this wave, but it shows the West and NE back to interwave levels. These numbers are all normalized to the previous year's numbers, so I don't know if this long tail may be an artifact of the way they normalize. I trust Biobot. Image
12-3/ If there is a long tail, it's due to the LP.8.1x brood that continues to gain traction against XEC.x. I expected the LP.8.1x's to top out at about 30%, but CoV-Spectrum shows they've reached 50%. O/c, there were only 3 LP.8.1x descendants a month ago. Now there are 19. Image
Read 13 tweets
Mar 11
10-1/ My pathogen update for epi weeks 9-10 of 2025. I'm renaming this a "pathogen update" because SARS-CoV-2 is fading into endemicity. That doesn't mean that COVID-19 won't remain a public health problem, but we've got a bunch of other pathogens that we need to keep our eye on.
10-2/ But speaking of COVID-19, the current wave is receding. Both the CDC's wastewater activity levels and Biobot's wastewater concentration chart show a downward trend in all regions of the US, Image
Image
10-3/ This XEC wave had the lowest rates of hospitalizations, ED visits, and deaths of any variant wave so far (at least for the US). And rates of test positivity for RSV and Influenza outpaced COVID this respiratory season. Image
Image
Image
Read 13 tweets
Feb 24
8-1/ My COVID update for epidemiological weeks 7-8 of 2025.

The current COVID wave continues to be the mildest in terms of hospitalizations and mortality since the pandemic began. And it doesn't look like LP.8.1 will break out to boost the current XEC wave. Image
8-2/ The CDC's wastewater survey shows SARS2 numbers are trending downward in all regions except the Midwest. Note: The CDC normalizes these against the previous year, so they don't give us absolute concentrations. Biobot does, but they haven't published an update in past 2 wks. Image
8-3/ While ED visits and deaths due to COVID remain low compared to previous waves, influenza is the respiratory virus causing the most ED visits — although we're probably past the peak for flu cases now. Image
Image
Image
Read 13 tweets
Jan 27
4-1/ My COVID update for epidemiological weeks 3-4 of 2025.

For the 1st time since 1952, the CDC stopped publishing its Morbidity and Mortality Weekly Report (MMRW)—the last update was on 16 Jan. Is the Trump administration emulating Chinese secrecy practices? Image
4-2/ Other CDC data pages seem to be up and running, though. Their wastewater numbers seem to indicate the current XEC COVID wave has peaked. Biobot hasn't published an update recently, so I don't have a reality check for CDC's data. Image
4-3/ Biofire's proprietary Syndromic Trends also shows COVID dropping off as a percentage of detected respiratory viruses. RSV may also be on downward curve, but influenza is rising fast. Image
Read 13 tweets

Did Thread Reader help you today?

Support us! We are indie developers!


This site is made by just two indie developers on a laptop doing marketing, support and development! Read more about the story.

Become a Premium Member ($3/month or $30/year) and get exclusive features!

Become Premium

Don't want to be a Premium member but still want to support us?

Make a small donation by buying us coffee ($5) or help with server cost ($10)

Donate via Paypal

Or Donate anonymously using crypto!

Ethereum

0xfe58350B80634f60Fa6Dc149a72b4DFbc17D341E copy

Bitcoin

3ATGMxNzCUFzxpMCHL5sWSt4DVtS8UqXpi copy

Thank you for your support!

Follow Us!

:(