Range Trading & Value (Part 2) - 🧵
Auction Market Theory + Flow
Part 2 covers practical frameworks including examples & discussion for trading in a range.
Rotational regimes are great for trading if you are patient and know what you're looking for.
Here's how that can look:
Auction Market Theory + Flow
Part 2 covers practical frameworks including examples & discussion for trading in a range.
Rotational regimes are great for trading if you are patient and know what you're looking for.
Here's how that can look:

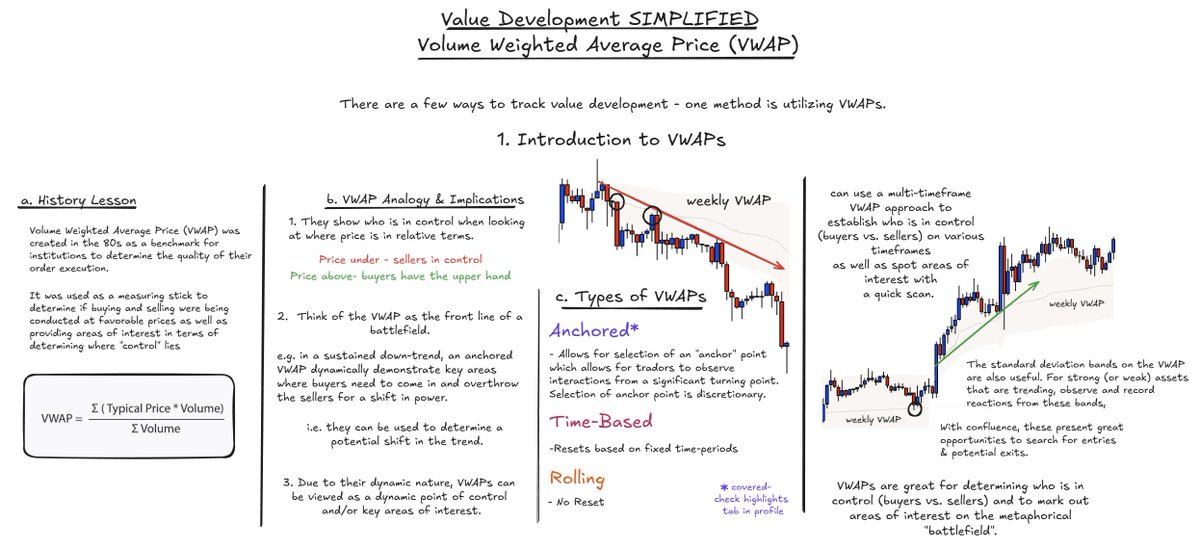
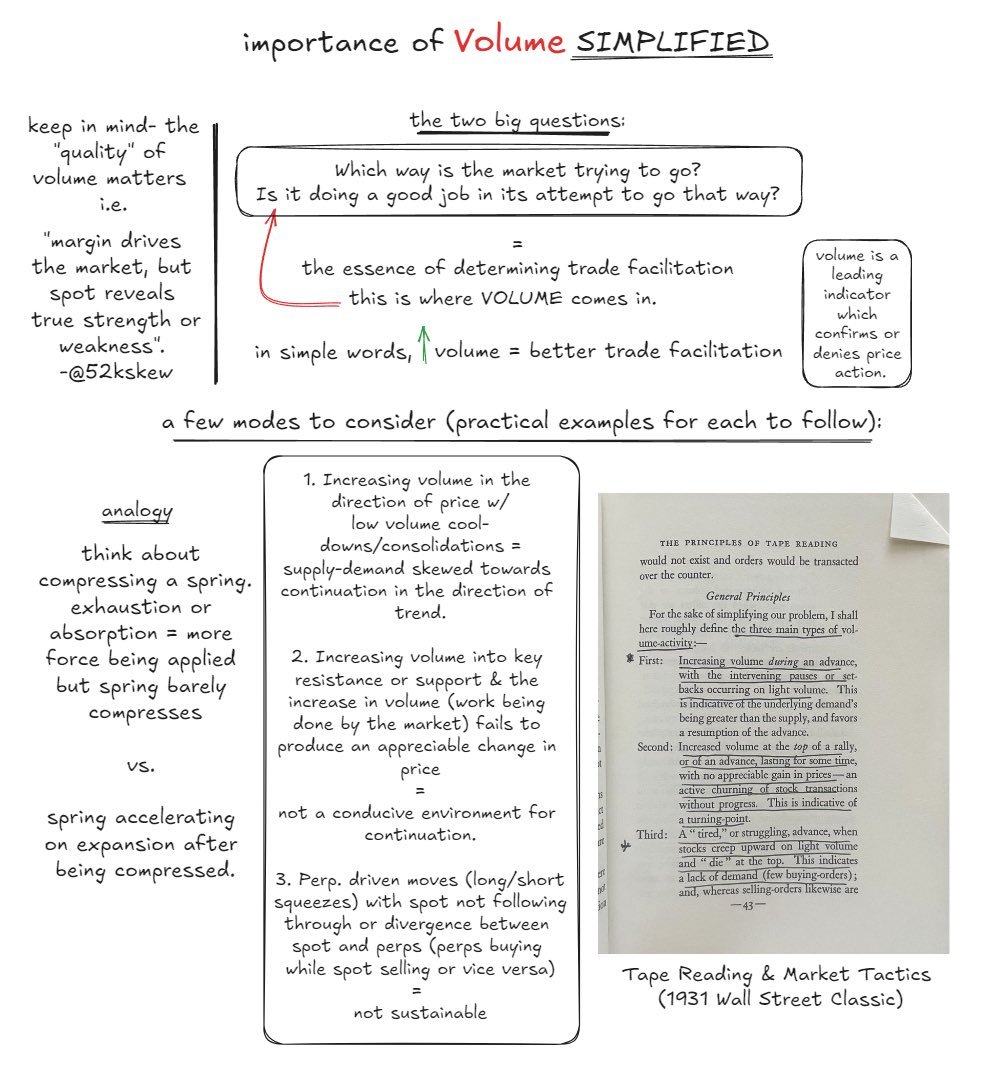
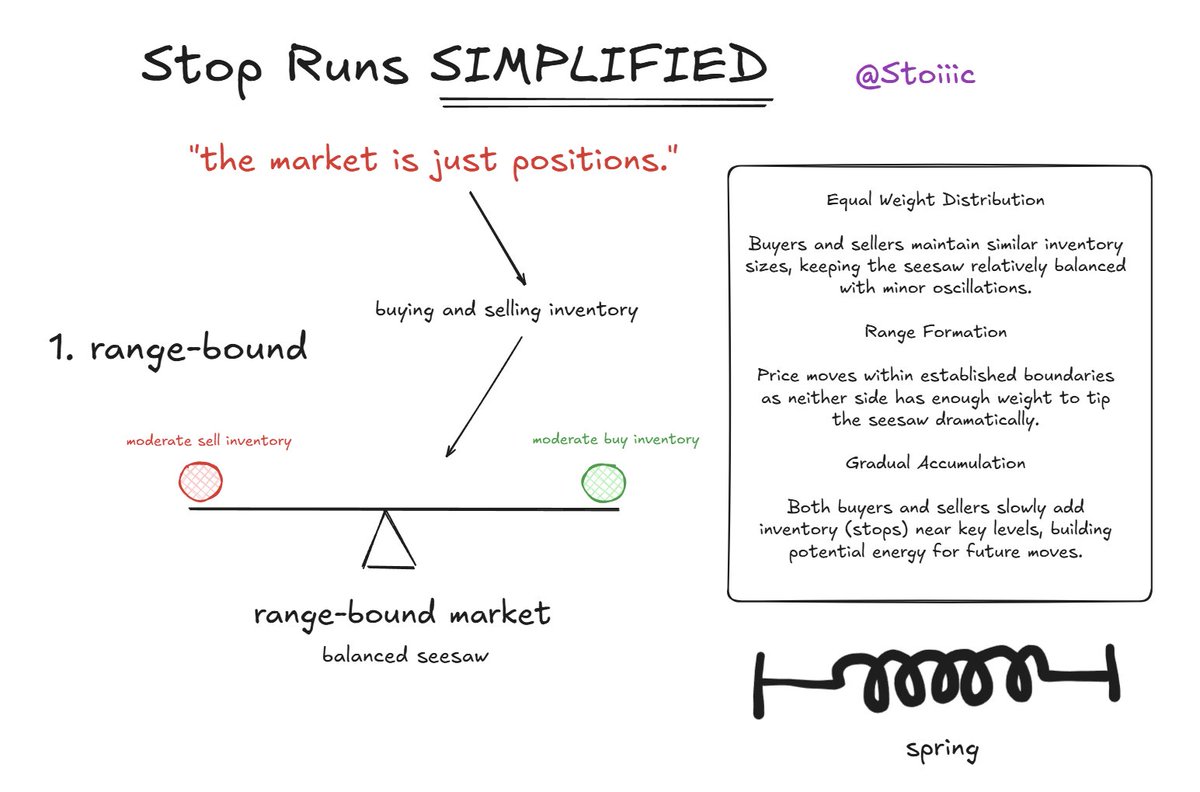
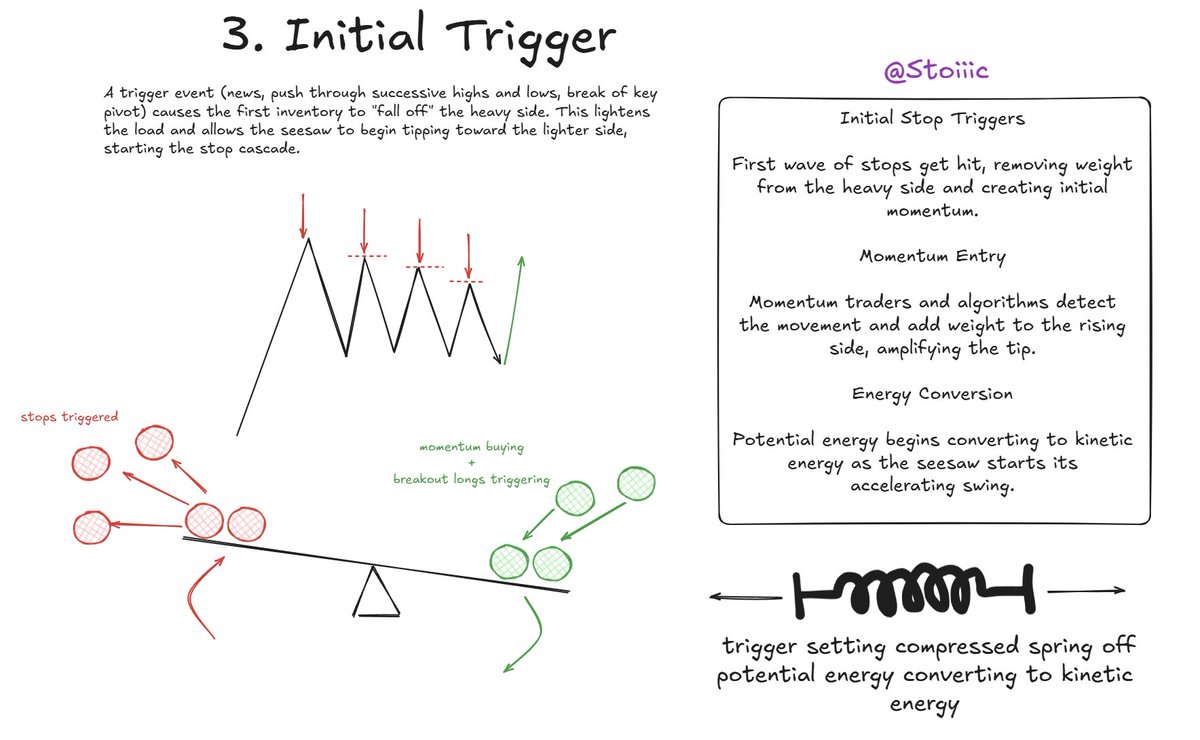
In a range-bound environment the question I'm looking to answer when price navigates towards extremes of value established in a ranging environment:
is the advertised discount or premium still considered a discount or premium by participants once price moves towards & away from extremes of value?
can deploy a two-pronged approach to attempt to answer this question:
1. passive flow
2. aggressive flow
is the advertised discount or premium still considered a discount or premium by participants once price moves towards & away from extremes of value?
can deploy a two-pronged approach to attempt to answer this question:
1. passive flow
2. aggressive flow

1. Passive Flow
What does passive flow mean?
Why consider looking at aggregate spot behavior?
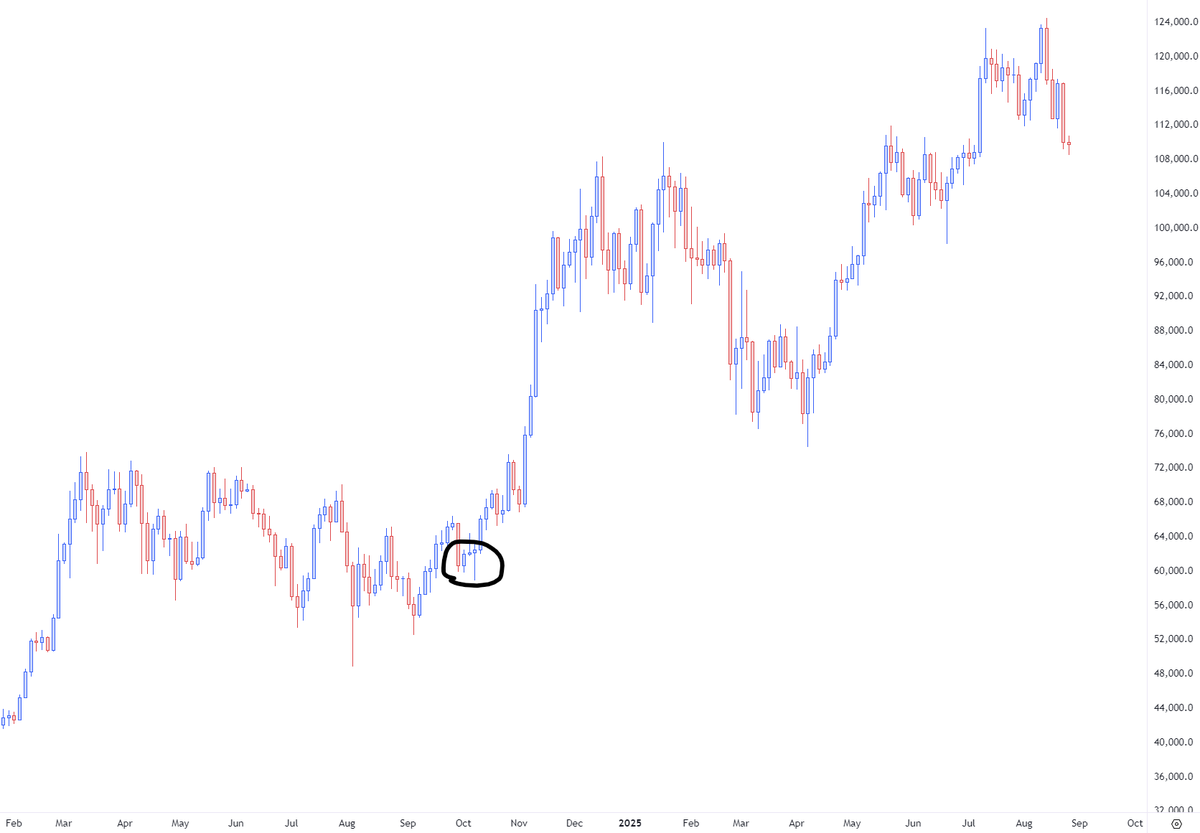
A recent $BTC example
What does passive flow mean?
Why consider looking at aggregate spot behavior?
A recent $BTC example

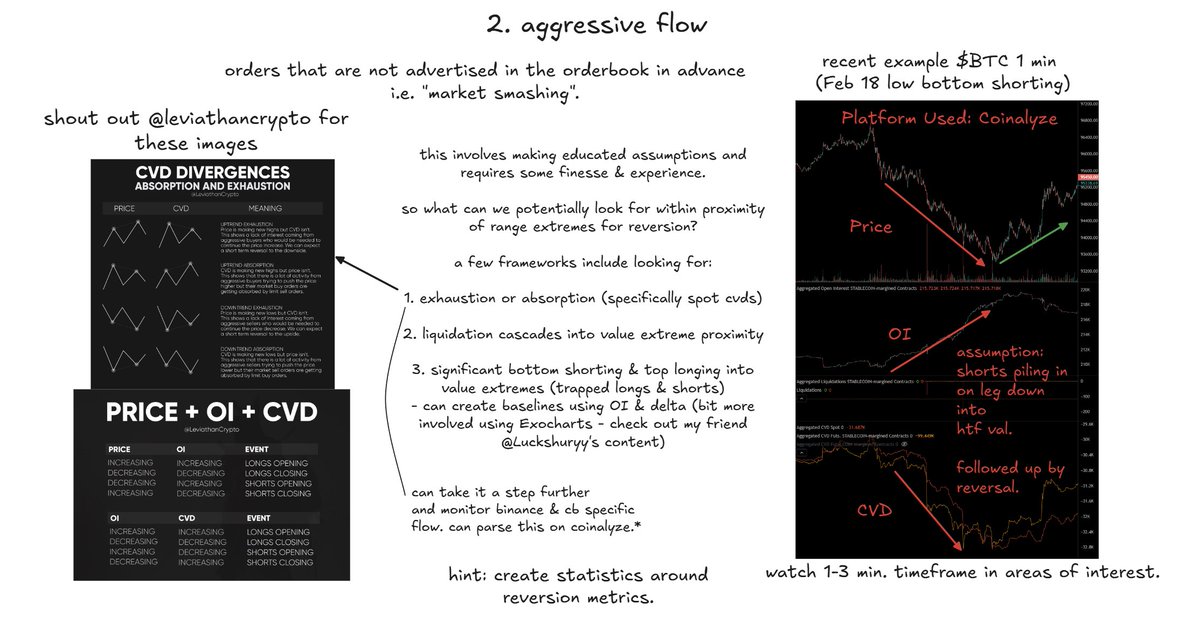
2. Aggressive Flow
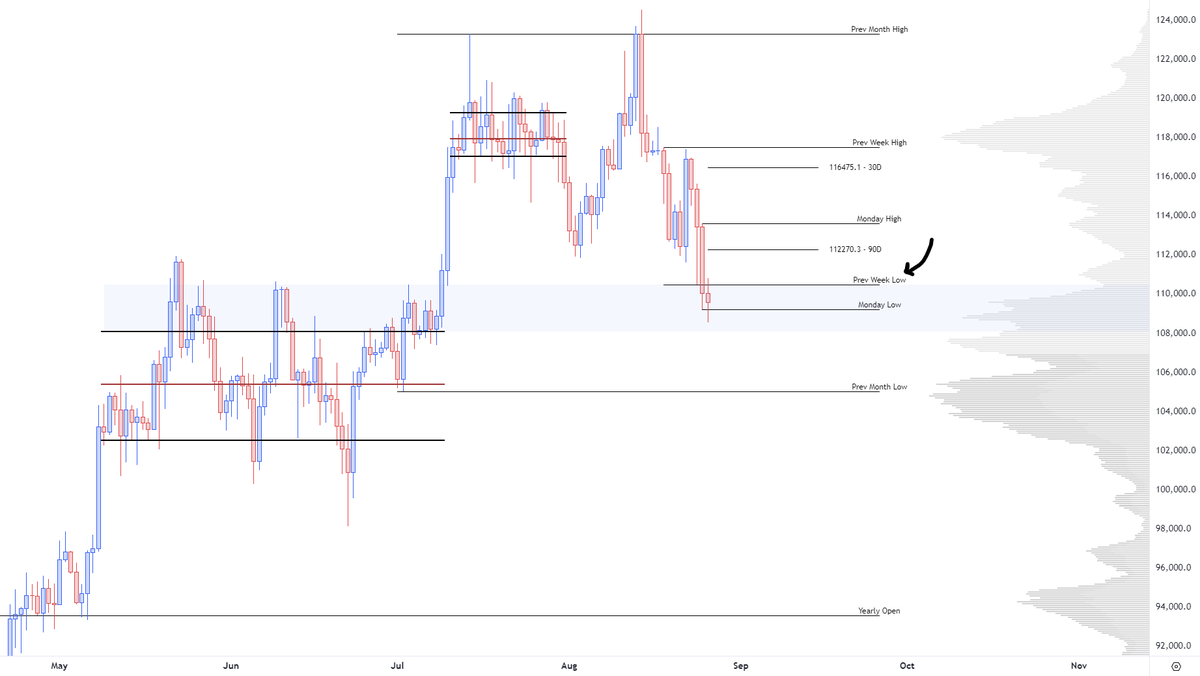
A recent $BTC example
Potential Frameworks to consider
Cheat Sheets from @leviathancrypto
@Luckshuryy as a good resource for some of these frameworks as well as use of Exocharts.
A recent $BTC example
Potential Frameworks to consider
Cheat Sheets from @leviathancrypto
@Luckshuryy as a good resource for some of these frameworks as well as use of Exocharts.
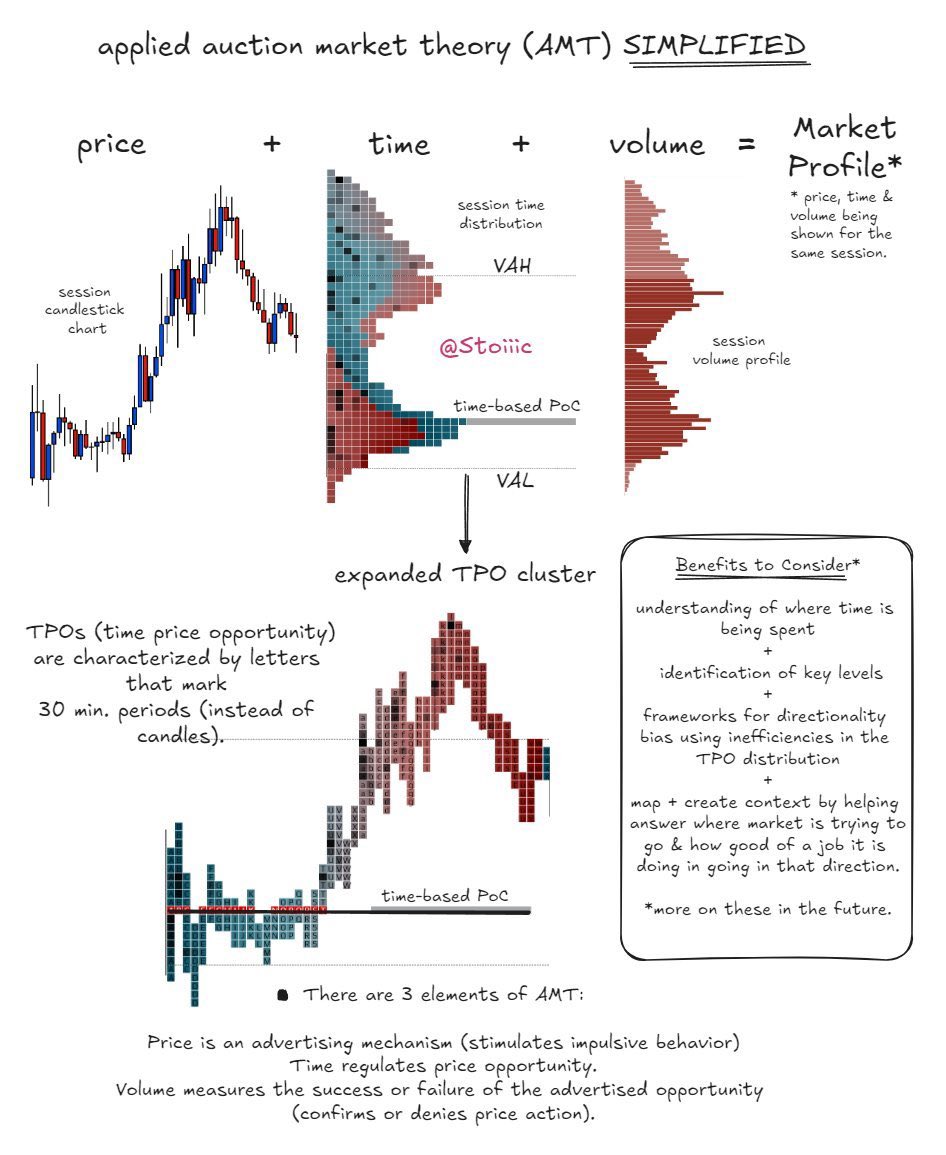
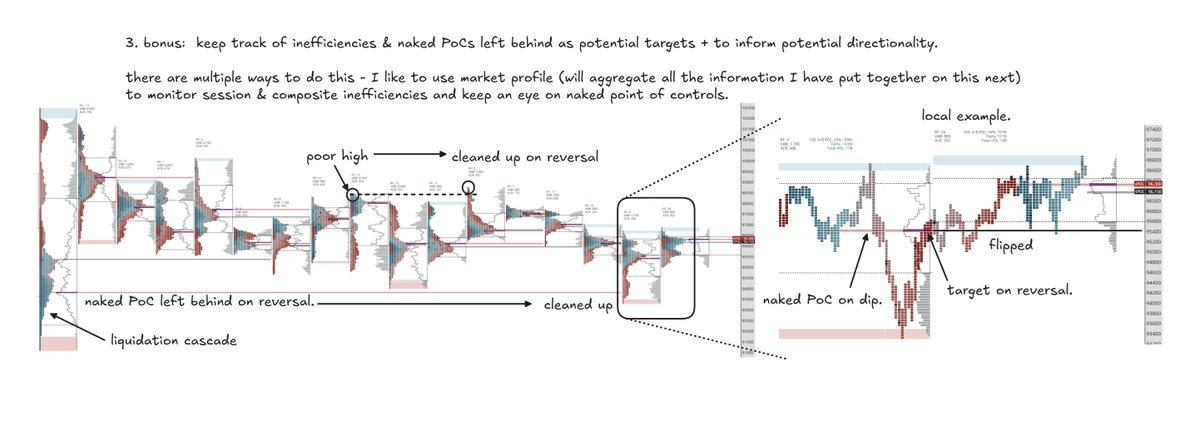
3. Bonus - Market Profile
Use of MP anomalies & naked point of control.
will aggregate all MP information in a thread next (what it is, how it can be useful, explanations on anomalies, what they mean & how they can be used + naked point of controls)
Use of MP anomalies & naked point of control.
will aggregate all MP information in a thread next (what it is, how it can be useful, explanations on anomalies, what they mean & how they can be used + naked point of controls)
Hope this was insightful. Tried to provide some nuanced frameworks that can be used to create your own ideas.
Takes a significant amount of time to put these visuals together so if you want more of these, engage with the first tweet in the thread.
Takes a significant amount of time to put these visuals together so if you want more of these, engage with the first tweet in the thread.
not like this.

• • •
Missing some Tweet in this thread? You can try to
force a refresh