Bravos Research Profile picture
Feb 24 10 tweets 4 min read Read on X
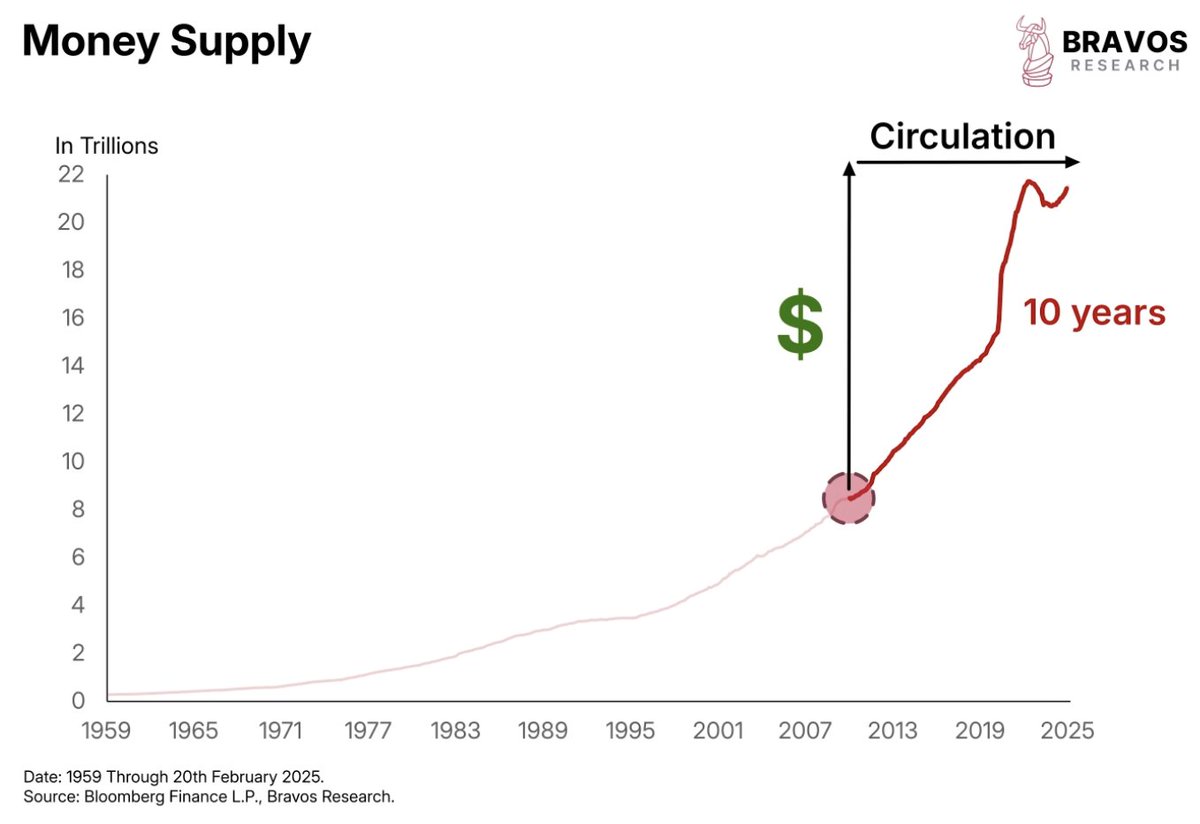
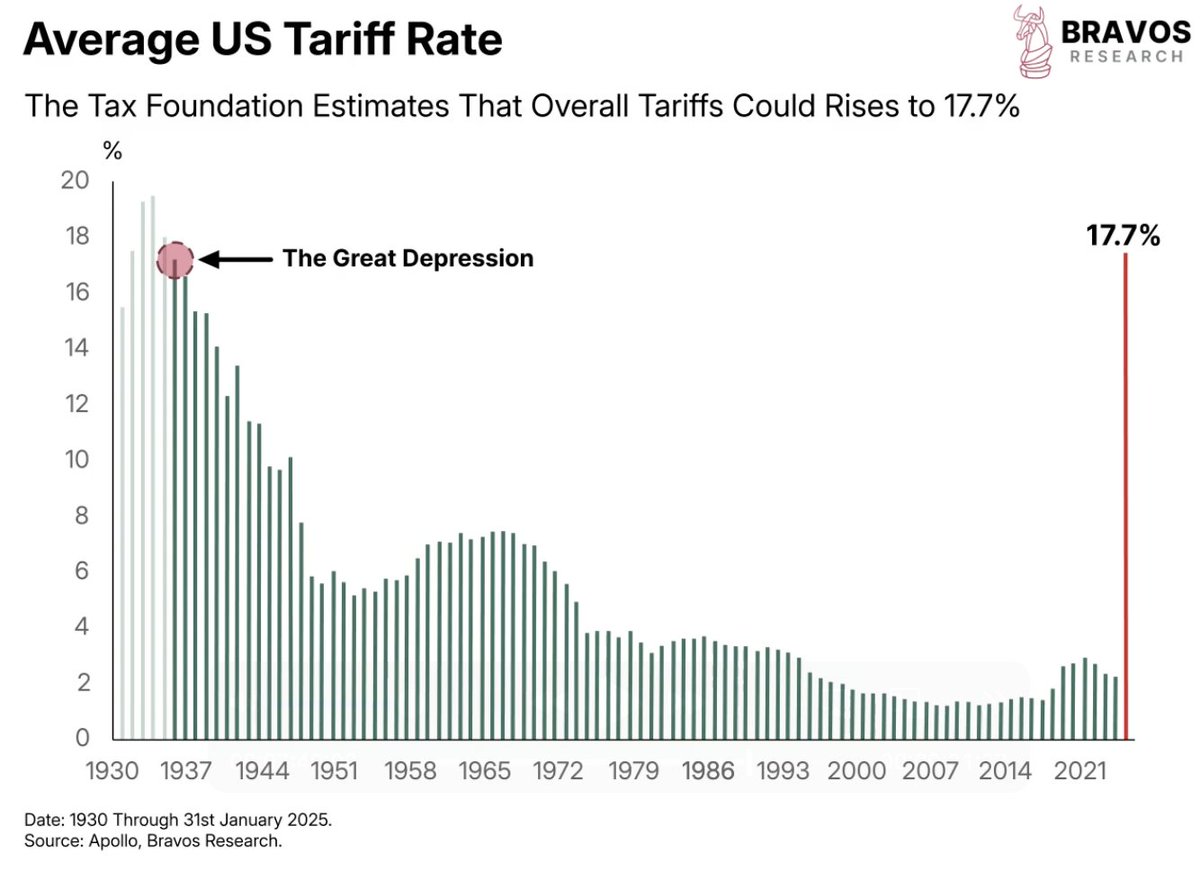
Tariffs are set to rise to 18% under Trump

This level was last seen around the Great Depression

Things are about to get absolutely crazy…

A thread 🧵 Image
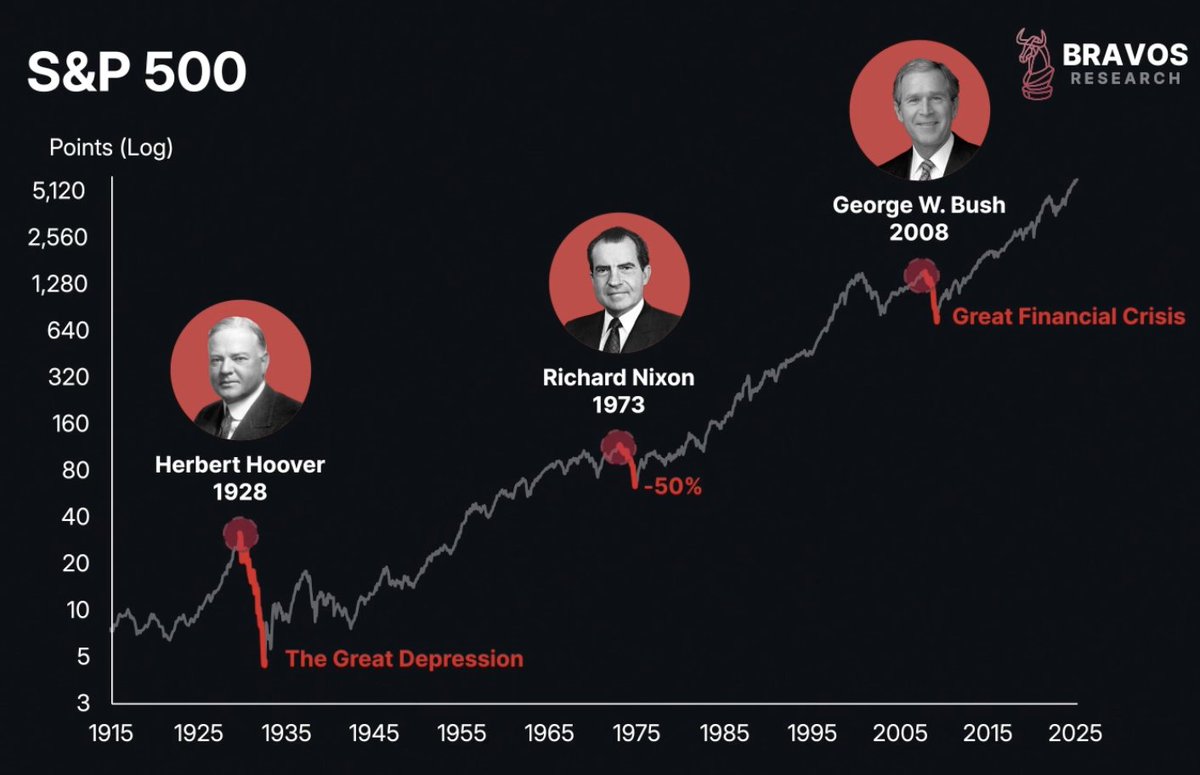
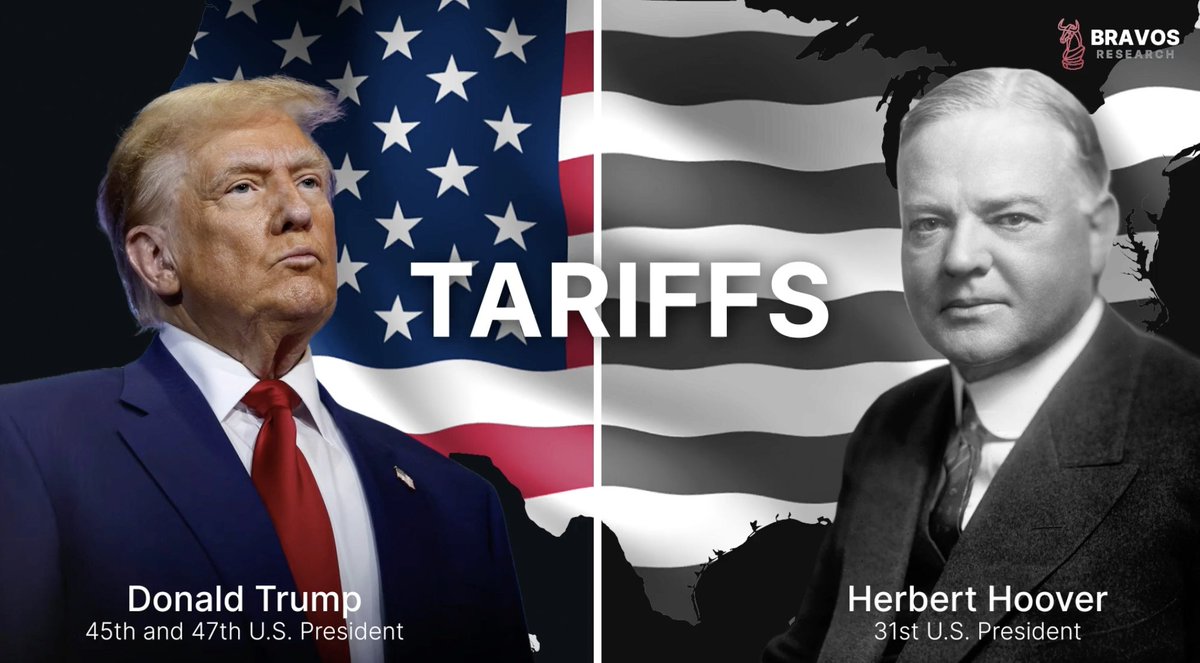
2/ One Trump policy could negatively impact the economy is tariffs

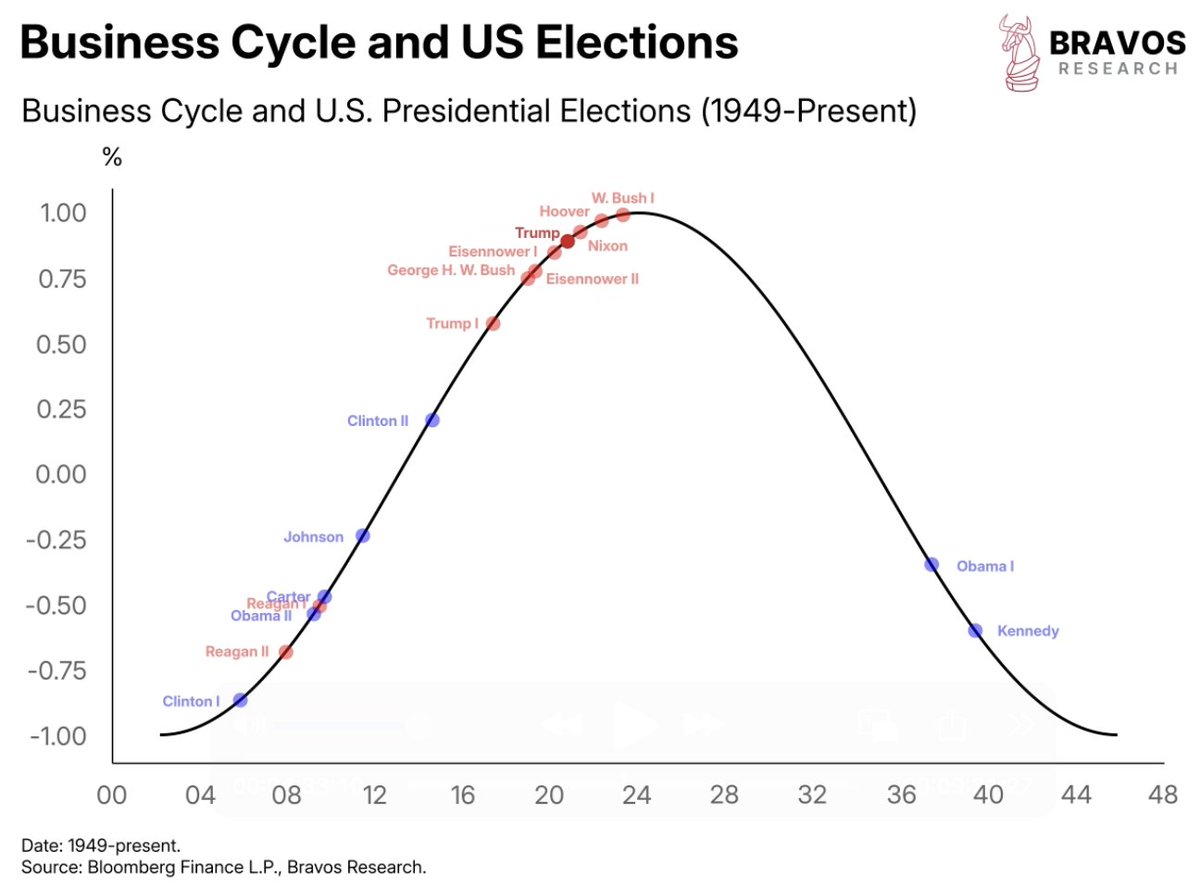
This looks similar to Herbert Hoover’s trade policies

Which contributed to the onset of the Great Depression Image
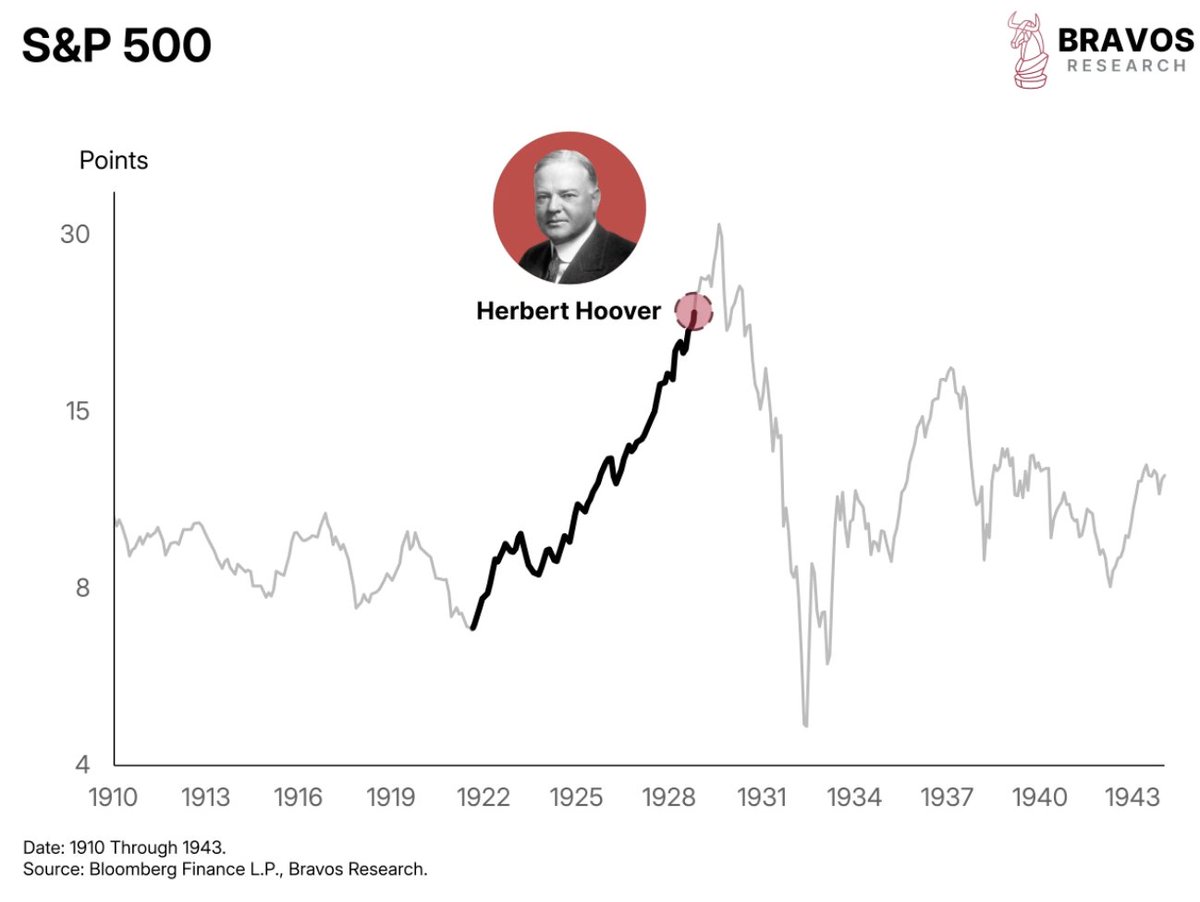
3/ Hoover came to power during a booming market but faced rising wealth inequality - a situation that mirrors today’s conditions

His aggressive tariff policies aimed to address those disparities, but ultimately backfired Image
4/ The Smoot-Hawley Tariffs back then raised US tariff rates to 20%, triggering a global trade war

Many people believe this policy played a major role in the market crash that followed Image
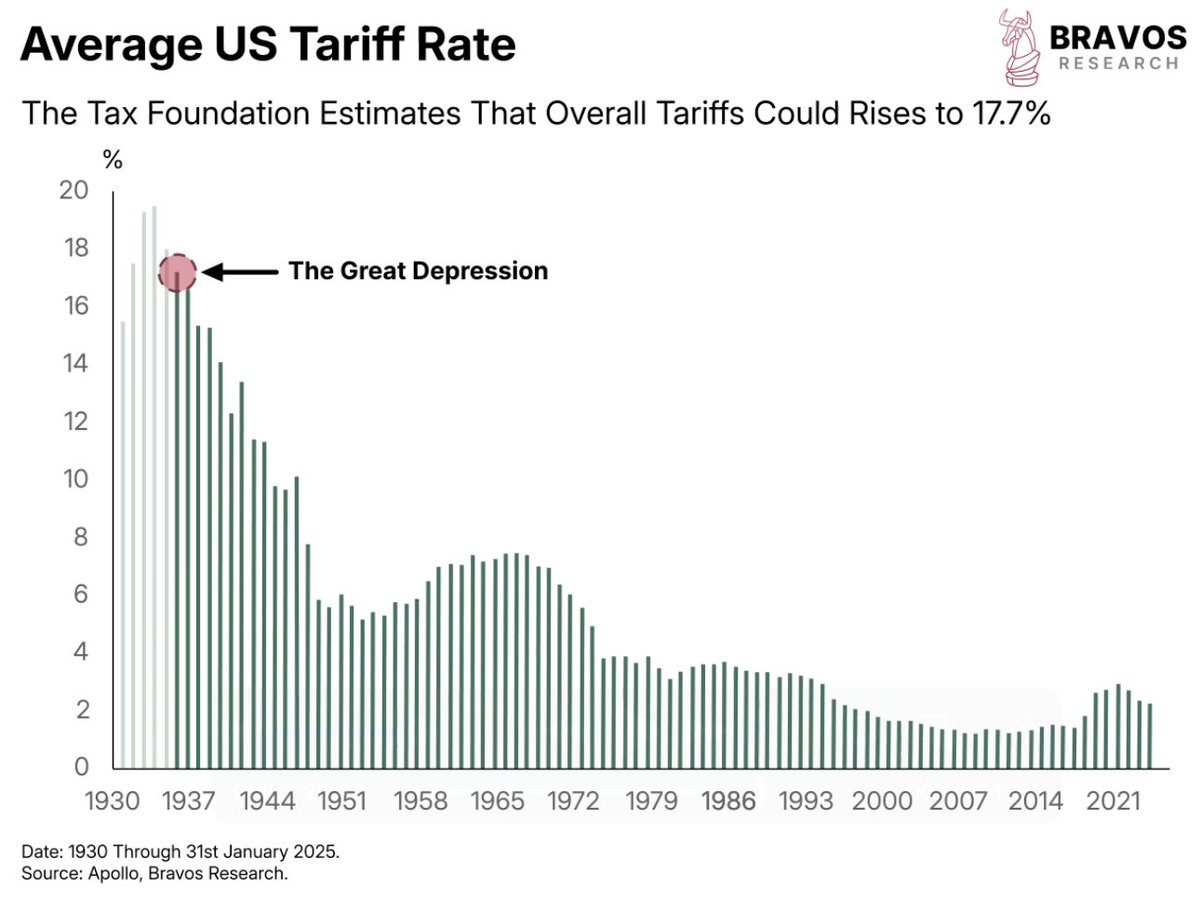
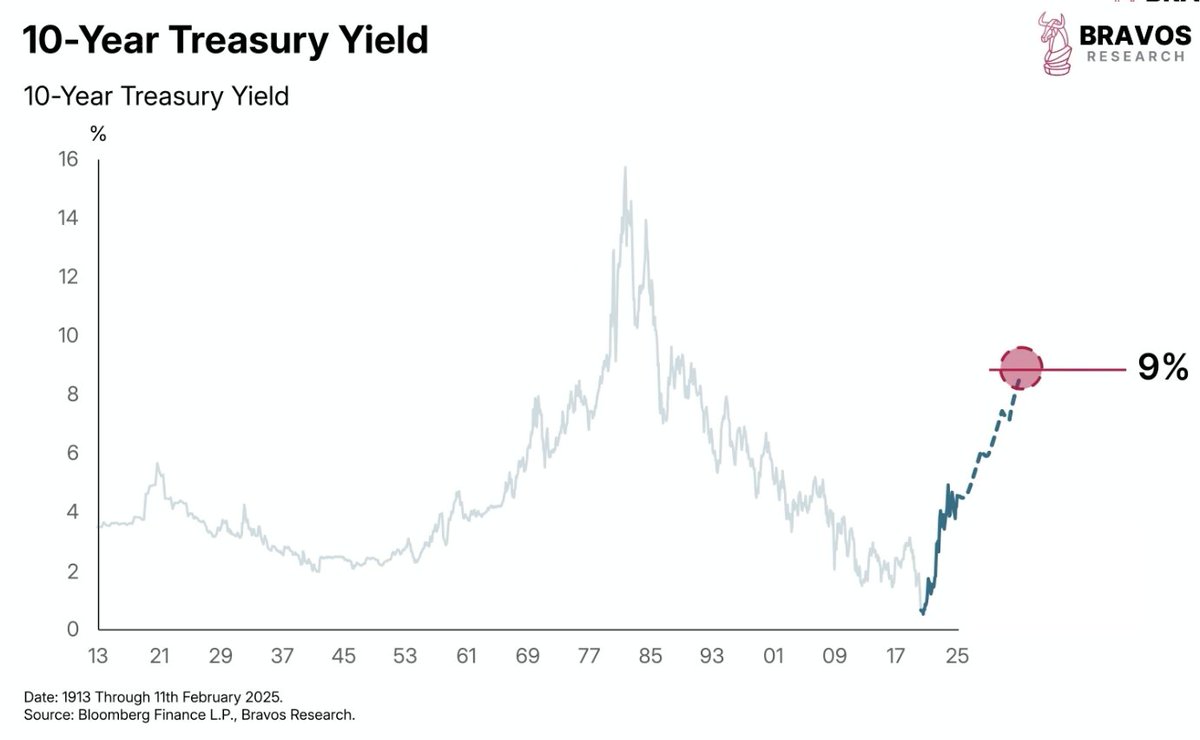
5/ Since then, US tariffs have steadily declined

However, Trump’s proposed trade policies could reverse that trend

Potentially raising rates to nearly 18% - a level that could hurt corporate profits and drag down stock prices Image
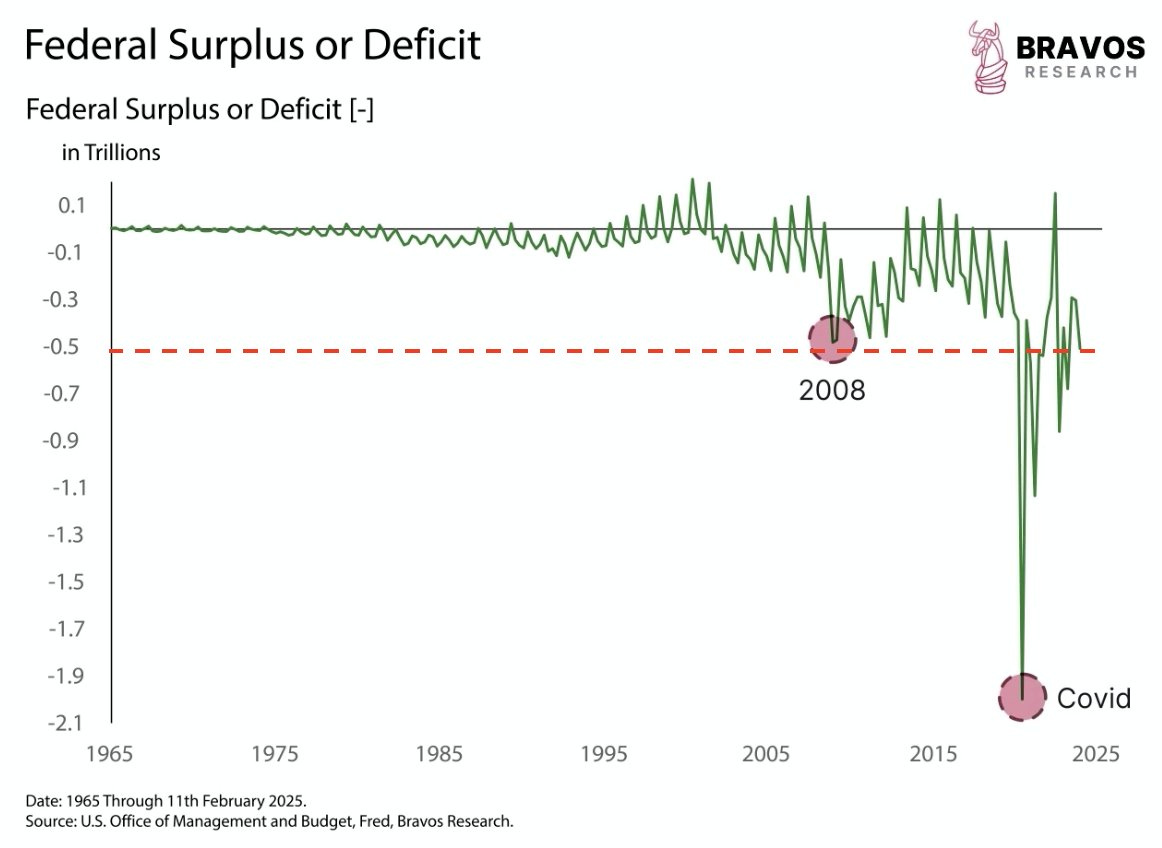
6/ For instance, during the Great Depression, profit margins fell from 10–12% to nearly 0%, contributing to a 90% collapse in the US stock market

Tariffs weren’t the only factor behind the crash though - debt, bank failures, and deflation also played roles

Still, trade policies were a significant contributor back then
7/ With corporate profits at all-time highs, a global trade war could reverse that trend

While this might reduce wealth inequality in the long run, falling asset prices could mean considerable short-term financial pain Image
8/ The effects of tariffs wouldn’t be felt immediately though

Studies of past trade wars show a lag of about a year between implementation and economic consequences

Depending on Trump’s actions, the impact could hit by 2026 Image
9/ This strengthens our conviction in an economic downturn in 2026

Don’t forget to join Bravo’s Research competition

And take advantage of the 30% DISCOUNT while it lasts at:

bit.ly/BravosResearch
10/ Thanks for reading!

If you enjoyed this thread, please ❤️ and 🔁 the first tweet below

And follow @bravosresearch for more market insights, finance and investment strategies

• • •

Missing some Tweet in this thread? You can try to force a refresh
 

Keep Current with Bravos Research

Bravos Research Profile picture

Stay in touch and get notified when new unrolls are available from this author!

Read all threads

This Thread may be Removed Anytime!

PDF

Twitter may remove this content at anytime! Save it as PDF for later use!

Try unrolling a thread yourself!

how to unroll video
  1. Follow @ThreadReaderApp to mention us!

  2. From a Twitter thread mention us with a keyword "unroll"
@threadreaderapp unroll

Practice here first or read more on our help page!

More from @bravosresearch

Feb 26
Bitcoin is currently the same size as Meta

Reaching Gold’s market cap would mean a 10x from here

Things are about to get absolutely crazy...

A thread 🧵 Image
2/ Bitcoin's chart looks parabolic right now

But its market cap is still just $2 trillion - about the same size as Meta

For all the hype, it remains relatively small compared to other global giants Image
3/ If Bitcoin were to reach Microsoft's market cap of $3 trillion, it would need to hit $150,000

Matching Apple’s $4 trillion valuation means $200,000 per coin

And to rival gold’s $20 trillion cap, Bitcoin would need to climb to $1 million Image
Read 13 tweets
Feb 25
Presidents do NOT change markets

But business cycles do…

A thread 🧵 Image
2/ A chart comparing post-election S&P 500 performance shows an eye-opening stat:

S&P 500 sees around 40% higher returns under Democrat-led administrations than under Republican ones Image
3/ It’s ironic that markets and economic growth have historically performed better under Democrats

Despite Republicans being viewed as more pro-business

But, timing and luck likely play a bigger role in these outcomes than party policies alone
Read 10 tweets
Feb 24
The US money supply has doubled in just 10 years

This liquidity surge could fuel Bitcoin’s parabolic run-up

If Bitcoin reached gold’s market cap, it would hit $1 million

Is this really possible?

A thread 🧵 Image
2/ Bitcoin's chart looks parabolic right now

But its market cap is still just $2 trillion - about the same size as Meta

For all the hype, it remains relatively small compared to other global giants Image
3/ If Bitcoin were to reach Microsoft's market cap of $3 trillion, it would need to hit $150,000

Matching Apple’s $4 trillion valuation means $200,000 per coin

And to rival gold’s $20 trillion cap, Bitcoin would need to climb to $1 million Image
Read 24 tweets
Feb 21
3 MAJOR stock market crashes had one thing in common

Today, we have the EXACT same condition in place

Buckle up.

A thread 🧵 Image
2/ 3 of the most significant peaks in US stock market history all happened under Republican presidents:

1928 (Great Depression) - Herbert Hoover

1973 (Inflation wave) - Richard Nixon

2008 (Financial Crisis) - George W. Bush Image
3/ Now, Donald Trump has returned to the White House after one of the strongest bull runs

His new policies could mark a major turning point for financial markets though

By the way, we're hosting a competition:
- Guess the S&P 500’s quarterly close
- Top 3 closest guesses win $1,500Image
Read 25 tweets
Feb 18
A 1% rise in the debt-to-GDP ratio = 4 bps increase in yields

At today’s levels, that implies a 9% 10-year Treasury yield

Is that where the bond market is headed?

A thread 🧵 Image
2/ The US government has been running a steep deficit since 2008

And is still overspending about $500 billion per quarter Image
3/ As a result, government debt has skyrocketed

When we overlay US GDP on top of debt, we see that debt levels have surpassed GDP levels

With the debt-to-GDP ratio at 120%

Back in the 1960s, that number was just 30% Image
Read 12 tweets
Feb 14
Fed’s aggressive rate hikes haven’t caused a recession yet

The unemployment rate has begun turning back down

This is the goldilocks scenario for the markets

A thread 🧵 Image
2/ In the 1940s and 1950s, US bond yields stayed low before gradually rising in the early 1960s

But something happened in 1967 that caused them to surge

And that same thing has just happened again today… Image
3/ When we overlay the trajectory of the 10-year Treasury yield from that period onto today, the similarity is striking

Back then, surging bond yields triggered multiple economic contractions in the 1970s and 1980s

With unemployment reaching its highest level since the Great DepressionImage
Read 13 tweets

Did Thread Reader help you today?

Support us! We are indie developers!


This site is made by just two indie developers on a laptop doing marketing, support and development! Read more about the story.

Become a Premium Member ($3/month or $30/year) and get exclusive features!

Become Premium

Don't want to be a Premium member but still want to support us?

Make a small donation by buying us coffee ($5) or help with server cost ($10)

Donate via Paypal

Or Donate anonymously using crypto!

Ethereum

0xfe58350B80634f60Fa6Dc149a72b4DFbc17D341E copy

Bitcoin

3ATGMxNzCUFzxpMCHL5sWSt4DVtS8UqXpi copy

Thank you for your support!

Follow Us!

:(