Did liquidity in crypto just dry up?
Crypto markets have now erased -$325 BILLION of market cap since Friday morning.
At 5:00 PM ET today, crypto lost -$100 billion in 1 HOUR without any major headlines.
What is happening with crypto? Let us explain.
(a thread)
Crypto markets have now erased -$325 BILLION of market cap since Friday morning.
At 5:00 PM ET today, crypto lost -$100 billion in 1 HOUR without any major headlines.
What is happening with crypto? Let us explain.
(a thread)

Over the last 24 hours alone, we have seen ~$150 billion liquidated from the crypto market.
Selling has broadened with just about all crypto assets falling sharply.
Even the memecoin market appears to have lost a significant portion of its liquidity.
So, what's happening?
Selling has broadened with just about all crypto assets falling sharply.
Even the memecoin market appears to have lost a significant portion of its liquidity.
So, what's happening?

It appears to have all began with Solana which is now down -22% since Friday.
Amid the memecoin frenzy, Solana saw extreme relative strength.
However, as memecoins began to fade, Solana also began to fade.
For a while, selling in Solana was largely isolated from Bitcoin.
Amid the memecoin frenzy, Solana saw extreme relative strength.
However, as memecoins began to fade, Solana also began to fade.
For a while, selling in Solana was largely isolated from Bitcoin.

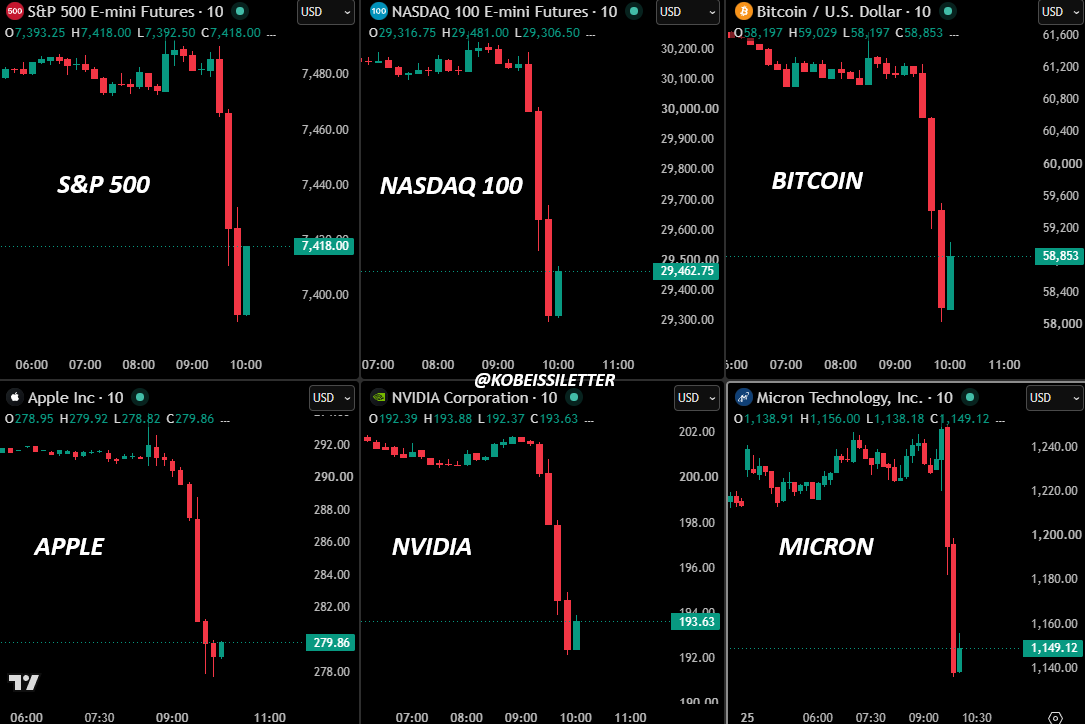
However, as the S&P 500 began selling off on Friday, Bitcoin joined the downward move.
As seen below, the drop in the S&P 500 came with an acceleration of selling in Bitcoin.
Now, Bitcoin is losing its relative strength after breaking below $98,000 support today.
As seen below, the drop in the S&P 500 came with an acceleration of selling in Bitcoin.
Now, Bitcoin is losing its relative strength after breaking below $98,000 support today.

It's rather strange that this comes hours after Citadel made a major pivot on their crypto stance.
Today, Bloomberg announced that $65 billion Citadel Securities is looking to become a liquidity provider for Bitcoin and crypto.
Markets took this as a "sell the news" event.
Today, Bloomberg announced that $65 billion Citadel Securities is looking to become a liquidity provider for Bitcoin and crypto.
Markets took this as a "sell the news" event.

It also seems that the Bybit hack on February 21st has dampened sentiment in the market.
Arkham Intelligence has declared this hack the "largest financial heist in history."
The closest competitor is the theft from the Central Bank of Iraq, which lost $1B in March 2003.
Arkham Intelligence has declared this hack the "largest financial heist in history."
The closest competitor is the theft from the Central Bank of Iraq, which lost $1B in March 2003.

In fact, the Bybit hack more than DOUBLED the 2nd largest hack in crypto history.
PolyNetwork's $611M hack in August 2021 was previous largest crypto hack.
Weakness seen in Ethereum has also put more pressure on broader crypto markets.
Hacks deteriorate confidence.
PolyNetwork's $611M hack in August 2021 was previous largest crypto hack.
Weakness seen in Ethereum has also put more pressure on broader crypto markets.
Hacks deteriorate confidence.

The technical picture also appears to have lost momentum.
However, this also does not mean that crypto markets are set for a prolonged bear market.
We have seen countless -10% pullbacks in Bitcoin over the course of this bull run.
Technical pullbacks are healthy.
However, this also does not mean that crypto markets are set for a prolonged bear market.
We have seen countless -10% pullbacks in Bitcoin over the course of this bull run.
Technical pullbacks are healthy.

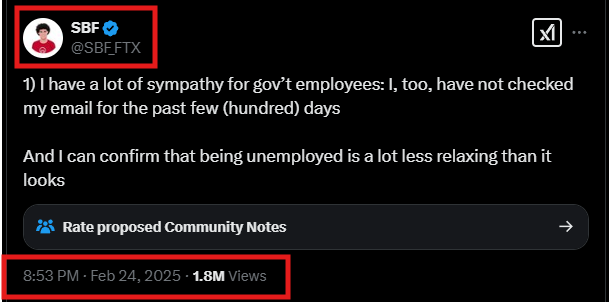
And, to top it all off, Sam Bankman-Fried is back on X.
Amid the crypto crash, SBF returned to state he has "a lot of sympathy for government employees."
This comes as DOGE and Elon Musk prepare for more mass layoffs in the federal government.
Amid the crypto crash, SBF returned to state he has "a lot of sympathy for government employees."
This comes as DOGE and Elon Musk prepare for more mass layoffs in the federal government.
Lastly, as volatility returns to equity markets, risky assets like Bitcoin are pulling back.
We saw historic levels of risk appetite in 2024 and heading into 2025.
A pullback in risk appetite means less liquidity for crypto markets.
This has certainly happened before.
We saw historic levels of risk appetite in 2024 and heading into 2025.
A pullback in risk appetite means less liquidity for crypto markets.
This has certainly happened before.

Overall, there really isn't one specific factor pushing crypto lower right now.
Rather, its a combination of factors which have resulted in reduced liquidity.
Crypto markets need LIQUIDITY to thrive.
Follow us @KobeissiLetter for real time analysis as this develops.
Rather, its a combination of factors which have resulted in reduced liquidity.
Crypto markets need LIQUIDITY to thrive.
Follow us @KobeissiLetter for real time analysis as this develops.

• • •
Missing some Tweet in this thread? You can try to
force a refresh