Something is happening in crypto:
Since January, the number of "flash crashes" in crypto markets has risen sharply.
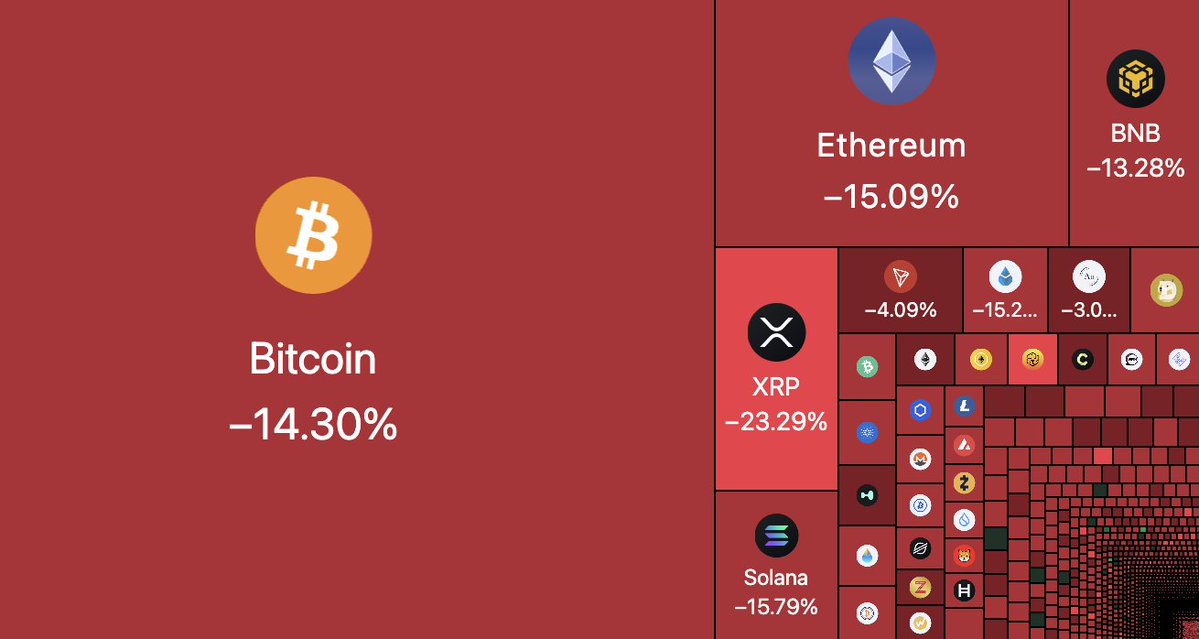
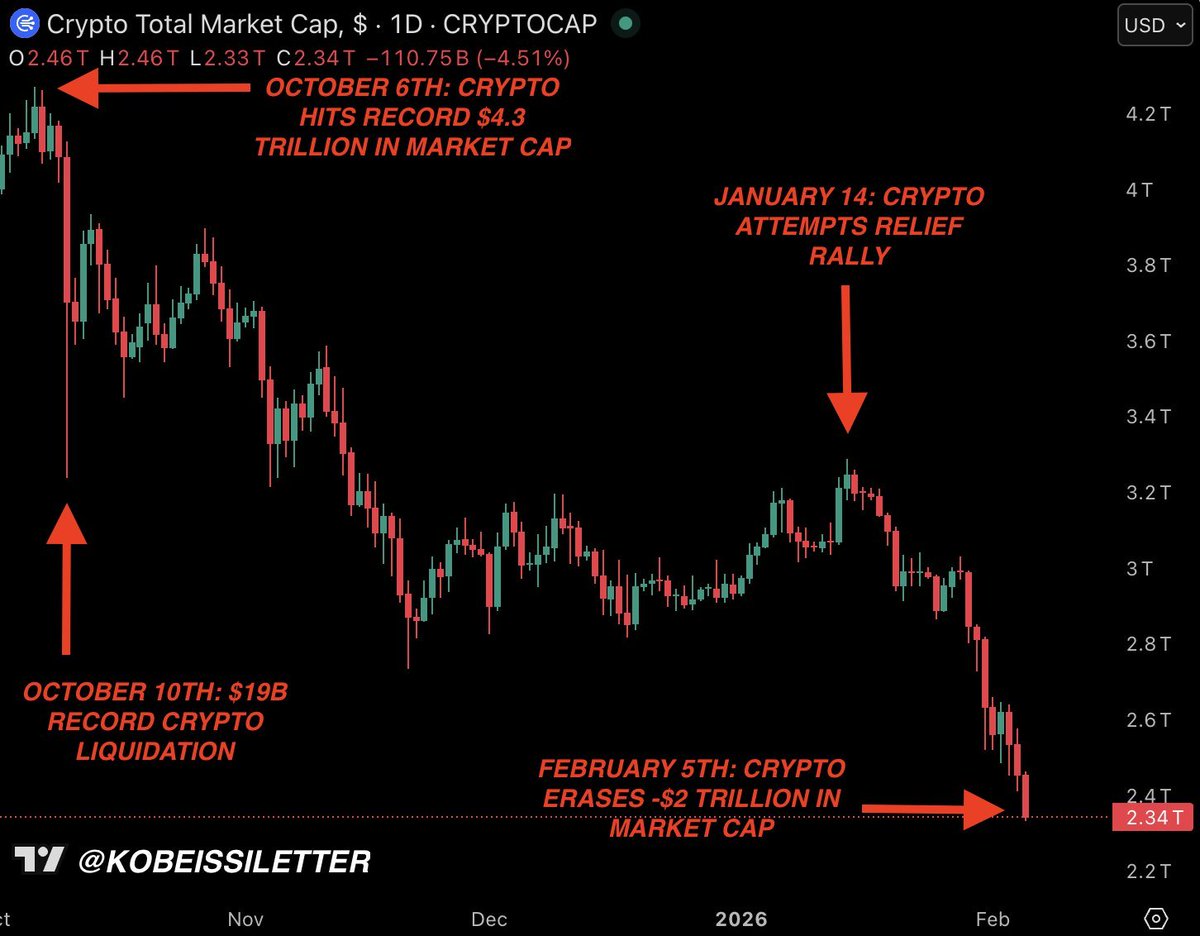
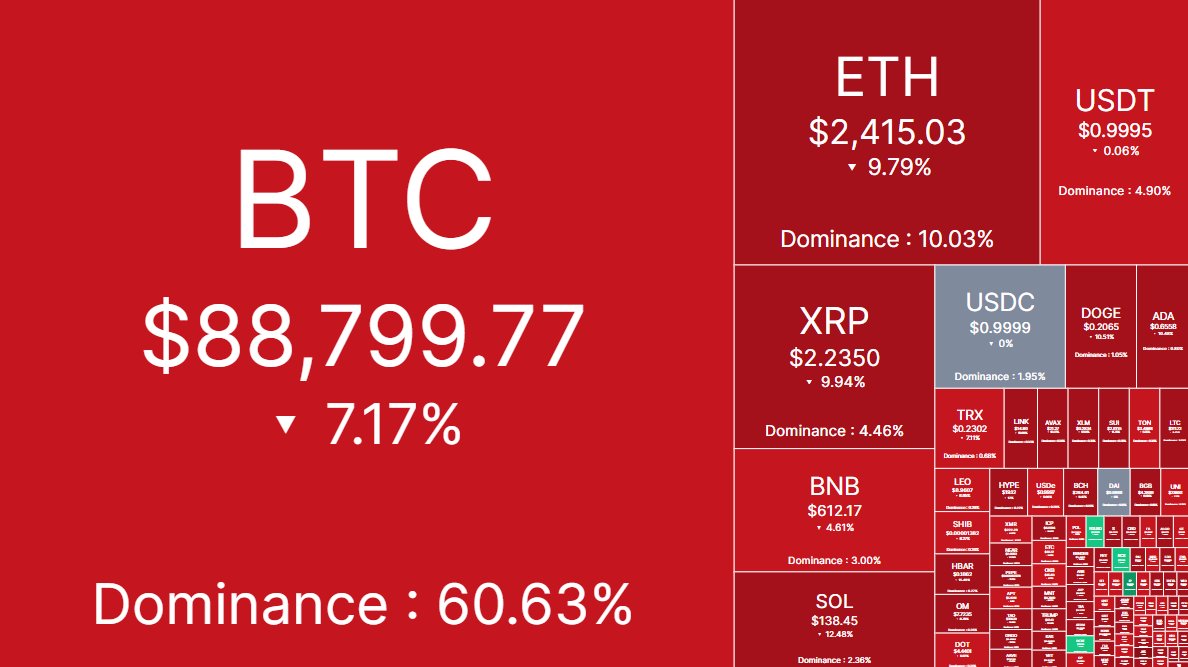
Crypto markets just erased -$300 BILLION in 24 hours without a single major bearish headline.
Why is this happening? Let us explain.
(a thread)
Since January, the number of "flash crashes" in crypto markets has risen sharply.
Crypto markets just erased -$300 BILLION in 24 hours without a single major bearish headline.
Why is this happening? Let us explain.
(a thread)

Yesterday, crypto began selling off with Bitcoin initially dropping below $95,000.
However, at between 1:45 AM ET and 2:15 AM ET, Bitcoin fell -$5,000 in 30 minutes.
A similar drop was seen beginning at 4:45 AM ET.
As seen above, Ethereum has seen even worse liquidations.
However, at between 1:45 AM ET and 2:15 AM ET, Bitcoin fell -$5,000 in 30 minutes.
A similar drop was seen beginning at 4:45 AM ET.
As seen above, Ethereum has seen even worse liquidations.

In fact, on February 2nd, we saw Ethereum fall -37% in 60 hours as trade war headlines ramped up.
However, most of the trade war headlines were priced-in prior to February 2nd.
Yet still, liquidity was drained from Ethereum at a historic pace.
However, most of the trade war headlines were priced-in prior to February 2nd.
Yet still, liquidity was drained from Ethereum at a historic pace.

Below is a walkthrough of exactly what happened in the lead up to the February 2nd liquidation.
In 1 hour on February 2nd, we saw Ethereum swing nearly 25%.
This is a MASSIVE swing in price for the 2nd largest cryptocurrency in the world.
ETH is now worth ~$300 billion.
In 1 hour on February 2nd, we saw Ethereum swing nearly 25%.
This is a MASSIVE swing in price for the 2nd largest cryptocurrency in the world.
ETH is now worth ~$300 billion.

This brings us to this chart.
Short positioning in Ethereum surged +40% in ONE WEEK and +500% since November 2024.
Never in history have Wall Street hedge funds been so short of Ethereum, and it's not even close.
Since December 16th, ETH is down -40% while BTC is down -15%.
Short positioning in Ethereum surged +40% in ONE WEEK and +500% since November 2024.
Never in history have Wall Street hedge funds been so short of Ethereum, and it's not even close.
Since December 16th, ETH is down -40% while BTC is down -15%.

And, while institutions are shorting Ethereum, they have flocked into Bitcoin.
Retail capital in Bitcoin fell sharply into Jan 2025 and the memecoin craze only accelerated the decline.
While we have record levels of retail capital in crypto, Bitcoin exposure has dropped.
Retail capital in Bitcoin fell sharply into Jan 2025 and the memecoin craze only accelerated the decline.
While we have record levels of retail capital in crypto, Bitcoin exposure has dropped.

The result is a market that is increasingly full of "air pockets."
When sentiment shifts, large institutional investors have a major impact on price.
Furthermore, (relatively) smaller assets like Solana are seeing extreme volatility with tons of RETAIL participation.
When sentiment shifts, large institutional investors have a major impact on price.
Furthermore, (relatively) smaller assets like Solana are seeing extreme volatility with tons of RETAIL participation.

When the market sees a drop in liquidity, price action drops sharply.
The polarization of positioning has made this trend even stronger.
And, it works in the opposite direction.
This is why crypto sometimes adds hundreds of billions of market cap within a matter of hours.
The polarization of positioning has made this trend even stronger.
And, it works in the opposite direction.
This is why crypto sometimes adds hundreds of billions of market cap within a matter of hours.

This explains why shifts in sentiment in crypto happen so rapidly.
For example, amid the recent pullback, sentiment in crypto is now down to its 2024 lows, as seen below.
We are seeing the effects of polarization in retail vs institutional positioning with record involvement.
For example, amid the recent pullback, sentiment in crypto is now down to its 2024 lows, as seen below.
We are seeing the effects of polarization in retail vs institutional positioning with record involvement.

The same signal is seen in the crypto fear and greed index.
Just weeks ago, this index was trading at greed levels.
Now, the index is back down to fear, at 29%.
Every time sentiment swings, we expect to see these "flash crash" type moves due to the above dynamics.
Just weeks ago, this index was trading at greed levels.
Now, the index is back down to fear, at 29%.
Every time sentiment swings, we expect to see these "flash crash" type moves due to the above dynamics.

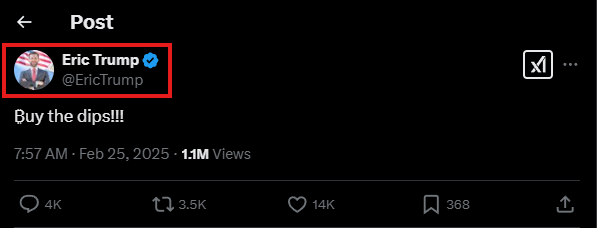
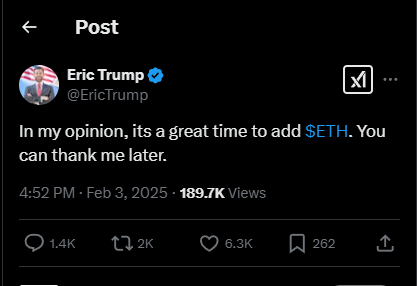
And, to make things even more interesting, Eric Trump has been very vocal about Bitcoin and Ethereum.
Whenever we see these "flash crash" type drops, Eric Trump suggests it's a good time to buy.
We saw this with ETH on February 3rd and BTC on February 25th.
Whenever we see these "flash crash" type drops, Eric Trump suggests it's a good time to buy.
We saw this with ETH on February 3rd and BTC on February 25th.
Lastly, MicroStrategy, $MSTR, seems to have also contributed to the polarization in price action.
In fact, since the November 20th high, $MSTR is now down ~45%.
Amid dips, the company continues to pile tens of billions worth of Bitcoin through convertible note offerings.
In fact, since the November 20th high, $MSTR is now down ~45%.
Amid dips, the company continues to pile tens of billions worth of Bitcoin through convertible note offerings.

Sum this up and you have a polarized market with record levels of retail capital and a pro-crypto US government.
The result will be increasingly large swings to BOTH directions.
Are you buying the dip here?
Follow us @KobeissiLetter for real time analysis as this develops.
The result will be increasingly large swings to BOTH directions.
Are you buying the dip here?
Follow us @KobeissiLetter for real time analysis as this develops.
• • •
Missing some Tweet in this thread? You can try to
force a refresh