Bravos Research Profile picture
Feb 25, 2025 10 tweets 4 min read Read on X
Presidents do NOT change markets

But business cycles do…

A thread 🧵 Image
2/ A chart comparing post-election S&P 500 performance shows an eye-opening stat:

S&P 500 sees around 40% higher returns under Democrat-led administrations than under Republican ones Image
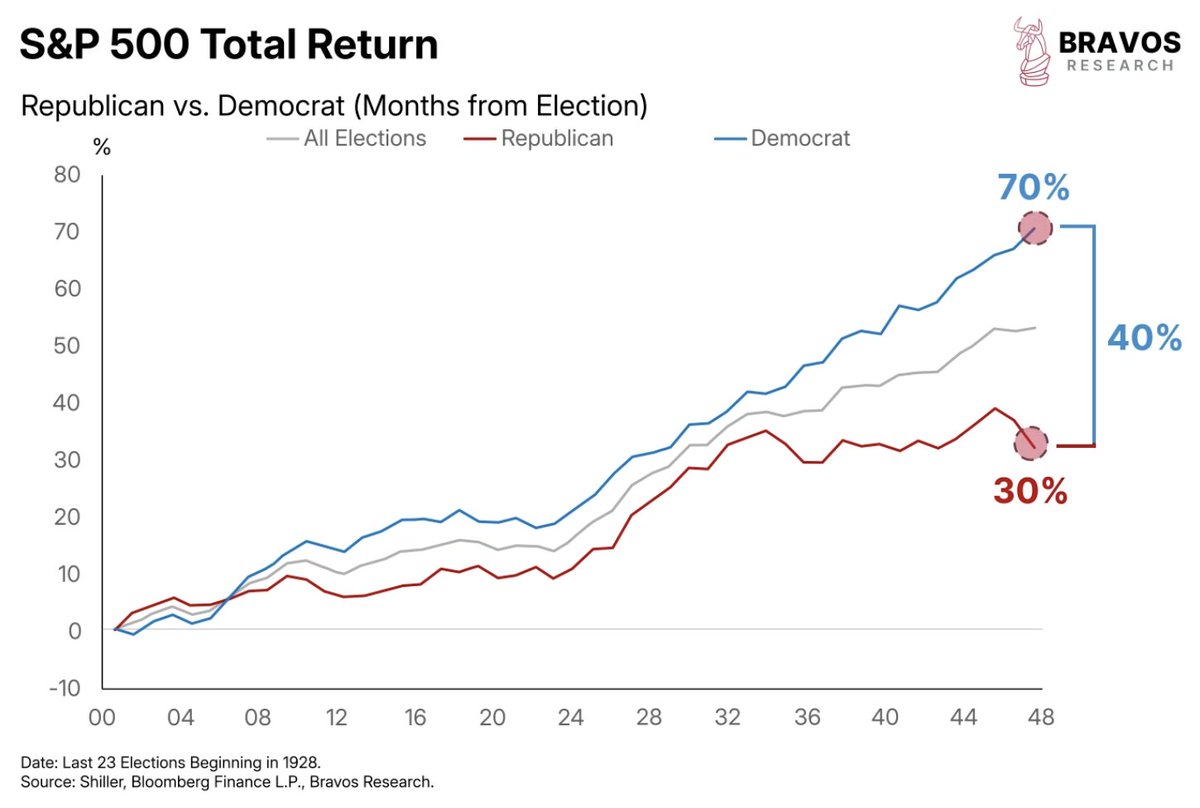
3/ It’s ironic that markets and economic growth have historically performed better under Democrats

Despite Republicans being viewed as more pro-business

But, timing and luck likely play a bigger role in these outcomes than party policies alone
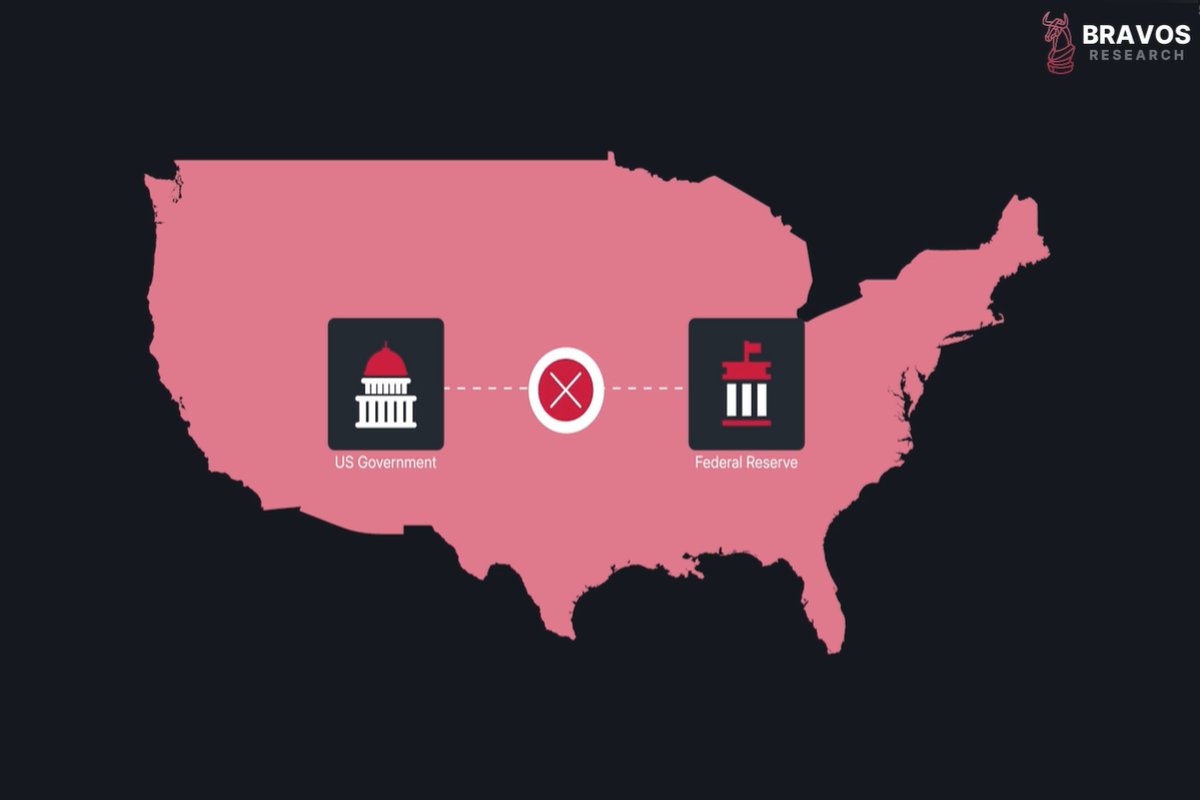
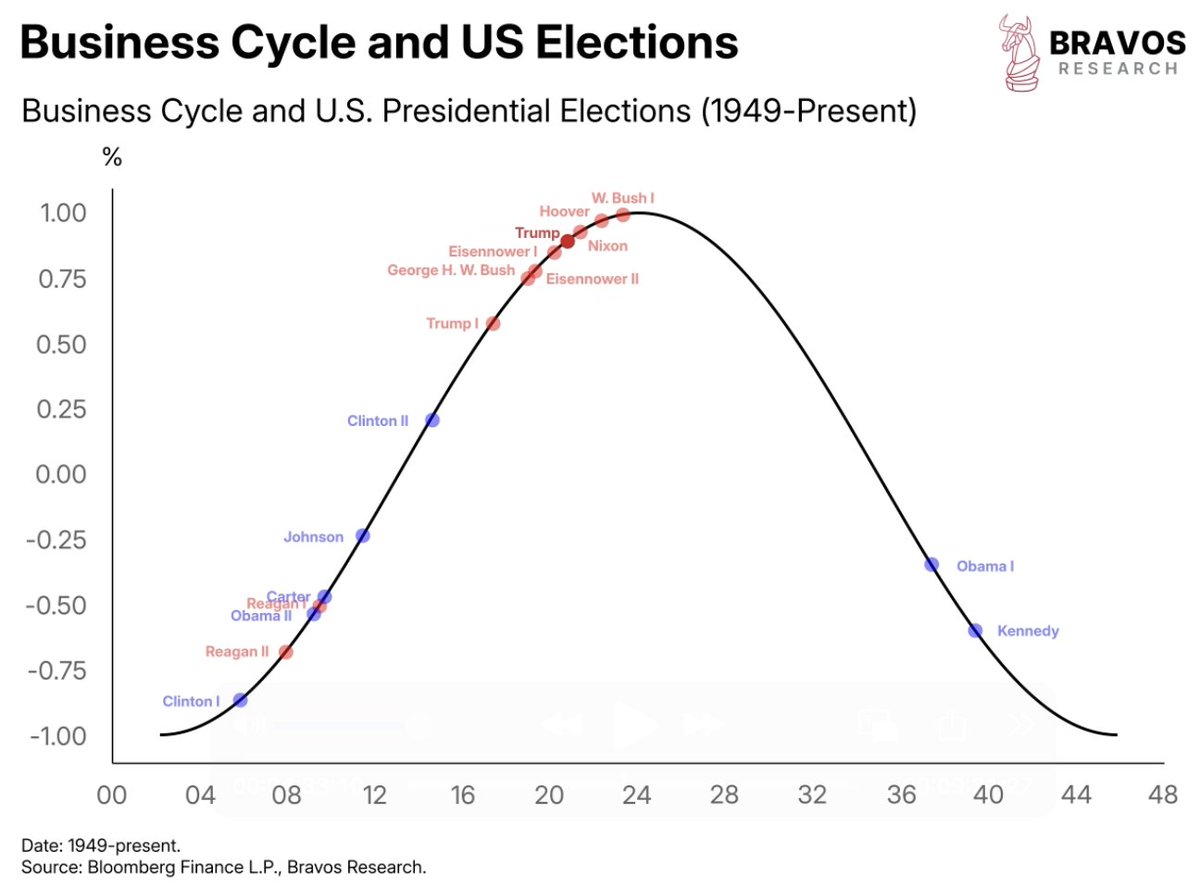
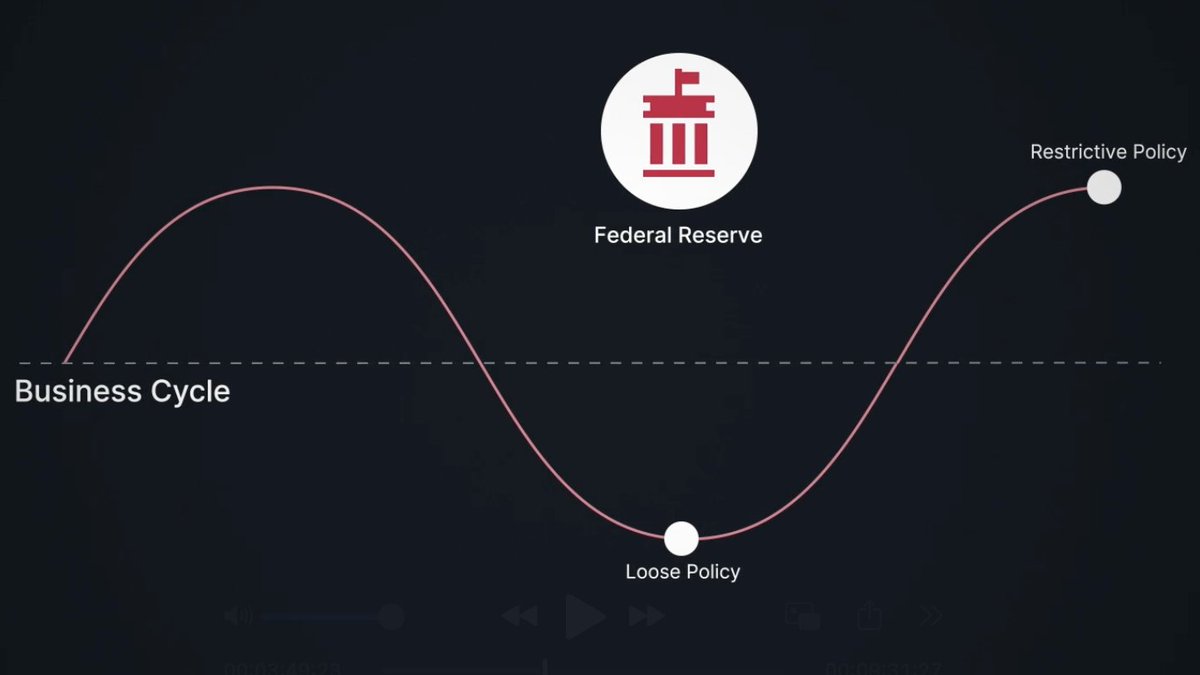
4/ The economy naturally moves through cycles of expansion and contraction, largely influenced by the Fed’s monetary policies rather than the president’s actions

Loose monetary policies stimulate growth

While restrictive measures help cool overheating economies Image
5/ Looking at past elections since 1949, many Republican presidents—Hoover, Nixon, Bush—were elected near the peaks of business cycles

Meaning their terms were more likely to face downturns

In contrast, Democrats often took office during recessions or early recoveries, benefiting from natural economic growthImage
6/ Trump’s return seems to follow this historical trend

Low initial jobless claims suggest we’re nearing the end of the current business cycle

Which is a period that often precedes a recession within a few years Image
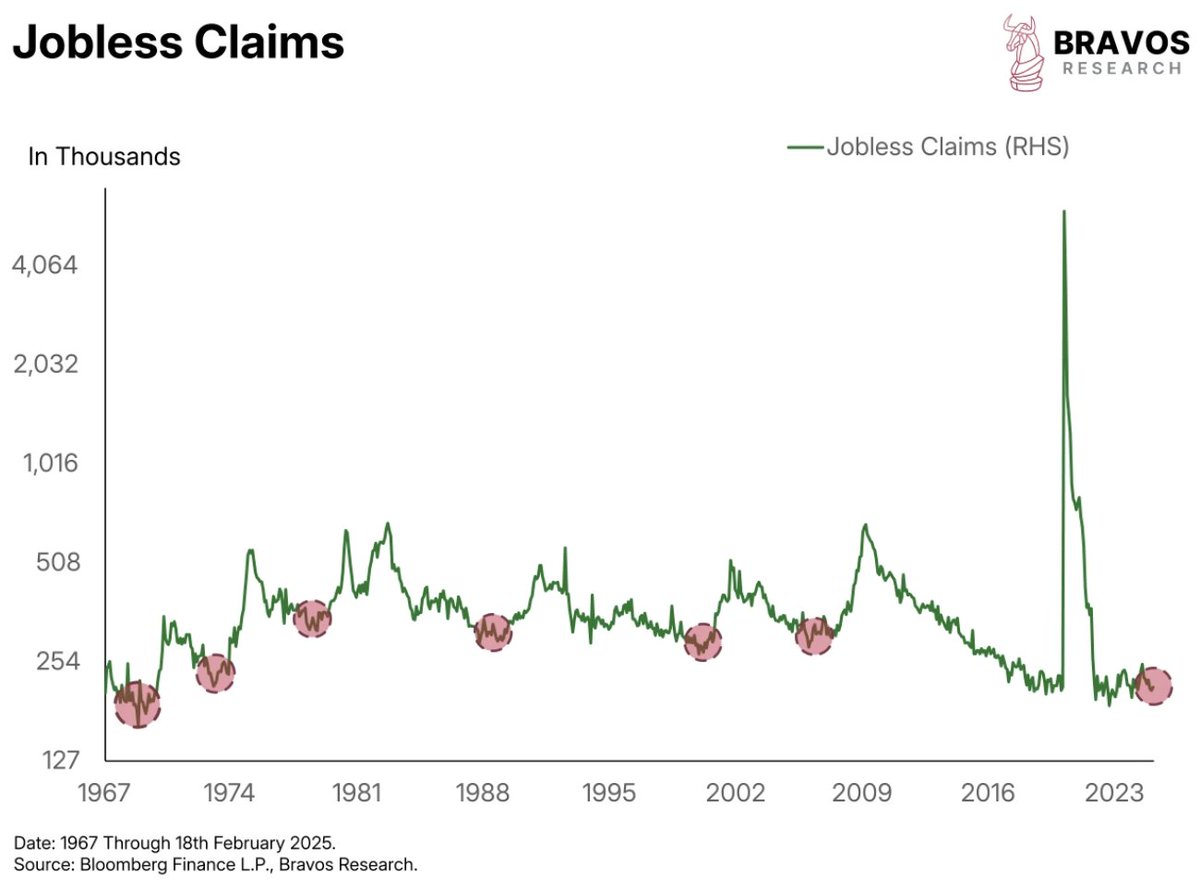
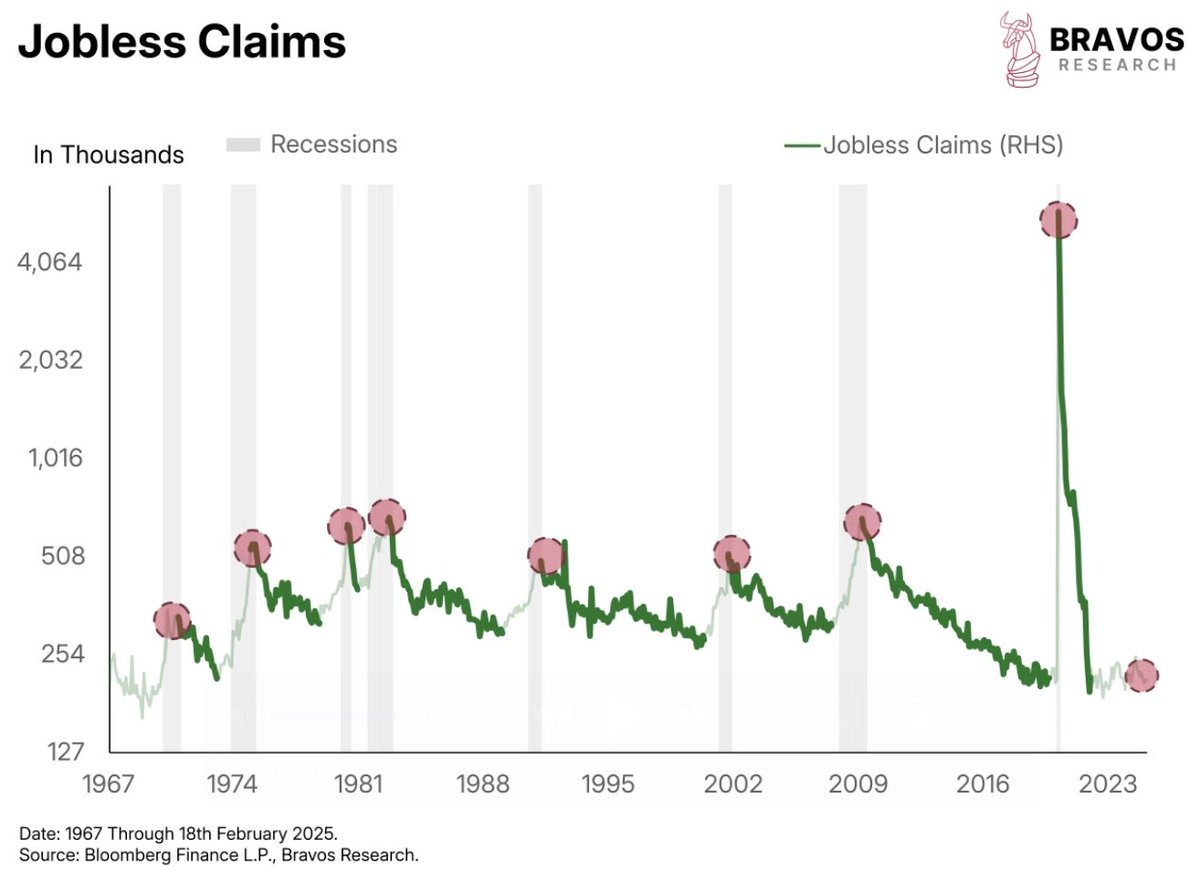
7/ At the beginning of a business cycle, jobless claims are typically high, leaving room for improvement

Right now, jobless claims are near historic lows, which could signal that the cycle is nearing its peak Image
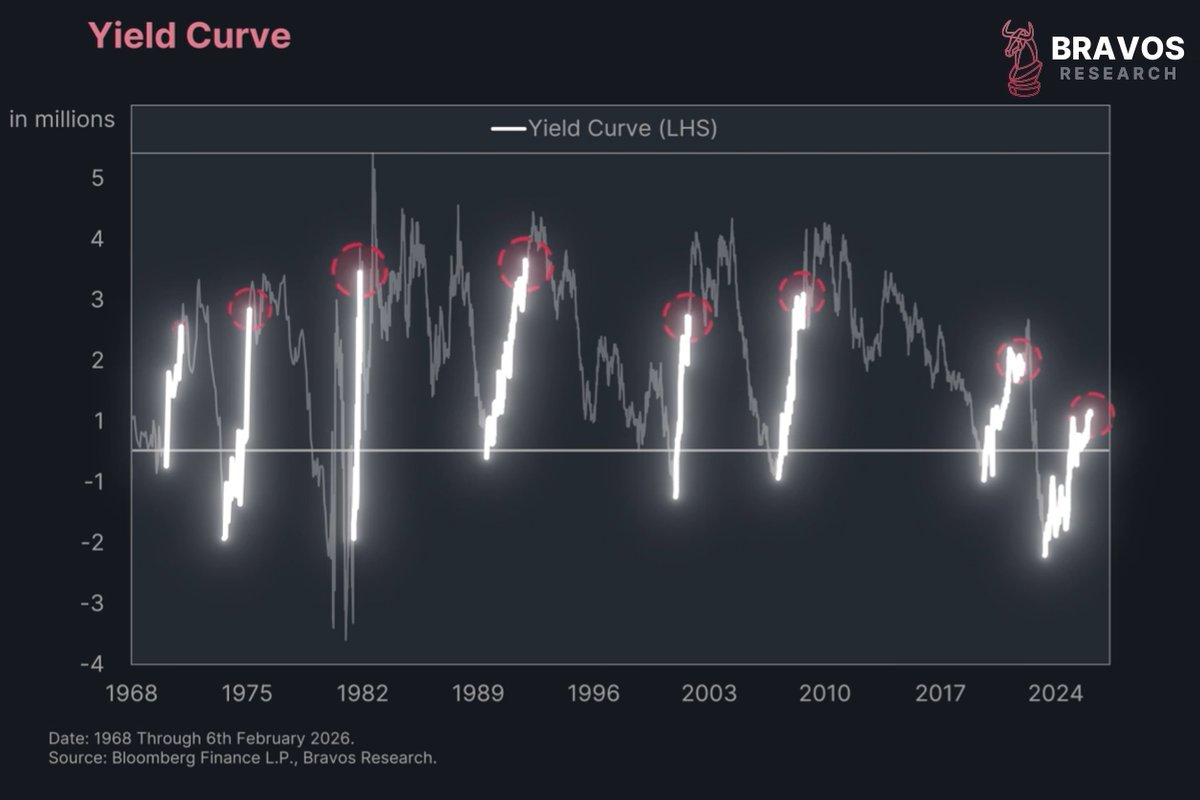
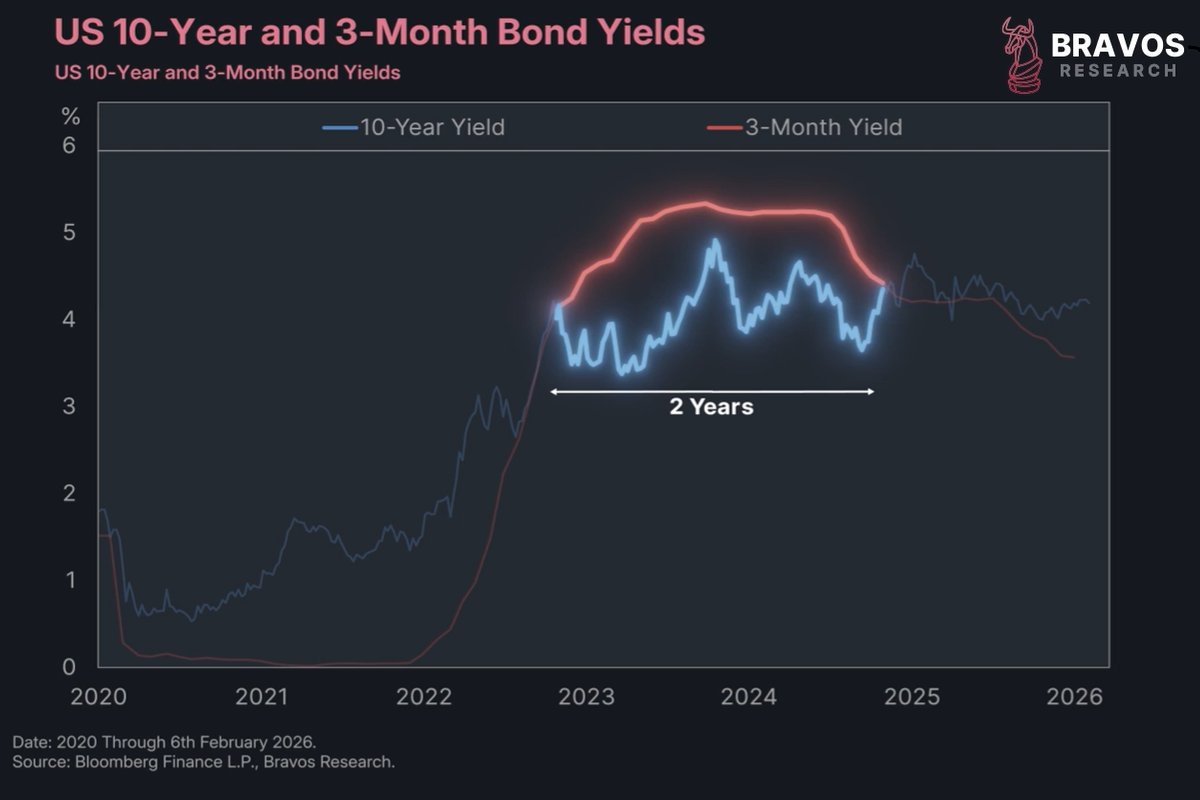
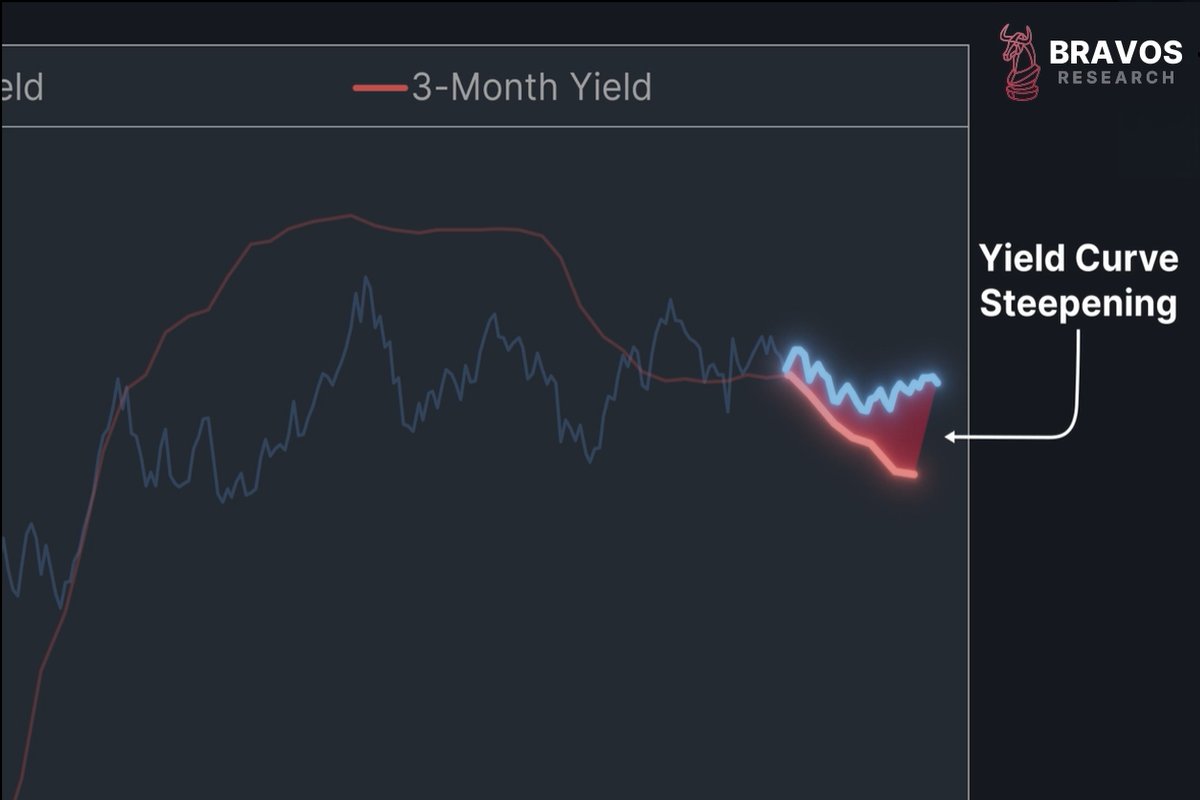
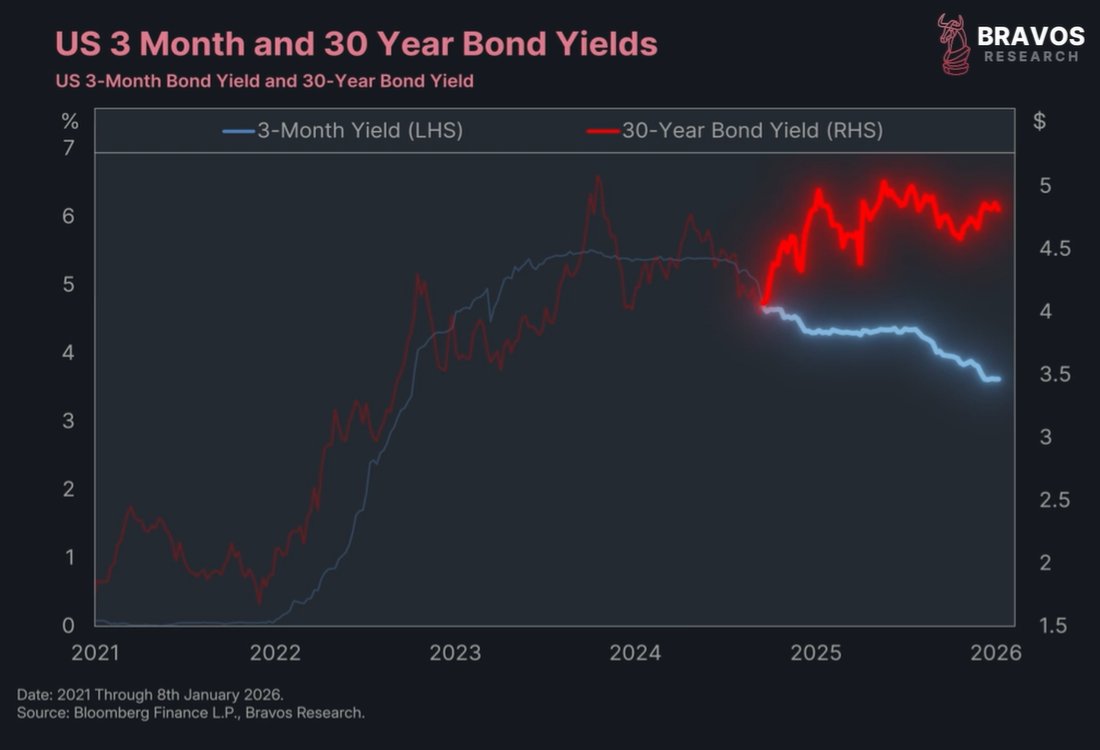
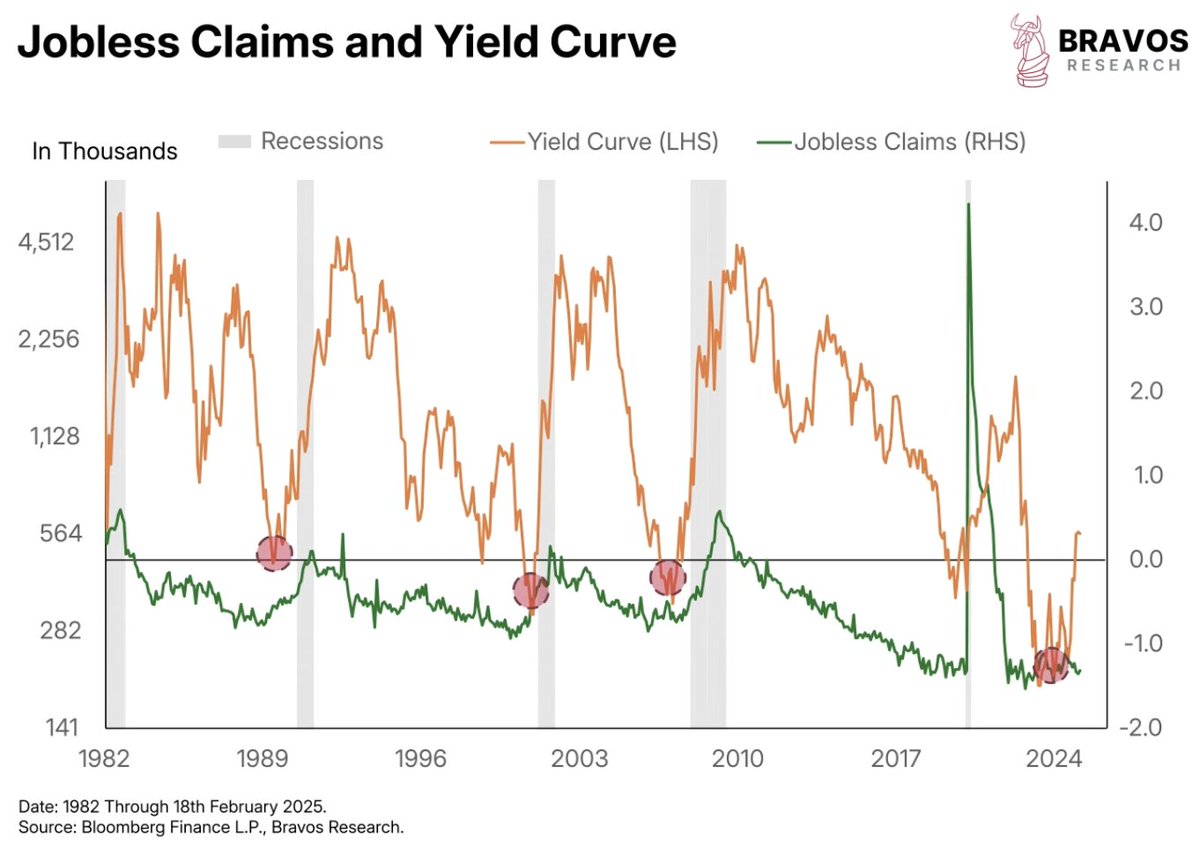
8/ The yield curve is another classic recession warning

While we’ve extended our recession forecast to 2026, that still puts a potential downturn during Trump’s term

Again, not necessarily because of his policies, but where we are in the business cycle Image
9/ At Bravos Research, we stay apolitical and focus solely on objective, data-driven analysis

Trading success relies on probabilities, consistent strategies, and managing risk - not political opinions

Get real-time Trade Alerts with a 30% DISCOUNT at:

bit.ly/BravosResearch
10/ Thanks for reading!

If you enjoyed this thread, please ❤️ and 🔁 the first tweet below

And follow @bravosresearch for more market insights, finance and investment strategies

• • •

Missing some Tweet in this thread? You can try to force a refresh
 

Keep Current with Bravos Research

Bravos Research Profile picture

Stay in touch and get notified when new unrolls are available from this author!

Read all threads

This Thread may be Removed Anytime!

PDF

Twitter may remove this content at anytime! Save it as PDF for later use!

Try unrolling a thread yourself!

how to unroll video
  1. Follow @ThreadReaderApp to mention us!

  2. From a Twitter thread mention us with a keyword "unroll"
@threadreaderapp unroll

Practice here first or read more on our help page!

More from @bravosresearch

Feb 6
Japan’s $10 TRILLION debt meltdown is about to hit the US

Buckle up.

A thread 🧵 Image
2/ For years, Japan was seen as the epicenter of global sovereign debt risk, but this has now changed.

In just the past few weeks, we’ve seen a major shift, with currency and debt risk moving from Japan to the US. Image
3/ This is showing up clearly in the US dollar index breaking a structural uptrend that’s been intact since 2011.

The playbook we’ve been outlining for months is now playing out.

And we’re witnessing the most coordinated policy shift since the Plaza Accord of 1985. Image
Read 26 tweets
Jan 30
The US stock market is near all-time highs in dollar terms

But is down 45% when measured in gold terms

What does this mean for the economy and financial markets?

A thread 🧵 Image
2/ The shifts unfolding today in the global monetary system, the geopolitical order, and global trade have major implications for the markets.

Yet most people are completely misreading what is truly happening in the financial markets. Image
3/ This chart shows the US stock market against the US economic policy uncertainty index.

In early 2025, the US stock market and US economic uncertainty index mostly moved together.

But over the past year, we’ve seen a clear divergence slowly build between these 2 lines. Image
Read 23 tweets
Jan 26
Donald Trump wants the US economy to keep outperforming

But he also wants a weaker dollar to support re-industrialization

This would require breaking a major relationship that’s existed since the 1960s

A thread 🧵 Image
2/ The US government has a problem.

For decades, interests of the government and the Federal Reserve were aligned.

But these interests are now diverging and this could lead to the single greatest shift in US financial history. Image
3/ The US economic strategy of the last 30-years can be captured in 1 chart.

This chart shows the Trade Balance versus the Capital Account Balance.

The trade balance shows whether the US imports or exports more goods.

The capital account shows whether foreigners buy US assets or the US buys foreign ones.Image
Read 25 tweets
Jan 15
The US bond market is beginning to break

Long-term yields are still rising

While short-term yields are falling

History shows this is a MAJOR warning signal

A thread 🧵 Image
2/ 1 of the most fundamental relationships in financial markets is breaking right now.

In the last 1-year, the 30-year Treasury yield has been rising while the 3-month Treasury yield has been falling.

This divergence signals that the monetary policy is breaking. Image
3/ The 3-month yield is effectively set by the US Federal Reserve.

And the 30-year bond yield is primarily influenced by private investors or foreign governments.

These private investors are often called bond vigilantes.

History shows that their actions can work against what the US central bank is trying to achieve.Image
Read 24 tweets
Jan 9
Truck sales are collapsing, but stocks are hitting record highs

The last 3 times this happened were in 2000, 2008, & 2020

All of them saw an economic recession and a major market crash

Is this time different?

A thread 🧵 Image
2/ This chart shows the aggregate economy index.

When we mark the exact peaks and troughs, they line up precisely with the official start and end dates of recessions. Image
3/ On average, the stock market peaks several months before an economic recession begins.

By the time most people feel economic stress, the stock market is usually already far below its highs.

This leads many to think that stocks are perfect forward indicators of the economy. Image
Read 23 tweets
Dec 23, 2025
Japanese bond yields have just hit 20-year highs

This could trigger a Global Debt Crisis…

A thread 🧵 Image
2/ The yield on Japan’s 30-year bond is starting to close in on the yield of the US 30-year bond.

This narrowing gap could be 1 of the most important global macro developments right now.

Many believe the moment these 2 lines cross could be the trigger that sets off the global debt bubble.Image
3/ Japanese yields are spiking to the highest level in 10 years, making this a major shift in Japan's economic system.

Japan is 1 of the most indebted developed nations, carrying roughly $10 trillion in debt.

That makes it a prime candidate to set off a broader global debt crisis.

And this doesn’t stop with Japan.Image
Read 25 tweets

Did Thread Reader help you today?

Support us! We are indie developers!


This site is made by just two indie developers on a laptop doing marketing, support and development! Read more about the story.

Become a Premium Member ($3/month or $30/year) and get exclusive features!

Become Premium

Don't want to be a Premium member but still want to support us?

Make a small donation by buying us coffee ($5) or help with server cost ($10)

Donate via Paypal

Or Donate anonymously using crypto!

Ethereum

0xfe58350B80634f60Fa6Dc149a72b4DFbc17D341E copy

Bitcoin

3ATGMxNzCUFzxpMCHL5sWSt4DVtS8UqXpi copy

Thank you for your support!

Follow Us!

:(