FinChat just launched Custom Metrics 📊
Here are 10 insane charts you can now build with it:
1. Alphabet - Google Cloud Operating Margin
$GOOGL
Here are 10 insane charts you can now build with it:
1. Alphabet - Google Cloud Operating Margin
$GOOGL

2.) ASML - Average Price per EUV System
ASML's lithography systems are notorious expensive. In fact, in 2023, the average EUV system cost just under $200 million.
$ASML
ASML's lithography systems are notorious expensive. In fact, in 2023, the average EUV system cost just under $200 million.
$ASML

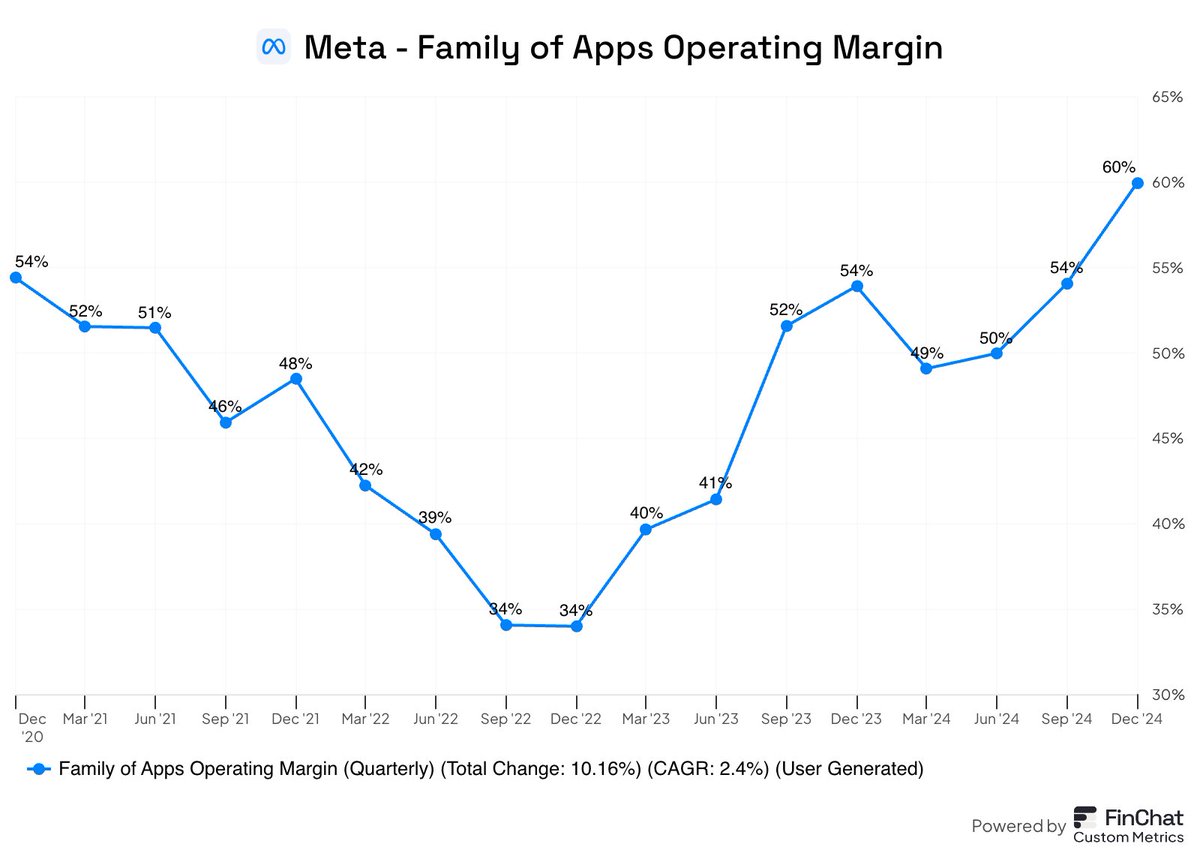
3. Meta - Family of Apps Operating Margin
Meta's Family of Apps business (Facebook, Instagram, WhatsApp, etc.) reached record profitability last quarter with 60% operating margins.
$META
Meta's Family of Apps business (Facebook, Instagram, WhatsApp, etc.) reached record profitability last quarter with 60% operating margins.
$META
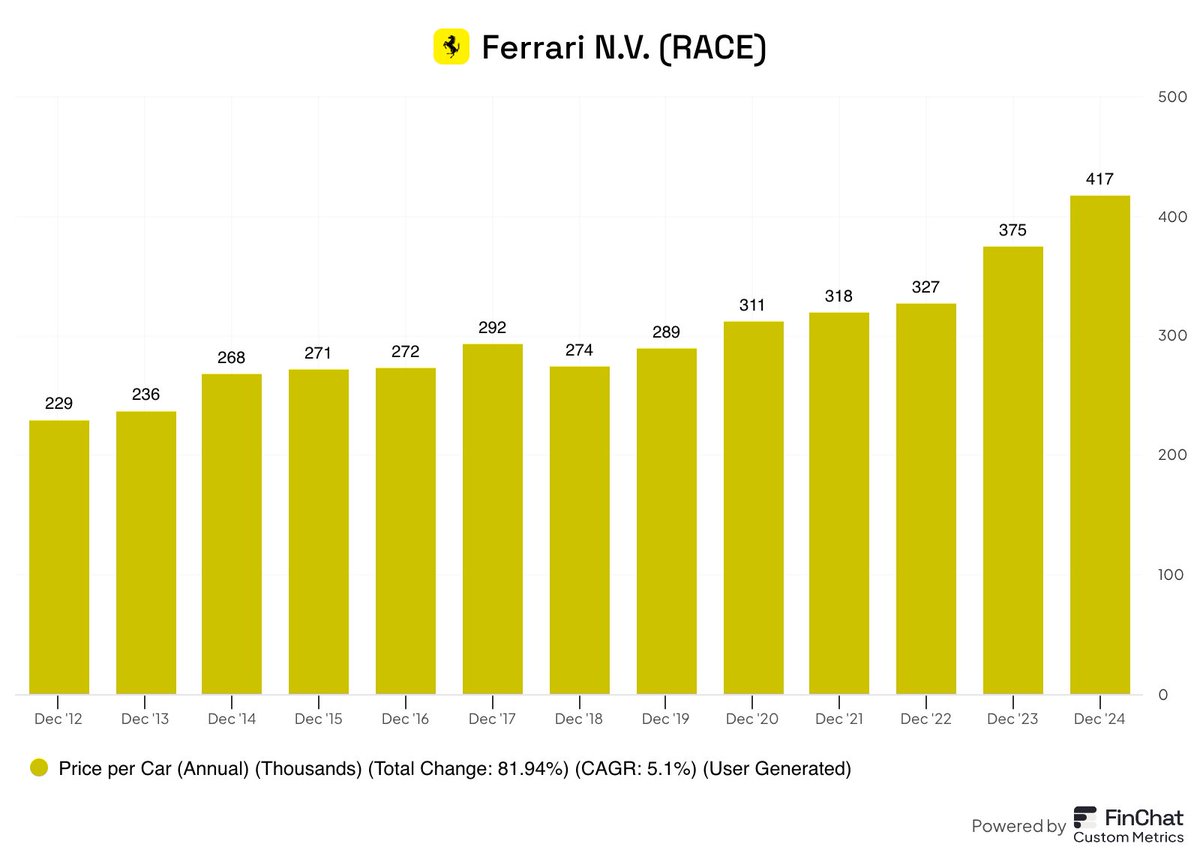
4. Ferrari - Average Price per Car
In 2024, the average price of a Ferrari was north of $400k. Talk about pricing power.
$RACE
In 2024, the average price of a Ferrari was north of $400k. Talk about pricing power.
$RACE
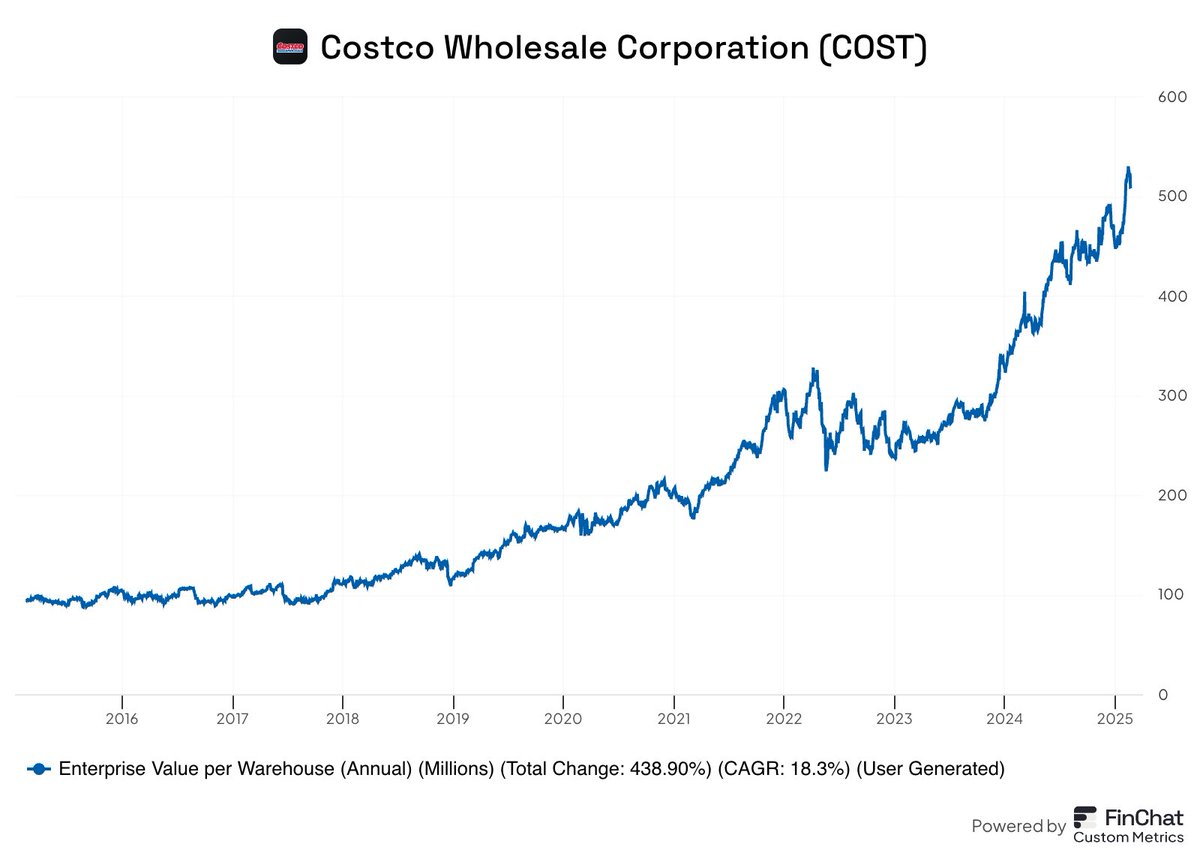
5. Costco - Enterprise Value per Warehouse
The average Costco warehouse is currently valued at $509 million!
$COST
The average Costco warehouse is currently valued at $509 million!
$COST
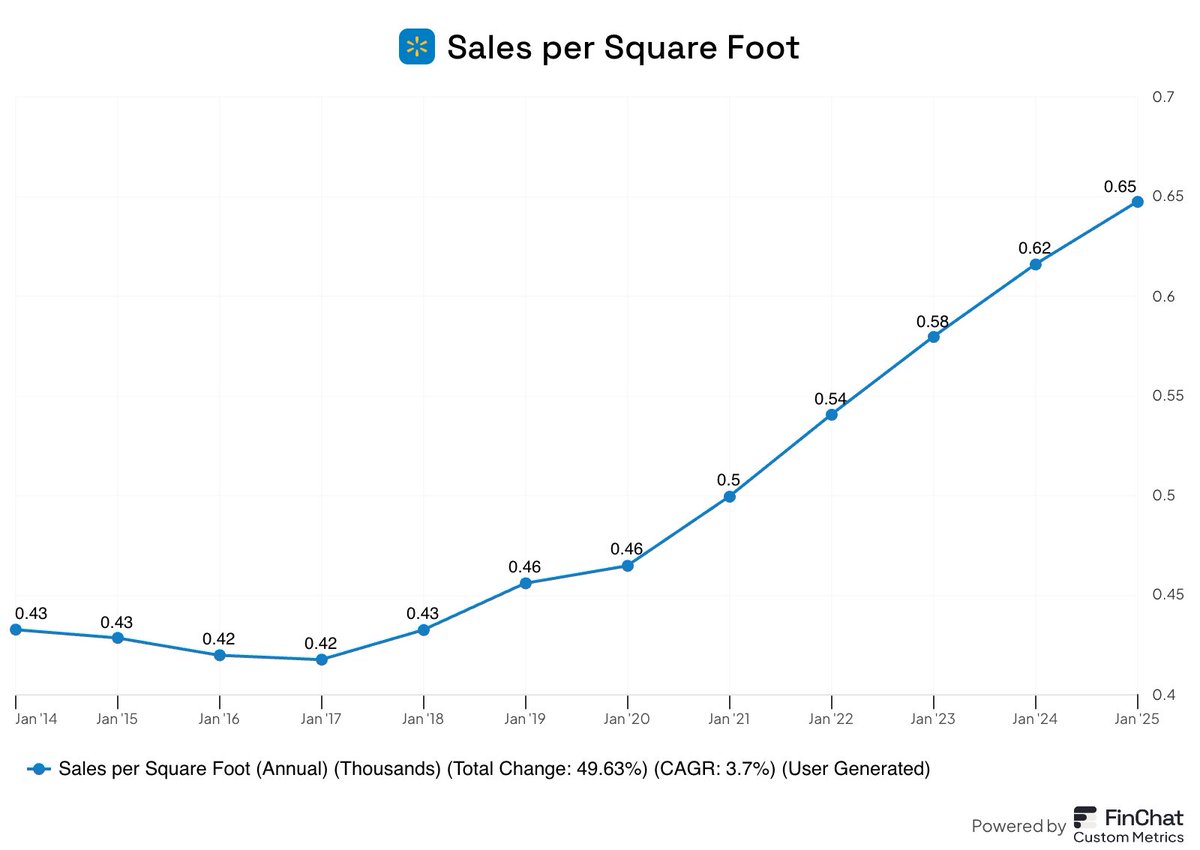
6. Walmart - Sales per Square Foot
Last year Walmart averaged $650 of sales per square foot. That's up ~50% from a decade ago.
$WMT
Last year Walmart averaged $650 of sales per square foot. That's up ~50% from a decade ago.
$WMT
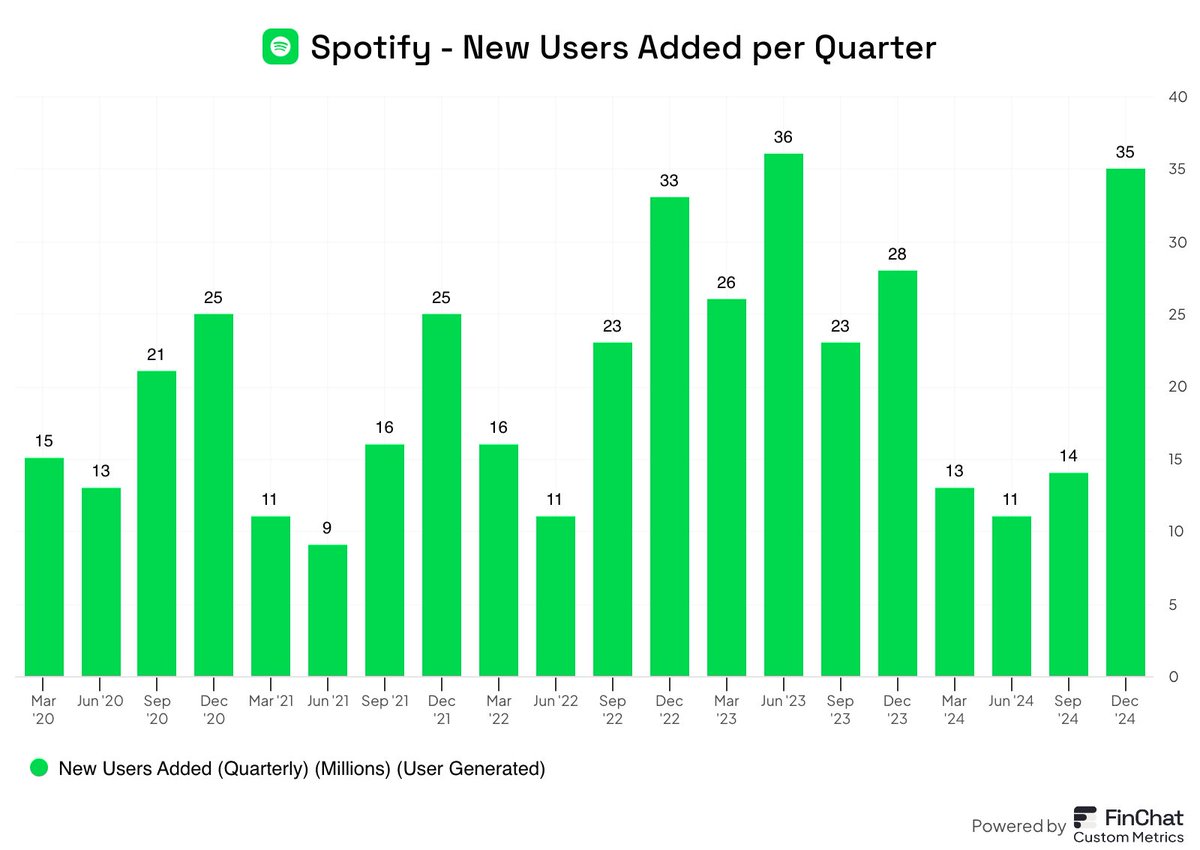
7. Spotify - New Users Added per Quarter
Last quarter Spotify added 35 million new MAUs. The 2nd highest quarter in the company's history.
$SPOT
Last quarter Spotify added 35 million new MAUs. The 2nd highest quarter in the company's history.
$SPOT
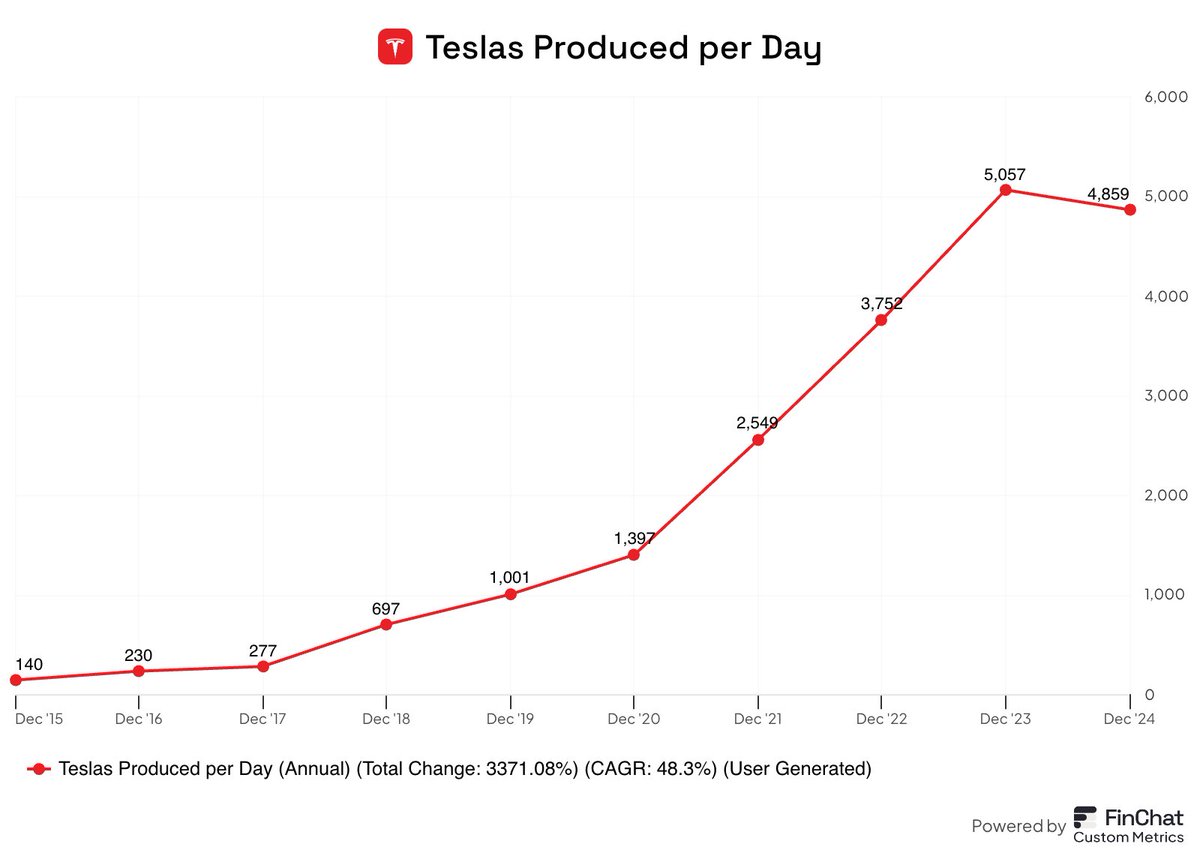
8. Tesla - Cars Produced per Day
This year, Tesla produced an estimated 4,859 cars every single day. In 2015, they were producing just 140 cars per day.
$TSLA
This year, Tesla produced an estimated 4,859 cars every single day. In 2015, they were producing just 140 cars per day.
$TSLA
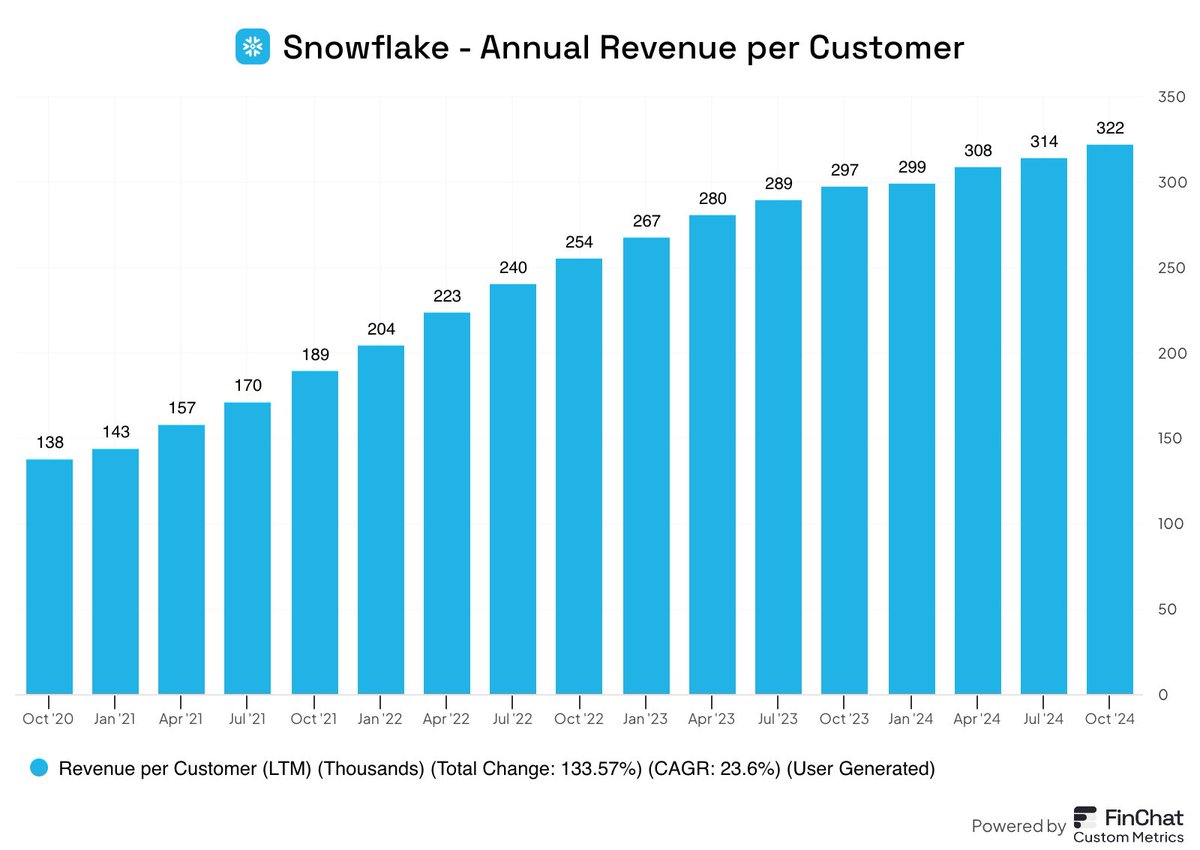
9. Snowflake - Annual Revenue per Customer
Not only is Snowflake growing its customer count, but the average revenue per customer has grown at 23.6% annually over the last 4 years.
$SNOW
Not only is Snowflake growing its customer count, but the average revenue per customer has grown at 23.6% annually over the last 4 years.
$SNOW
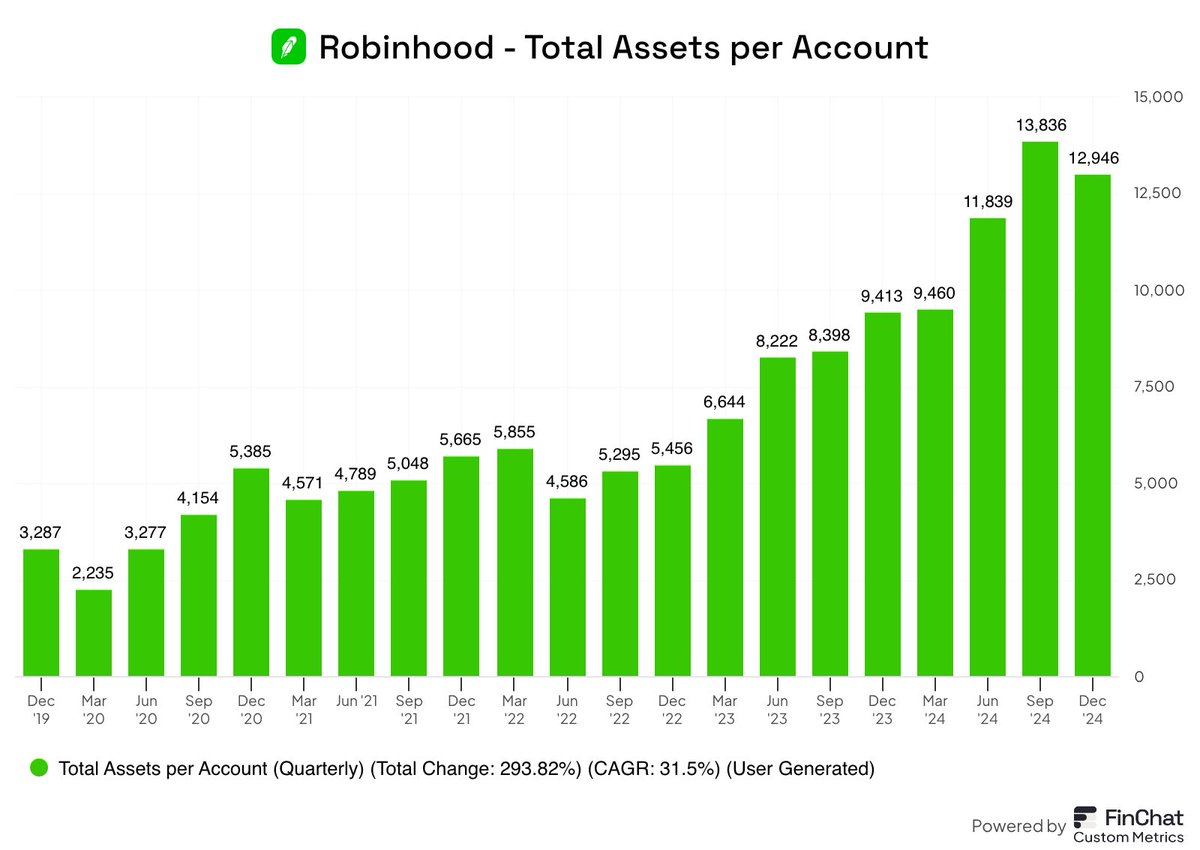
10. Robinhood - Total Assets per Account
Although Robinhood's total users are still down from 2021 highs, the brokerage platform seems to be attracting higher quality users. Average Assets per MAU is ~4x higher than 5 years ago.
$HOOD
Although Robinhood's total users are still down from 2021 highs, the brokerage platform seems to be attracting higher quality users. Average Assets per MAU is ~4x higher than 5 years ago.
$HOOD
• • •
Missing some Tweet in this thread? You can try to
force a refresh