
@FBI & @FBIDirectorKash, This is very important and concerns our national security. Please check your phone and email records at your field office near Columbia, MO. I called my local FBI field office and spoke to an FBI agent, when I lived there for 4 years from 2013-2017, to discuss very important evidence about the 9/11 terrorist attack, which I have provided a preview of below. I first called my local sheriff in Columbia, MO, but he said that the evidence I shared was too important for his team, so he advised me to contact the FBI instead. When I called the local FBI field office, I spoke to an FBI agent who provided me with an email address that I could send the evidence to. I sent the FBI agent the evidence and never heard back from him. No phone reply, no email reply, nothing. I would greatly appreciate it if you could please review the following evidence preview. 🧵
Most people do not understand the 9/11 attacks as well as they think they do, including most 9/11 “truthers.” Please study the evidence.
This table briefly summarizes and compares the various explanations that attempt to address the large body of empirical evidence from 9/11 (table from Dr. Judy Wood's presentation at the 2012 'Breakthrough Energy Movement' conference in Holland). facebook.com/drjudywood/pho… Source: drjudywood.com & vimeo.com/57923364
Dr. Judy Wood, Ph.D | 9/11 Breakthrough Energy Technology youtube.com/watch?v=vadSaW…
IRREFUTABLE 'Introduction to the Evidence' 9/11 Video Series: youtube.com/watch?v=BxA2cZ…
WTC7's destruction may have looked like a conventional controlled demolition, but the observed 'lathering up' process, the minimal seismic impact, and other pieces of empirical evidence from 9/11 conclusively show us that this was not the case. You can even see the WTC buildings disintegrating into fine dust in mid-air with your very own eyes, like Alka-Seltzer tablets in water. The truth is far more important than most people realize, including most 9/11 "truthers."
High Definition Clip of WTC1 Turning to Dust in Midair on 9/11 (Slow Motion) youtube.com/watch?v=dueVm1…
Dustification | Episode 3, IRREFUTABLE: Classified Free-Energy Technology Revealed to the World youtube.com/watch?v=x2IMiQ…
WTC1 Literally Turning to Dust ("Lathering Up") on 9/11 [45x Speed] facebook.com/drjudywood/vid…
Media Acknowledges Steel Turned to Dust on 9/11 (Full Clip) | ABC News youtube.com/watch?v=eJb-GP…
WTC7 underwent a 'lathering up' process prior to its destruction, similar to WTC1. Large quantities of dust spontaneously poured from virtually the entire south face of the building for hours before it was finally destroyed. The office fires in WTC7 were contained to only a few floors. This dust / 'lather' is clearly not smoke from those small office fires. This process was captured on video, and a link to some of that video recording is included below. This is one of the many pieces of forensic evidence from 9/11 that are not explained by thermal or kinetic forces of any kind (e.g. airplanes, jet fuel, explosives, thermite, nuclear bombs).
WTC7 Lathering Up (Closeup) [at 9:10 into video]: youtube.com/watch?v=V_AoDy…
WTC7 Lathering Up (Timelapse): youtube.com/watch?v=YCtfQJ…
WTC1 Lathering Up (Timelapse): youtube.com/watch?v=cDoWaa…
Even Richard Gage, the leader of 'Architects & Engineers for 9/11 Truth' (AE911Truth), admitted to me that thermite does not explain the evidence from 9/11, and that he has not studied the important Columbia University NYC seismographic data. He also lies to the public and censors the many pieces of evidence that thermite can't explain. I recorded his suspicious responses on video when I questioned him at a presentation in Peoria, IL.
Richard Gage Questioned at AE911Truth Presentation (4/12/2011) by Medical Student youtube.com/watch?v=qBP9mN…
Thermal and kinetic forces of any kind are not consistent with the large body of evidence from 9/11. Most evidence suggestive of explosives or thermite is testimonial in nature, such as witnesses "hearing explosions" or "seeing molten liquid". Testimonial evidence is the weakest form of evidence because people are often mistaken, biased, and/or repeating things they heard from others. Loud, explosive noises can be caused by many things, and it's very likely that items were independently exploding as the buildings were transformed to dust. Please also keep in mind that glowing objects or liquids do not directly imply hot or molten steel, as many objects glow or melt under lower stresses and temperatures. As for the small amount of empirical evidence for thermite, such as the study that allegedly found thermite in WTC dust samples, this could be explained by many common, logical things, which are discussed at these links:
Thermic Lances Used To Cut Steel Beams during WTC Ground Zero Cleanup | 9/11 Myths: youtube.com/watch?v=5VskSi…
WTC Steel Columns Cut at Angles During 9/11 Ground Zero Cleanup | 9/11 Myths: youtube.com/watch?v=DdBv7u…
9/11 "Pull It" WTC Building Demolition via Pulling Cables | 9/11 Myths: youtube.com/watch?v=cUZtTQ…
9/11 Ground Zero Molten Steel or Work Lights? | 9/11 Myths: youtube.com/watch?v=xEfjmv…
9/11 WTC Explosive Demolition is NOT Supported by the Evidence | 9/11 Myths: youtube.com/watch?v=DMNNPn…
Copper thermite is used for creating electric joints in building construction ('cadwelding'): en.wikipedia.org/wiki/Exothermi…
Cad Weld - Copper Ground to Rebar: youtube.com/watch?v=u3p9Py…
Steven Jones proves primer paint, not thermite: oystein-debate.blogspot.com/2011/03/steven…
Bentham Open Access Publishing Accepts Nonsense Manuscript for Dollars: scholarlykitchen.sspnet.org/2009/06/10/non…
Bentham Science Publishing Editors Quit After Fake Paper Accepted: legacy.earlham.edu/~peters/fos/20…
No Thermite on 9/11?! | Thermite Does NOT Explain the Evidence! youtube.com/watch?v=LkRjXA…
Melting Aluminum In The Foundry: metalwebnews.com/howto/furnace2…
Aluminum Glows: drjudywood.com/articles/alumi…
Thermite and Glowing Liquid Aluminum (Section IV): drjudywood.com/articles/why/w…
Please study the large and conclusive body of verifiable, physical evidence from 9/11, including the Columbia University NYC seismographic data, University of Alaska magnetometer data, United States Geological Survey (USGS) dust analysis, National Aeronautics and Space Administration (NASA) AVIRIS thermal imaging, NASA AVIRIS dust and iron (ferrous/ferric) spectrometer imaging, 7 total WTC buildings destroyed on 9/11, WTC1 & 2 steel turning to dust in midair, WTC1 'lathering up', WTC7 'lathering up', WTC2 falling dust trails, WTC1 & 2 minimal seismic impact, WTC7 minimal seismic impact, WTC lack of P-wave seismic signal, National Oceanic and Atmospheric Administration (NOAA) verified Hurricane Erin (category 3), WTC1 & 2 rapid speed of destruction, WTC1 & 2 top-down direction of destruction, WTC7 'free fall' destruction, disappearance of most of WTC4, vertical cylindrical holes in surrounding WTC buildings, relative lack of rubble compared to explosive controlled demolitions, lack of major damage to surrounding non-WTC buildings other than Bankers Trust, rapid spontaneous rusting of WTC metals, rapid spontaneous rusting of Bankers Trust metals, 1400+ 'toasted' and warped cars up to 1/2 mile away, numerous flipped cars, spontaneous 'weird' fires, ground zero fuming for years without high heat, truck loads of fresh dirt being hauled in and out of ground zero for years, numerous unharmed survivors in WTC stairwells, mostly undamaged WTC shopping mall, mostly undamaged PATH trains, mostly undamaged WTC 'Bathtub' foundation, presence of dust 'fuzzballs', strange round window holes, shriveled WTC steel beams, strangely curved steel beams, wavy steel beams, vertical axis 'rolling up' of steel beams, thinning of steel beams, holes in steel beams, Bankers Trust warped and shriveled metal beams, objects fusing with unburned paper, missing file cabinets, missing office machinery, missing office furniture, missing toilets, missing door knobs, lack of high heat, cool temperature of WTC dust, unburned paper, unburned clothing, unburned pedestrians, elevated levels of tritium, lack of ionizing radiation, glowing and molten materials, spontaneous explosion of Scott air tanks, numerous similarities between 'The Hutchison Effect' and phenomena observed at ground zero, and much more.
The large body of empirical evidence from 9/11 is overwhelmingly conclusive, because there is only one thing that can explain it all, and nothing else comes close. Only the general category of weapon technology known as 'directed energy weapons' (DEW) can explain all of the empirical evidence from 9/11, and it does so completely and irrefutably.
WhereDidTheTowersGo.com
DrJudyWood.com
CheckTheEvidence.com
Facebook.com/DrJudyWood


Hurricane Erin (category 3) traveled in a straight line towards New York City for 4-5 days from September 7th-11th 2001, reaching its closest point to land, just off the coast, on the morning of 9/11/2001. Despite Hurricane Erin's threatening trajectory, we suspiciously weren't warned by most corporate news broadcasts in the days leading up to 9/11, or on the morning of 9/11. When most corporate news channels displayed schematic weather maps of the northeast U.S. coastline, Hurricane Erin was not shown. Hurricane Erin was similar in size to Hurricane Katrina and similar in strength to Hurricane Sandy (category 3), and hurricanes rarely head straight for NYC, yet we weren't warned by most corporate news outlets that Hurricane Erin was heading straight for densely populated New York City.
Hurricane Erin - Pt.1 Manufactured Storm | IRREFUTABLE Episode 6 youtube.com/watch?v=bhbZNO…
Video Compilation of Local News Weather Reports from September 11th 2001 youtube.com/watch?v=1xWjdY…
Astonishingly, Hurricane Erin reached its closest point to NYC on the morning of September 11th 2001, before it did a sudden ~150° turn away from its straight-line trajectory later that day and headed back out to sea. Hurricane Erin got so close to NYC that thunder and rain were reported and/or measured at nearby international airports, including Newark, JFK, and LaGuardia, even though skies were clear in NYC. It is widely known that major corporate media outlets do not hesitate to report on category 3 hurricanes that are heading straight for the east coast. Instead, they warn people that a hurricane is coming, and they report on it frequently, giving regular updates and alerting the public in case a potential evacuation becomes necessary, and so preparations can be made.
Furthermore, if one studies Atlantic hurricane paths tracked from 1995 to 2010, one can easily see that Hurricane Erin's path is unique in its suddenly getting locked onto a straight line towards NYC and the 2001 magnetic north pole, along the minus-15 declination line of earth's magnetic field for 4+ days, then making a strange ~150° turn after reaching its closest point to NYC, before heading northeast away from the U.S. eastern coast. Turns of 45° to 90° are fairly common for northern Atlantic hurricanes, but not ~150°. Official NOAA & UW-CIMSS Hurricane Erin tracking information, Farmer's Almanac airport weather records, and a video compilation of corporate news clips and weather reports from the morning of September 11th, 2001 are provided below.
Hurricane Erin, a category 3 hurricane, during mid-morning on 9/11/01. Notice how close Hurricane Erin is to New York City. A column of dust can be seen coming from ground zero, and the hurricane's eye has an unusual appearance. Why didn't the morning news inform us about the category 3 hurricane that was headed straight for NYC on 9/11?
facebook.com/photo.php?fbid…
(9/11/01) Source: svs.gsfc.nasa.gov/vis/a000000/a0…
Hurricane Erin (category 3) approaches New York City during mid-morning on 9/11/01. Notice how close Hurricane Erin is to NYC. A column of dust can be seen coming from ground zero. Why didn't the morning news inform us about the category 3 hurricane that was headed straight for NYC on 9/11?
facebook.com/photo.php?fbid…
(9/11/01) Source: svs.gsfc.nasa.gov/vis/a000000/a0…
Hurricane Erin (category 3) approaches New York City during mid-morning on 9/11/01. Notice how close Hurricane Erin is to NYC. A column of dust can be seen coming from ground zero, and the western edge of Hurricane Erin can be seen at the bottom of the photo. Why didn't the morning news inform us about the category 3 hurricane that was headed straight for NYC on 9/11?
facebook.com/photo.php?fbid…
(9/11/01) Source: svs.gsfc.nasa.gov/vis/a000000/a0…
Hurricane Erin got so close to NYC that rough seas and sea swells were reported by many news channels. There are also reports that thunder and/or rain were reported at nearby international airports, including Newark, JFK, and LaGuardia, even though skies were clear in NYC.
National Oceanic & Atmospheric Administration (NOAA) National Hurricane Center 'Best Track' figure showing the recorded path of Hurricane Erin from September 1-17, 2001. Notice the hurricane was headed straight for NYC for several days, reaching its nearest point to NYC on the morning of 9/11. If one studies Atlantic hurricane paths tracked from 1995 to 2010, one can easily see that Hurricane Erin's path is unique in its suddenly getting locked onto a straight line towards NYC along the minus-15 declination line of earth's magnetic field for 4+ days, then making a strange ~150° turn after reaching its closest point to NYC, before heading northeast away from the U.S. eastern coast. Turns of 45° to 90° are fairly common for northern Atlantic hurricanes, but not ~150°.
facebook.com/photo.php?fbid…
Sources:
1. nhc.noaa.gov/prelims/2001er…
2. nhc.noaa.gov/2001erin.html
3. weather.about.com/od/hurricanes/…
Cooperative Institute for Meteorological Satellite Studies at the University of Wisconsin-Madison figure showing the recorded path of Hurricane Erin from September 1-15, 2001. Notice that the hurricane was headed straight for NYC for several days, reaching its nearest point to NYC on 9/11. If one studies Atlantic hurricane paths tracked from 1995 to 2010, one can easily see that Hurricane Erin's path is unique in its suddenly getting locked onto a straight line towards NYC along the minus-15 declination line of earth's magnetic field for 4+ days, then making a strange ~150° turn after reaching its closest point to NYC, before heading northeast away from the U.S. eastern coast. Turns of 45° to 90° are fairly common for northern Atlantic hurricanes, but not ~150°.
facebook.com/photo.php?fbid…
Sources:
1. tropic.ssec.wisc.edu/storm_archive/…
2. weather.about.com/od/hurricanes/…
Official NOAA 2010 Atlantic hurricane season map showing wind speeds, category levels, and tracked paths. Each storm is color coded and labeled with the name of the storm. If one studies Atlantic hurricane paths tracked from 1995 to 2010, one can easily see that Hurricane Erin's path is unique in its suddenly getting locked onto a straight line towards NYC along the minus-15 declination line of earth's magnetic field for 4+ days, then making a strange ~150° turn after reaching its closest point to NYC, before heading northeast away from the U.S. eastern coast. Turns of 45° to 90° are fairly common for northern Atlantic hurricanes, but not ~150°.
facebook.com/photo.php?fbid…
Source:
1. noaanews.noaa.gov/stories2010/im…
2. weather.about.com/od/imagegaller…
3. weather.about.com/od/hurricanes/…
NBC Morning News forecast on September 11th, 2001. Where is Hurricane Erin? The hurricane was headed straight for NYC for several days, reaching its nearest point to NYC on 9/11. Why didn't the morning news inform us about the category 3 hurricane that was headed straight for NYC on 9/11?
facebook.com/photo.php?fbid…
Video: youtube.com/watch?v=1xWjdY…
CBS Morning News forecast on September 11th, 2001. Where is Hurricane Erin? The hurricane was headed straight for NYC for several days, reaching its nearest point to NYC on 9/11. Why didn't the morning news inform us about the category 3 hurricane that was headed straight for NYC on 9/11?
facebook.com/photo.php?fbid…
Video: youtube.com/watch?v=1xWjdY…
Video compilation of news clips and weather reports from the morning of September 11th 2001: youtube.com/watch?v=1xWjdY…
These are some of the many pieces of empirical evidence from 9/11 that are not explained by thermal or kinetic forces of any kind (e.g. airplanes, jet fuel, explosives, thermite, nuclear bombs).
WhereDidTheTowersGo.com
DrJudyWood.com
CheckTheEvidence.com
Facebook.com/DrJudyWood


University of Alaska magnetometer stations detected normal readings in the days leading up to 9/11, but detected a significant electromagnetic disturbance in the Earth's magnetosphere precisely as the 9/11 attacks occurred. Why were there significant fluctuations in the Earth's magnetosphere at the very same time of the 9/11 attacks, as recorded by 6 different University of Alaska magnetometer stations?
According to the Geostationary Operational Environmental Satellites (GOES), and as described on Page 425-426 of Dr. Judy Wood's textbook 'Where Did The Towers Go?', there were no solar storms or other significant space-weather events in the days leading up to 9/11, or during the 9/11 attacks, that could account for the significant magnetometer fluctuations detected by the University of Alaska.
Source: satdat.ngdc.noaa.gov/sem/goes/data/…
University of Alaska magnetometer stations detected normal readings in the days leading up to 9/11, but detected a significant electromagnetic disturbance in the Earth's magnetosphere precisely as the 9/11 attacks occurred. This chart was plotted by Dr. Judy Wood using the raw University of Alaska magnetometer data found at the source link below, for better visual comparison of the data. A link to a larger version of this graph is also available below. Why were there significant fluctuations in the Earth's magnetosphere at the very same time of the 9/11 attacks, as recorded by 6 different University of Alaska magnetometer stations?
facebook.com/photo.php?fbid…
Source: magnet.gi.alaska.edu/table_index/20…
Larger: drjudywood.com/articles/erin/…
University of Alaska 'Arctic Village' magnetometer deviation tracings in gammas for September 11th, 2001. The horizontal ('X') axis shows time in Coordinated Universal Time (UTC). The vertical ('Y') axis shows magnetosphere deviation on a scale of 250 nano-Tesla per grid line. The mean value (in nano-Tesla) printed off the right hand edge of the plot is the average magnetic field strength for that day for each component. The magnetic deviation displayed is computed from that value. The H-component (deviations down indicate the local field has dipped southward) has the greatest deviations in that direction and so is plotted on top. The D-component dips are magnetic west deviations as the magnetometer head is oriented in magnetic coordinates not geographic. The Z component is vertical component. Each of the three components is offset by 2 vertical grid boxes (500 nT) where the component letter indicator off the left and the mean value on the right indicate the zero reference point for each curve. This was done so each component could be identified separately and does not reflect the absolute magnitude of the magnetic field of the component.
facebook.com/photo.php?fbid…
Source: magnet.asf.alaska.edu/cgi-bin/displa…
University of Alaska 'Bettles' magnetometer deviation tracings in gammas for September 11th, 2001. The horizontal ('X') axis shows time in Coordinated Universal Time (UTC). The vertical ('Y') axis shows magnetosphere deviation on a scale of 250 nano-Tesla per grid line. The mean value (in nano-Tesla) printed off the right hand edge of the plot is the average magnetic field strength for that day for each component. The magnetic deviation displayed is computed from that value. The H-component (deviations down indicate the local field has dipped southward) has the greatest deviations in that direction and so is plotted on top. The D-component dips are magnetic west deviations as the magnetometer head is oriented in magnetic coordinates not geographic. The Z component is vertical component. Each of the three components is offset by 2 vertical grid boxes (500 nT) where the component letter indicator off the left and the mean value on the right indicate the zero reference point for each curve. This was done so each component could be identified separately and does not reflect the absolute magnitude of the magnetic field of the component.
facebook.com/photo.php?fbid…
Source: magnet.asf.alaska.edu/cgi-bin/displa…
University of Alaska 'CIGO College Observatory' magnetometer deviation tracings in gammas for September 11th, 2001. The horizontal ('X') axis shows time in Coordinated Universal Time (UTC). The vertical ('Y') axis shows magnetosphere deviation on a scale of 250 nano-Tesla per grid line. The mean value (in nano-Tesla) printed off the right hand edge of the plot is the average magnetic field strength for that day for each component. The magnetic deviation displayed is computed from that value. The H-component (deviations down indicate the local field has dipped southward) has the greatest deviations in that direction and so is plotted on top. The D-component dips are magnetic west deviations as the magnetometer head is oriented in magnetic coordinates not geographic. The Z component is vertical component. Each of the three components is offset by 2 vertical grid boxes (500 nT) where the component letter indicator off the left and the mean value on the right indicate the zero reference point for each curve. This was done so each component could be identified separately and does not reflect the absolute magnitude of the magnetic field of the component.
facebook.com/photo.php?fbid…
Source: magnet.asf.alaska.edu/cgi-bin/displa…
According to the Geostationary Operational Environmental Satellites (GOES), and as described on Page 425-426 of Dr. Judy Wood's textbook 'Where Did The Towers Go?', there were no solar storms or other significant space-weather events in the days leading up to 9/11, or during the 9/11 attacks, that could account for the significant magnetometer fluctuations detected by the University of Alaska.
Source: satdat.ngdc.noaa.gov/sem/goes/data/…
These are some of the many pieces of empirical evidence from 9/11 that are not explained by thermal or kinetic forces of any kind (e.g. airplanes, jet fuel, explosives, thermite, nuclear bombs).
WhereDidTheTowersGo.com
DrJudyWood.com
CheckTheEvidence.com
Facebook.com/DrJudyWood
According to the Geostationary Operational Environmental Satellites (GOES), and as described on Page 425-426 of Dr. Judy Wood's textbook 'Where Did The Towers Go?', there were no solar storms or other significant space-weather events in the days leading up to 9/11, or during the 9/11 attacks, that could account for the significant magnetometer fluctuations detected by the University of Alaska.
Source: satdat.ngdc.noaa.gov/sem/goes/data/…
University of Alaska magnetometer stations detected normal readings in the days leading up to 9/11, but detected a significant electromagnetic disturbance in the Earth's magnetosphere precisely as the 9/11 attacks occurred. This chart was plotted by Dr. Judy Wood using the raw University of Alaska magnetometer data found at the source link below, for better visual comparison of the data. A link to a larger version of this graph is also available below. Why were there significant fluctuations in the Earth's magnetosphere at the very same time of the 9/11 attacks, as recorded by 6 different University of Alaska magnetometer stations?
facebook.com/photo.php?fbid…
Source: magnet.gi.alaska.edu/table_index/20…
Larger: drjudywood.com/articles/erin/…
University of Alaska 'Arctic Village' magnetometer deviation tracings in gammas for September 11th, 2001. The horizontal ('X') axis shows time in Coordinated Universal Time (UTC). The vertical ('Y') axis shows magnetosphere deviation on a scale of 250 nano-Tesla per grid line. The mean value (in nano-Tesla) printed off the right hand edge of the plot is the average magnetic field strength for that day for each component. The magnetic deviation displayed is computed from that value. The H-component (deviations down indicate the local field has dipped southward) has the greatest deviations in that direction and so is plotted on top. The D-component dips are magnetic west deviations as the magnetometer head is oriented in magnetic coordinates not geographic. The Z component is vertical component. Each of the three components is offset by 2 vertical grid boxes (500 nT) where the component letter indicator off the left and the mean value on the right indicate the zero reference point for each curve. This was done so each component could be identified separately and does not reflect the absolute magnitude of the magnetic field of the component.
facebook.com/photo.php?fbid…
Source: magnet.asf.alaska.edu/cgi-bin/displa…
University of Alaska 'Bettles' magnetometer deviation tracings in gammas for September 11th, 2001. The horizontal ('X') axis shows time in Coordinated Universal Time (UTC). The vertical ('Y') axis shows magnetosphere deviation on a scale of 250 nano-Tesla per grid line. The mean value (in nano-Tesla) printed off the right hand edge of the plot is the average magnetic field strength for that day for each component. The magnetic deviation displayed is computed from that value. The H-component (deviations down indicate the local field has dipped southward) has the greatest deviations in that direction and so is plotted on top. The D-component dips are magnetic west deviations as the magnetometer head is oriented in magnetic coordinates not geographic. The Z component is vertical component. Each of the three components is offset by 2 vertical grid boxes (500 nT) where the component letter indicator off the left and the mean value on the right indicate the zero reference point for each curve. This was done so each component could be identified separately and does not reflect the absolute magnitude of the magnetic field of the component.
facebook.com/photo.php?fbid…
Source: magnet.asf.alaska.edu/cgi-bin/displa…
University of Alaska 'CIGO College Observatory' magnetometer deviation tracings in gammas for September 11th, 2001. The horizontal ('X') axis shows time in Coordinated Universal Time (UTC). The vertical ('Y') axis shows magnetosphere deviation on a scale of 250 nano-Tesla per grid line. The mean value (in nano-Tesla) printed off the right hand edge of the plot is the average magnetic field strength for that day for each component. The magnetic deviation displayed is computed from that value. The H-component (deviations down indicate the local field has dipped southward) has the greatest deviations in that direction and so is plotted on top. The D-component dips are magnetic west deviations as the magnetometer head is oriented in magnetic coordinates not geographic. The Z component is vertical component. Each of the three components is offset by 2 vertical grid boxes (500 nT) where the component letter indicator off the left and the mean value on the right indicate the zero reference point for each curve. This was done so each component could be identified separately and does not reflect the absolute magnitude of the magnetic field of the component.
facebook.com/photo.php?fbid…
Source: magnet.asf.alaska.edu/cgi-bin/displa…
According to the Geostationary Operational Environmental Satellites (GOES), and as described on Page 425-426 of Dr. Judy Wood's textbook 'Where Did The Towers Go?', there were no solar storms or other significant space-weather events in the days leading up to 9/11, or during the 9/11 attacks, that could account for the significant magnetometer fluctuations detected by the University of Alaska.
Source: satdat.ngdc.noaa.gov/sem/goes/data/…
These are some of the many pieces of empirical evidence from 9/11 that are not explained by thermal or kinetic forces of any kind (e.g. airplanes, jet fuel, explosives, thermite, nuclear bombs).
WhereDidTheTowersGo.com
DrJudyWood.com
CheckTheEvidence.com
Facebook.com/DrJudyWood


Why were there matching asymmetric distributions of WTC dust and iron around ground zero after the 9/11 attacks, as shown by NASA AVIRIS imaging from the USGS post-9/11 dust study?
USGS Dust Figure 1b. Dust/Debris plume map, same as previous image, but zoomed in to lower Manhattan. The plume map in Dust Figures 1 and 2 indicate an asymmetry in the dust/debris distribution, with more iron bearing materials to the south by southeast. Why do these maps show an asymmetric distribution of iron bearing materials to the south-southeast of ground zero (steel is mostly iron and carbon)? Similar distribution patterns are seen on the ferric-ferrous map as well as the vibrational absorption map, indicating a consistent finding of asymmetric distribution.
facebook.com/photo.php?fbid…
(9/16/01) Source: pubs.usgs.gov/of/2001/ofr-01…
USGS Dust Figure 2b. Dust/Debris plume map, same as at right, but zoomed in to lower Manhattan. The plume map in Dust Figures 1 and 2 indicate an asymmetry in the dust/debris distribution, with more iron bearing materials to the south by southeast. Why do these maps show an asymmetric distribution of iron bearing materials to the south-southeast of ground zero (steel is mostly iron and carbon)? Similar distribution patterns are seen on the ferric-ferrous map as well as the vibrational absorption map, indicating a consistent finding of asymmetric distribution.
facebook.com/photo.php?fbid…
(9/16/01) Source: pubs.usgs.gov/of/2001/ofr-01…
USGS Iron Figure 1b. Ferrous, ferric iron absorption features map, same as previous image, but zoomed in to lower Manhattan. The map shows an asymmetric distribution of debris that extends to the south-southeast of the WTC complex. The ferric absorptions are interpreted to be due to hematite (Fe2O3 - iron rust), or goethite (FeOOH). The red coatings on iron beams seen in news reports and by are field team are consistent with hematite or goethite. Why do these maps show an asymmetric distribution of iron bearing materials to the south-southeast of ground zero (steel is mostly iron and carbon)? Similar distribution patterns are seen on the dust and debris map as well as the vibrational absorption map, indicating a consistent finding of asymmetric distribution.
facebook.com/photo.php?fbid…
(9/16/01) Source: pubs.usgs.gov/of/2001/ofr-01…
USGS Iron Figure 2b. Ferrous, ferric iron absorption features map, same as pervious image, but zoomed in to lower Manhattan. The map shows an asymmetric distribution of debris that extends to the south-southeast of the WTC complex. The ferric absorptions are interpreted to be due to hematite (Fe2O3 - iron rust), or goethite (FeOOH). The red coatings on iron beams seen in news reports and by are field team are consistent with hematite or goethite. Why do these maps show an asymmetric distribution of iron bearing materials to the south-southeast of ground zero (steel is mostly iron and carbon)? Similar distribution patterns are seen on the dust and debris map as well as the vibrational absorption map, indicating a consistent finding of asymmetric distribution.
facebook.com/photo.php?fbid…
(9/16/01) Source: pubs.usgs.gov/of/2001/ofr-01…
These are some of the many pieces of empirical evidence from 9/11 that are not explained by thermal or kinetic forces of any kind (e.g. airplanes, jet fuel, explosives, thermite, nuclear bombs).
WhereDidTheTowersGo.com
DrJudyWood.com
CheckTheEvidence.com
Facebook.com/DrJudyWood


If the WTC buildings slammed into the ground from a "collapse" or "controlled demolition", why were the Columbia University NYC seismic signals so brief in duration and so weak in magnitude, and why did they lack P and S waves?
-The destruction of WTC1, 09/11/01, Magnitude = 2.3. Notice the significant portion of the seismic activity only lasts about 8 seconds (10:28:48.5-10:28:56.5). In comparison, if a billiard ball was dropped from the roof of WTC1 it would take approximately 9.22 seconds to hit the ground. Why was the seismic activity from the WTC destruction so brief? Furthermore, the destruction of each tower should have registered as magnitude 3.8 or greater on the Richter scale, so why was the seismic activity from the WTC destruction so weak?
facebook.com/photo.php?fbid…
Source: nytimes.com/library/nation…
-Columbia University's Seismology Group recorded seismic events of 10 seconds and 8 seconds in duration, which correspond to the destruction of WTC2 and WTC1. In comparison, if a billiard ball was dropped from the roof of WTC1 (North Tower) it would take approximately 9.22 seconds to hit the ground. Why was the seismic activity from the WTC destruction so brief? Furthermore, the destruction of each tower should have registered as magnitude 3.8 or greater on the Richter scale, so why was the seismic activity from the WTC destruction so weak?
facebook.com/photo.php?fbid…
Source: ldeo.columbia.edu/LCSN/Eq/200109…
-Case 1: Free-fall time of a billiard ball dropped from the roof of WTC1, in a vacuum (without air resistance)
facebook.com/photo.php?fbid…
From the rooftop of WTC1, drop one (dark-blue) billiard ball over the edge. As it falls, it accelerates. If it were in a vacuum, it would hit the pavement, 1368 feet below, in 9.22 seconds, shown by the blue curve in the figure, below.
In comparison, the major seismic activity from the destruction of the WTC towers only lasted about 8 and 10 seconds. Why was the seismic activity from the WTC destruction so brief?
Source: drjudywood.com/articles/BBE/B…
-Columbia University Seismology Group summary of seismic observations of the two impacts and the three WTC "collapses". Notice the particularly weak seismic signal from the destruction of WTC7, with a magnitude of only 0.6 on the Richter scale.
facebook.com/photo.php?fbid…
Source: ldeo.columbia.edu/LCSN/Eq/200109…
-Using the well documented Seattle Kingdome demolition for comparison, one can calculate that the seismographic magnitude of each WTC tower "collapse" should have registered as 3.8 [2.3+1.5=3.8] magnitude or greater on the Richter scale. In comparison, the much smaller Seattle Kingdome registered as 2.3 magnitude on the Richter scale as it hit the ground when it was demolished. The WTC twin towers were many times larger than the Seattle Kingdome, so why did the seismic activity from the destruction of the twin towers only register as 2.1 and 2.3 magnitude on the Richter scale? Furthermore, why was the seismic activity from the destruction of the WTC towers so brief, only lasting about 8 and 10 seconds?
facebook.com/photo.php?fbid…
Sources: ldeo.columbia.edu/LCSN/Eq/200109… & drjudywood.com/articles/DEW/S…
-Vertical-component seismic signals generated by the destruction of WTC7 on 9/11/2001. The Rayleigh waves were quite weak and difficult to discern clearly at most of the stations. In other words, there's little or no detectable seismic signals corresponding to the destruction of WTC7.
facebook.com/photo.php?fbid…
Source: NIST NCSTAR 1-9 Vol.2 Figure B-5 nist.gov/manuscript-pub… (doc page 658 / pdf page 320 of 382)
-Using the well documented Seattle Kingdome demolition for comparison, one can calculate that the seismographic magnitude of tower WTC7's "collapse" should have registered as 3.1 [2.3+0.8=3.1] magnitude or greater on the Richter scale. In comparison, the much smaller Seattle Kingdome registered as 2.3 magnitude on the Richter scale as it hit the ground when it was demolished. The WTC7 tower was many times larger than the Seattle Kingdome, so why did the seismic activity from the destruction of WTC7 only register as 0.6 magnitude on the Richter scale?
facebook.com/photo.php?fbid…
Sources: ldeo.columbia.edu/LCSN/Eq/200109… & drjudywood.com/wtc/#G
The top floor of the WTC towers should have taken at least ~100 seconds to reach the ground in a floor-by-floor 'pancake collapse', so why was the seismic activity from the destruction of the WTC towers so brief, only about 8 seconds for WTC1 and 10 seconds for WTC2? Additionally, the seismographic magnitude of each WTC tower "collapse" should have registered as 3.8 or greater on the Richter scale if each tower slammed to the ground so quickly. In comparison, the much smaller, mostly hollow Seattle Kingdome registered as 2.3 magnitude on the Richter scale as it hit the ground when it was demolished. The WTC towers were many times larger than the Seattle Kingdome, so why did the seismic activity from the rapid destruction of WTC1, WTC2, and WTC7 only register as 2.3, 2.1, and 0.6 magnitude on the Richter scale (respectively)? Also, the Seattle Kingdome was mostly hollow, gutted prior to demolition, and was brought down with thoroughly planted explosives, leaving a rubble pile approximately ~12.5% of its original height. Amazingly, the vertical steel WTC twin towers, despite being filled with bookshelves, office equipment, toilets, file cabinets, furniture, and more, somehow left a "rubble pile" only 1-4% of their original height. It is all three of these facts, the seismic duration, the seismic magnitude, and the rubble height, that are astonishing, not just one.
Sources:
1. ldeo.columbia.edu/LCSN/Eq/200109…
2. ldeo.columbia.edu/LCSN/Eq/200109…
3. drjudywood.com/articles/BBE/B…
-'Seismic Waves Generated by Aircraft Impacts and Building Collapses at World Trade Center, NYC Figure 4: Comparison of Palisades seismograms for collapse 2 (WTC1) and earthquake of January 17th 2001. Note the data for WTC1 appear very different from those for the January 2001 earthquake, as it is smoother, has fewer spikes, with less complexity, and lacks distinctive S and P waves. There would also have been a delay between the P and S waves if it had been an earthquake, or even a conventional controlled demolition with explosives. Most importantly, the amplitude of the 9/11 disturbance is less than half of the January earthquake, despite a similar peak Richter reading. What could have caused this?
facebook.com/photo.php?fbid…
Source: ldeo.columbia.edu/LCSN/Eq/200109…
These are some of the many pieces of empirical evidence from 9/11 that are not explained by thermal or kinetic forces of any kind (e.g. airplanes, jet fuel, bombs, thermite, nukes).
WhereDidTheTowersGo.com
DrJudyWood.com
CheckTheEvidence.com
Facebook.com/DrJudyWood


Where did all the rubble go? Why wasn't the WTC lobby buried by the ~110 stories above it? Why was the rubble pile at ground zero only 1-3% of the original WTC tower height (~3% at its tallest point)? Even buildings that were emptied and gutted before undergoing controlled demolition with thoroughly planted explosives leave a rubble pile of at least ~12% of the original building height, so why is the ground zero rubble pile only 1-3% of the original WTC twin tower height? Where is all the office furniture? Office machinery? Computers? Filing cabinets? Book shelves? Wall board? Doors? Concrete floors? Toilets? Where did all the rubble go?
'Missing Rubble' - IRREFUTABLE 9/11 Evidence Video Series: youtube.com/watch?v=BxA2cZ…
"Where's all the rubble gone?" (12:44pm 9/12/2001) George Stephanopoulos & Peter Jennings | ABC News: youtube.com/watch?v=GdBQOe…
This photo was taken around noon on 9/11/01, and is the same photo as the next one but with added yellow lines to emphasize the height of WTC6 compared to the tallest portion of the WTC1 "rubble pile," which is seen in the foreground. Where did the towers go? Compare this image to the previous one. WTC6, an 8-story building, towers over the "rubble pile" remaining from WTC1 and 2. WTC7 can be seen in the distance as it has not yet been destroyed. The Verizon Building is at a distance on the left. Why is the WTC rubble pile so small? Where are the concrete floors? Where is the office furniture? Where is the office machinery? Where are the filing cabinets? Where is the wall board? Where are the bookcases? Where are the toilets? If the Seattle Kingdome left a debris pile approximately 12% of its original height after being destroyed via controlled, explosive demolition, then why was the debris pile from the "collapse" of the WTC twin towers only a few stories high, approximately 2-3% of their original height (110 stories)?
facebook.com/photo.php?fbid…
(9/11/01) Source: img.timeinc.net/time/photoessa… & september11news.com/JamesNachtweyT…
This photo was taken around noon on 9/11/01, and is the same photo as the previous one but without the added yellow lines. Notice the height of WTC6 compared to the tallest portion of the WTC1 "rubble pile," which is seen in the foreground. Where did the towers go? Compare this image to the previous one. WTC6, an 8-story building, towers over the "rubble pile" remaining from WTC1 and 2. WTC7 can be seen in the distance as it has not yet been destroyed. The Verizon Building is at a distance on the left. Why is the WTC rubble pile so small? Where are the concrete floors? Where is the office furniture? Where is the office machinery? Where are the filing cabinets? Where is the wall board? Where are the bookcases? Where are the toilets? If the Seattle Kingdome left a debris pile approximately 12% of its original height after being destroyed via controlled, explosive demolition, then why was the debris pile from the "collapse" of the WTC twin towers only a few stories high, approximately 2-3% of their original height (110 stories)?
facebook.com/photo.php?fbid…
(9/11/01) Source: img.timeinc.net/time/photoessa… & september11news.com/JamesNachtweyT…
This is a view from West St., looking east across the remains of WTC1 shortly after the 9/11 attacks. Notice the distinct columns of the WTC tower lobby and the dust-covered ambulance at street level. Why is the WTC rubble pile so small? Where are the concrete floors? Where is the office furniture? Where is the office machinery? Where are the filing cabinets? Where is the wall board? Where are the bookcases? Where are the toilets? If the Seattle Kingdome left a debris pile approximately 12% of its original height after being destroyed via controlled, explosive demolition, then why was the debris pile from the "collapse" of the WTC twin towers only a few stories high, approximately 2-3% of their original height (110 stories)?
facebook.com/photo.php?fbid…
Source: photolibrary.fema.gov/photodata/orig…
This photo was taken around noon on 9/11/01. Notice the small height of the "rubble pile" from the twin towers (WTC1 & 2). The distinct columns of the WTC1 tower lobby were astonishingly not buried by debris, and can be seen towering over the tiny "rubble pile" and rescue personnel near the center of the photo. WTC7 can be seen "lathering up" in the distance as it has not yet been destroyed. Why is the WTC rubble pile so small? Where are the concrete floors? Where is the office furniture? Where is the office machinery? Where are the filing cabinets? Where is the wall board? Where are the bookcases? Where are the toilets? If the Seattle Kingdome left a debris pile approximately 12% of its original height after being destroyed via controlled, explosive demolition, then why was the debris pile from the "collapse" of the WTC twin towers only a few stories high, approximately 2-3% of their original height (110 stories)? This photo appears to be darkened as indicated by the deep blue sky.
facebook.com/photo.php?fbid…
(9/11/01) Source: 911myths.com/assets/images/…
The height of the WTC towers compared to the height of WTC6 and the small "rubble pile". Notice the distinct columns of the WTC tower lobby near ground level. See next photo for comparison. If the Seattle Kingdome left a debris pile approximately 12% of its original height after being destroyed via controlled, explosive demolition, then why was the debris pile from the "collapse" of the WTC twin towers only a few stories high, approximately 2-3% of their original height (110 stories)?
facebook.com/photo.php?fbid…
(1978) Source: web.archive.org/web/2011101515…
Here is a pre-9/11 image of the WTC Tower 1 lobby, looking south along the east side of the building. Notice the distinctive support columns/beams and tall windows all around the perimeter of the lobby. The lobby would have been buried by an enormous pile of debris in a "collapse", so use this image as a reference to compare the height of the debris pile to the height of the WTC tower lobby in other images.
facebook.com/photo.php?fbid…
Source: en.wikipedia.org/wiki/File:Worl…
Here is a pre-9/11 image of the WTC tower lobby, which was only a few stories tall. Notice the distinctive support columns/beams and tall windows all around the perimeter of the lobby. The lobby would have been buried by an enormous pile of debris in a "collapse", so use this image as a reference to compare the height of the debris pile to the height of the WTC tower lobby in other images.
facebook.com/photo.php?fbid…
The black building in the foreground is the Bankers Trust Building (130 Liberty Street), which has a total volume of approximately 28% of the volume of one WTC tower. So two WTC towers had seven times the volume of the Bankers Trust Building. How could the equivalent of seven collapsed Bankers Trust buildings leave so little debris? [(182.5ft x 182.5ft x 40floors) versus 2x(207ft x 207ft x 110floors)] If the Seattle Kingdome left a debris pile approximately 12% of its original height after being destroyed via controlled, explosive demolition, then why was the debris pile from the "collapse" of the WTC twin towers only a few stories high, approximately 2-3% of their original height (110 stories)? This photo was most likely taken within a day of the 9/11 attacks, as suggested by the haze in the air above ground zero and the lack of extensive cleanup equipment.
facebook.com/photo.php?fbid…
The debris pile that remains from the Seattle Kingdome includes all of the beams and concrete. Notice how small the people are in comparison to the debris pile. Unlike the WTC, all of the valuable furniture and fixtures were removed from the Kingdome before it was destroyed. After being brought down by controlled, explosive demolition, the Seattle Kingdome left a debris pile about 30 feet high, approximately 12% of its former height. Why was the debris pile of the WTC twin towers only a few stories high, approximately 2-3% of their original height (110 stories)?
facebook.com/photo.php?fbid…
Source: seattletimes.nwsource.com/kingdome/galle…
Video: portland.indymedia.org/media/media/20…
Physics calculations show that the top floor of the WTC towers should have taken at least ~100 seconds to reach the ground in a floor-by-floor 'pancake collapse', so why was the seismic activity from the destruction of the WTC towers so brief, only lasting about 8 seconds for WTC1 and 10 seconds for WTC2? Additionally, the seismographic magnitude of each WTC tower "collapse" should have registered as 3.8 or greater on the Richter scale if each tower slammed to the ground so quickly. In comparison, the much smaller, mostly hollow Seattle Kingdome registered as 2.3 magnitude on the Richter scale as it hit the ground when it was demolished. The WTC towers are many times larger than the Seattle Kingdome, so why did the seismic activity from the rapid destruction of the twin towers only register as 2.1 and 2.3 magnitude on the Richter scale? Also, the Seattle Kingdome was mostly hollow, gutted prior to demolition, and was brought down with thoroughly planted explosives, leaving a rubble pile approximately ~12.5% of its original height. Amazingly, the vertical steel WTC towers, despite being filled with bookshelves, office equipment, toilets, file cabinets, furniture, and more, somehow left a "rubble pile" only 1-4% of its original height (~4% in the tallest area, outlined in yellow in some of the images above). It is all three of these facts, the seismic duration, the seismic magnitude, and the rubble height, that are astonishing, not just one.
Sources:
1. nytimes.com/library/nation…
2. ldeo.columbia.edu/LCSN/Eq/200109…
3. drjudywood.com/articles/DEW/S…
These are some of the many pieces of empirical evidence from 9/11 that are not explained by thermal or kinetic forces of any kind (e.g. airplanes, jet fuel, explosives, thermite, nuclear bombs).


If thousands of tons of falling steel and other building materials came crashing down on the WTC lobby and the people in Stairwell B, why weren't they crushed by debris?
In Stairwell B of the North Tower, 16 people lived amid the avalanche of concrete and steel. This is a photo showing where the survivors were found, direcrtly at the base of the WTC towers. Firefighter Jay Jonas said, "I looked and said, "Guys, there used to be 106 floors above us and now I'm seeing sunshine." ... "There's nothing above us. That big building doesn't exist." ... "These are the biggest office buildings in the world and I didn't see one desk or one chair or one phone, nothing." How could so many tons of steel, concrete, and other materials not crush these individuals? If tons of falling steel and other building materials came crashing down on the WTC lobby, shopping mall, basement floors, and PATH trains, why weren't they crushed by debris?
facebook.com/photo.php?fbid…
Source: dailymail.co.uk/news/article-2… & nymag.com/nymetro/news/s…
Video (9:19): youtube.com/watch?v=BxA2cZ…
In Stairwell B of the North Tower, 16 people lived amid the avalanche of concrete and steel. This is a photo of survivor Pasquale Buzzelli with his wife and children. He reported, "I felt nothing at all. I just opened my eyes and saw blue sky." How could so many tons of steel, concrete, and other materials not crush these individuals? If tons of falling steel and other building materials came crashing down on the WTC lobby, shopping mall, basement floors, and PATH trains, why weren't they crushed by debris?
facebook.com/photo.php?fbid…
Source: dailymail.co.uk/news/article-2… & nymag.com/nymetro/news/s…
Video (9:19): youtube.com/watch?v=BxA2cZ…
These are some of the many pieces of empirical evidence from 9/11 that are not explained by thermal or kinetic forces of any kind (e.g. airplanes, jet fuel, explosives, thermite, nuclear bombs).
WhereDidTheTowersGo.com
DrJudyWood.com
CheckTheEvidence.com
Facebook.com/DrJudyWood


If thousands of tons of falling steel and other building materials came crashing down on the WTC shopping mall, why wasn't it crushed by debris?
Ground zero rescue workers exploring the WTC shopping mall. Notice the "Innovation" store located on the left. A few pieces of aluminum cladding and other small pieces of debris can be seen, but where are the countless tons of steel and other building materials that rained down on the WTC shopping mall? If tons of falling steel and other building materials came crashing down on the WTC shopping mall and PATH trains, why weren't they crushed by debris?
facebook.com/photo.php?fbid…
(Photo filed 9/19/01) Source: photolibrary.fema.gov/photodata/orig…
Video: youtube.com/watch?v=7-IPST…
Cross section of the WTC complex, highlighting buildings 2 and 3 and the seven subbasements. Note the shopping mall at the ground level, on the right, below WTC4 and above the PATH and subway rail lines. If tons of falling steel and other building materials came crashing down on the WTC shopping mall and PATH trains, why weren't they crushed and buried by debris?
facebook.com/photo.php?fbid…
Source: Mueser Rutledge Consulting Engineers / Cristina Rivero - The Washington Post
Warner Bros. store contents from the WTC shopping mall appears virtually unharmed. If tons of falling steel and other building materials came crashing down on the WTC shopping mall and PATH trains, why weren't they crushed by debris?
facebook.com/photo.php?fbid…
Source: amny.com/media/photo/20…
Warner Bros. figures from the WTC shopping mall appear undamaged. If tons of falling steel and other building materials came crashing down on the WTC shopping mall and PATH trains, why weren't they crushed by debris?
facebook.com/photo.php?fbid…
Source: amny.com/media/photo/20…
These are some of the many pieces of empirical evidence from 9/11 that are not explained by thermal or kinetic forces of any kind (e.g. airplanes, jet fuel, explosives, thermite, nuclear bombs).


If thousands of tons of falling steel, marble, and other building materials came crashing down on the WTC basement levels and parking garage, then why weren't they crushed or filled with debris?
Ground zero workers begin to search the WTC basement levels. The WTC basement levels and parking garage were not crushed or filled with debris. If tons of falling steel and other building materials came crashing down on the WTC shopping mall, basement floors, and PATH trains, why weren't they crushed by debris? Notice the damp ground and lack of molten metal.
facebook.com/photo.php?fbid…
(Photo filed 9/19/01) Source: photolibrary.fema.gov/photodata/orig…
Video: youtube.com/watch?v=7-IPST…
The WTC basement levels and parking garage were not crushed or filled with debris. If tons of falling steel and other building materials came crashing down on the WTC shopping mall, basement floors, and PATH trains, why weren't they crushed by debris? Notice the damp ground and lack of molten metal.
facebook.com/photo.php?fbid…
(Photo filed 9/19/01) Source: photolibrary.fema.gov/photodata/orig…
Video: youtube.com/watch?v=7-IPST…
Cross section of the WTC complex, highlighting buildings 2 and 3 and the seven subbasements. Note the shopping mall at the ground level, on the right, below WTC4 and above the PATH and subway rail lines. If tons of falling steel and other building materials came crashing down on the WTC shopping mall and PATH trains, why weren't they crushed and buried by debris?
facebook.com/photo/?fbid=45…
Source: Mueser Rutledge Consulting Engineers / Cristina Rivero - The Washington Post
These are some of the many pieces of empirical evidence from 9/11 that are not explained by thermal or kinetic forces of any kind (e.g. airplanes, jet fuel, explosives, thermite, nuclear bombs).


If thousands of tons of falling steel and other building materials came crashing down on the sub-basement levels and PATH trains, why weren't they crushed by debris? If thousands of tons of steel, concrete, and other building materials came crashing down onto the WTC 'bathtub' foundation, why wasn't there major damage to it, and why didn't NYC get flooded by the Hudson River?
PATH Train cars were not crushed and were lifted from the WTC bathtub February 22, 2002. If tons of falling steel and other building materials came crashing down on the WTC shopping mall, basement floors, and PATH trains, why weren't they crushed by debris?
facebook.com/photo.php?fbid…
Source: img.timeinc.net/time/photoessa…
WTC Station PATH Train Platform after 9/11. These PATH train cars were not crushed. If tons of falling steel and other building materials came crashing down on the WTC shopping mall, basement floors, and PATH trains, why weren't they crushed by debris?
facebook.com/photo.php?fbid…
Source: hudsoncity.net/tubes/pathcarw…
Ground zero workers begin to search the WTC basement. If tons of falling steel and other building materials came crashing down on the WTC shopping mall, basement floors, and PATH trains, why weren't they crushed by debris? Notice the damp ground and lack of molten metal.
facebook.com/photo.php?fbid…
(Photo filed 9/19/01) Source: photolibrary.fema.gov/photodata/orig…
Video: youtube.com/watch?v=7-IPST…
New York Times sketch of alleged damage to the underground portion of the WTC within the bathtub. Four of the seven PATH train cars under WTC were not damaged. It seems odd that the center of the PATH platforms were "not inspected or undetermined." Why? As seen in the preceding photos, there was virtually no significant structural damage at that section of the platform, only water damage. We are not entirely confident that this NYT sketch is an accurate picture of the damage pattern in the bathtub. Interestingly, the west or Hudson side of each tower is damage-free, according to the NYT. Also, the PATH tunnel entrances, rigidly connected to the bathtub and bedrock, are "intact or mostly intact." Only three of seven PATH cars were damaged. While NYT uses the term "crushed," it seems unlikely that three cars could be totally crushed while leaving four cars intact. If tons of falling steel and other building materials came crashing down on the WTC shopping mall, basement floors, and PATH trains, why weren't they crushed by debris?
facebook.com/photo.php?fbid…
Source: nytimes.com/library/nation…
There was no significant damage to the WTC foundation 'bathtub' on 9/11. If 'falling debris' crashed into the 'bathtub' beneath the WTC towers, then why does it appear to be virtually unharmed? Notice the absence of cracks or gouges in the foundation beneath the WTC towers after the debris has been cleared. This picture looks west-northwest, from the center of the WTC 1 footprint. The parking garage can be seen on the right.
facebook.com/photo.php?fbid…
Source: 911research.wtc7.net/wtc/arch/docs/…
General schematic of the 'bathtub' foundation located beneath the WTC twin towers, which kept the Hudson River at bay.
1. Slurry walls form water-tight bathtub.
2. PATH rail lines pass under WTC 2.
3. Even cracks in the bathtub would allow water inside.
facebook.com/photo.php?fbid…
Source: news.bbc.co.uk/olmedia/155000…
An overhead view of the post-9/11 WTC foundation 'bathtub' shows the uncrushed PATH rail lines and terminal, sitting on mostly undamaged bedrock. The subway line and platform are to the right of the big bathtub wall. This photo is from August 2005 after the debris had been cleared, showing that no subway tracks or terminals needed relocation, and there was not significant damage to the WTC foundation 'bathtub' on 9/11. If 'falling debris' crashed into the 'bathtub' beneath the WTC towers, then why does it appear to be virtually unharmed?
facebook.com/photo.php?fbid…
Source: world-heritage-tour.org/america/us/new…
These are some of the many pieces of empirical evidence from 9/11 that are not explained by thermal or kinetic forces of any kind (e.g. airplanes, jet fuel, explosives, thermite, nuclear bombs).


What generated the strange vertical cylindrical holes in the other buildings of the WTC complex?
Overhead view of ground zero. Notice the strange vertical holes in the surrounding buildings (WTC6, 5, 4), yet no large pieces of debris can be seen within the holes. Many of these strange holes are circular in shape, such as the nearly perfect circle seen in WTC5, located in the bottom right corner of the photo. Also notice that all of WTC4 has disappeared except for the square-shaped north wing that remains standing just to the left of WTC5. Hazy fumes continue to rise from ground zero. What could have caused this? Please view the other photos in this series to see these holes from different angles.
facebook.com/photo.php?fbid…
(Photo by USGS/NOAA, 9/23/01) Source: hybrideb.com/images/newyork…
Top right corner of previous overhead image of ground zero. Notice the vertical cut-outs in the center of WTC6 on the right side of the photo. To the left of WTC6 are the remains of WTC1. Note the fairly consistent diameter of the vertical holes. The holes are essentially empty other than an abnormally small amount of debris that remains inside of them. Please view the other photos in this series to see these holes from different angles.
facebook.com/photo.php?fbid…
(Photo by USGS/NOAA, 9/23/01) Source: hybrideb.com/images/newyork…
A close-up of WTC5 and its strange vertical holes. Notice the distinct circular hole located just above the midpoint of this photo. There are no significant piles of debris in these holes to account for the missing building material. What could have caused this? Please view the other photos in this series to see these strange phenomena from different angles.
facebook.com/photo.php?fbid…
(Photo by USGS/NOAA, 9/23/01) Source: hybrideb.com/images/newyork…
Hutchison Effect sample. Deep hole in solid aluminum bar after exposure to directed energy. Notice the odd appearance of the metal adjacent to the hole.
facebook.com/drjudywood/pho…
Source: thehutchisoneffect.com/index.php?opti…
These are some of the many pieces of empirical evidence from 9/11 that are not explained by thermal or kinetic forces of any kind (e.g. airplanes, jet fuel, explosives, thermite, nuclear bombs).


The majority of WTC6 virtually disappeared, leaving an enormous hole near the center. The hole was extremely deep, spanning all the way to ground level, and there was no significant pile of building debris to account for the missing portions of the building.
The majority of WTC6, an 8-storey building, virtually disappeared, leaving an enormous hole near the center. The hole was extremely deep, spanning all the way to ground level, and there was no significant pile of building debris to account for the missing portions of the building. A view over the dome of WFC2 shows the damage and strange vertical holes of WTC6, in the center of the photo. Notice the vertical edges of these strange holes. To the right of WTC6 is the remaining north wall of tower WTC1, which leans toward WTC6. Where did the top 100 floors of the north wall of WTC1 go? They did not fall on WTC6 or WTC7, as there are no steel "wheatchex" seen there, and the large vertical holes are not filled with debris. Some of WTC1's core remains standing at ground zero, but where is the rest of the core? The relatively small amount of steel on the ground barely covers ground zero, and does not account for the large amount of steel that was used to construct the twin towers. Across the street to the left is the remains of WTC7. Its debris stack is at least five stories tall, even though the "rubble piles" from the twin towers were astonishingly only 2-3 stories tall. Please view the other photos in this series to see these holes from different angles.
facebook.com/drjudywood/pho…
Source: web.archive.org/save/_embed/ht…
The majority of WTC6, an 8-storey building, virtually disappeared, leaving an enormous hole near the center. The hole was extremely deep, spanning all the way to ground level, and there was no significant pile of building debris to account for the missing portions of the building. Notice the strange holes in WTC6, located near the center of this photo, and the distinct vertical edges of these holes. To the left of WTC6 is the remaining north wall of tower WTC1, which leans toward WTC6. Where did the top 100 floors of the north wall of WTC1 go? They did not fall on WTC6 or WTC7 because there are no steel "wheatchex" seen there, and the large vertical holes are not filled with debris. Some of WTC1's core remains standing at ground zero, but where is the rest of the core? The relatively small amount of steel on the ground barely covers ground zero, and does not account for the large amount of steel that was used to construct the twin towers. Across the street to the right is the remains of WTC7. Its debris stack is at least five stories tall, even though the "rubble piles" from the twin towers were astonishingly only 2-3 stories tall. Please view the other photos in this series to see these holes from different angles.
facebook.com/drjudywood/pho…
Source: drjudywood.com/articles/DEW/d…
The majority of WTC6, an 8-storey building, virtually disappeared, leaving an enormous hole near the center. The hole was extremely deep, spanning all the way to ground level, and there was no significant pile of building debris to account for the missing portions of the building. This photo highlights the depth of the hole in WTC6. The dust from the WTC towers appears to have mostly cleared. While there is abundance of aluminum cladding on the roofs of buildings 5 and 6, there is little or none in the holes. Please view the other photos in this series to see these holes from different angles.
facebook.com/drjudywood/pho…
Source: drjudywood.com/articles/DEW/d…
Overhead photo of WTC6 and ground zero. The majority of WTC6, an 8-storey building, virtually disappeared, leaving an enormous hole near the center. The hole was extremely deep, spanning all the way to ground level, and there was no significant pile of building debris to account for the missing portions of the building. Notice the vertical cut-outs in the center of WTC6 on the right side of the photo. To the left of WTC6 are the remains of WTC1. Note the fairly consistent diameter of the vertical holes. The holes are essentially empty other than an abnormally small amount of debris that remains inside of them. Please view the other photos in this series to see these holes from different angles.
facebook.com/drjudywood/pho…
(Photo by USGS/NOAA, 9/23/01) Source: web.archive.org/web/2007100520…
Overhead photo of WTC6 hole, rotated 180° to more naturally match the corresponding points in the previous photo. The majority of WTC6, an 8-storey building, virtually disappeared, leaving an enormous hole near the center. The hole was extremely deep, spanning all the way to ground level, and there was no significant pile of building debris to account for the missing portions of the building. Notice the lack of steel "wheatchex" in the hole. Please view the other photos in this series to see these holes from different angles.
facebook.com/drjudywood/pho…
(Photo by USGS/NOAA, 9/23/01) Source: web.archive.org/web/2007100520…
These are some of the many pieces of empirical evidence from 9/11 that are not explained by thermal or kinetic forces of any kind (e.g. airplanes, jet fuel, explosives, thermite, nuclear bombs).


Why did the majority of WTC4 virtually disappear, leaving only the square-shaped north wing standing? There was no significant pile of building debris to account for the missing portions of the building.
This is a closeup of the remains of WTC4. The majority of WTC4, a 9-storey building, has virtually disappeared, leaving only the square-shaped north wing standing. Notice the greyish rectangular area of ground zero in the foreground where the majority of WTC4 once stood. Why did the majority of WTC4 mysteriously disappear? Notice how sharp the cut is between the north wing which still stands, and the foreground area where the rest of WTC4 once stood. Please view the other photos in this album to see the strange remains of WTC4 from different angles. Also note the presence of rust on many of the steel "wheatchex" on the ground.
facebook.com/photo.php?fbid…
This is a closeup of the remains of WTC4, located in the lower half of the image. The small WTC2 "rubble pile" is located in the top half of the image. The majority of WTC4, a 9-storey building, has virtually disappeared, leaving only the square-shaped north wing standing. The square-shaped north wing, located in the lower right, appears to remain intact without significant damage. Why did the majority of WTC4 mysteriously disappear? Please view the other photos in this album to see the strange remains of WTC4 from different angles.
facebook.com/photo.php?fbid…
(Photo by USGS/NOAA, 9/23/01) Source: hybrideb.com/images/newyork…
The yellow box locates the north wing of WTC4 which survived the 9/11 attacks despite the mysterious disappearance of the rest of the building.
facebook.com/photo.php?fbid…
(Photo by USGS/NOAA, 9/23/01) Source: hybrideb.com/images/newyork…
Notice the majority of WTC4 has disappeared (left), but the north wing appears to remain intact (right). The virtually flat debris field on the left is where the rest of WTC4 once stood. Why did the majority of WTC4 mysteriously disappear? Notice how sharp the cut is between the north wing which still stands, and the virtually flat debris field where the rest of WTC4 once stood.
facebook.com/photo.php?fbid…
Source: wtcdata.nist.gov/gallery2/v/Col… (to access this database, you first must go to the main website at wtcdata.nist.gov and accept the user agreement)
These are some of the many pieces of empirical evidence from 9/11 that are not explained by thermal or kinetic forces of any kind (e.g. airplanes, jet fuel, explosives, thermite, nuclear bombs).


What can cause 1,400 cars to be completely 'toasted' in strange ways on 9/11, some over 1/4th a mile away from ground zero, without burning nearby paper, leaves, flags, or pedestrians? What can put 'toasted' holes in metal cars without causing gas tanks to explode, and without burning nearby paper or pedestrians?
"Toasted" cars and bus along West Broadway. Consistently, they seem to have missing door handles. The gas tanks don't appear to explode. If the dust clouds from the WTC towers were not hot enough to burn pedestrians, paper, or cars, why were there so many 'toasted' cars after 9/11?
facebook.com/photo.php?fbid…
(9/11/01 entered) Source: image03.webshots.com/3/3/40/70/2193…
Video (at 9:22): youtube.com/watch?v=V_AoDy…
"Toasted" bus near the remains of WTC7. What coud have caused this destruction? If the dust clouds from the WTC towers were not hot enough to burn pedestrians, paper, or cars, why were there so many 'toasted' cars after 9/11?
facebook.com/photo.php?fbid…
(9/11/01) Source: studyof911.com/gallery/albums…
Video (at 9:22): youtube.com/watch?v=V_AoDy…
"Toasted" cars in the parking lot near the WTC. If the dust clouds from the WTC towers were not hot enough to burn pedestrians, paper, or cars, why were there so many 'toasted' cars after 9/11?
facebook.com/photo.php?fbid…
Video (at 9:22): youtube.com/watch?v=V_AoDy…
"Toasted" cars in the lot northwest of the WTC complex. There is little visible rust, so this photo was probably taken within a day or two of 9/11/01. If the dust clouds from the WTC towers were not hot enough to burn pedestrians, paper, or cars, why were there so many 'toasted' cars after 9/11?
facebook.com/photo.php?fbid…
Source: static.flickr.com/119/297635136_…
Video (at 9:22): youtube.com/watch?v=V_AoDy…
More "toasted cars" in the parking lot. If the dust clouds from the WTC towers were not hot enough to burn pedestrians, paper, or cars, why were there so many 'toasted' cars after 9/11?
facebook.com/photo.php?fbid…
(after 9/11/01) Source: drjudywood.com/articles/DEW/d…
Video (at 9:22): youtube.com/watch?v=V_AoDy…
Peculiar wilting of car doors and deformed window surrounds on FDR Drive. There is extensive damage to the front of the car, including no door handle on the driver's door.
facebook.com/photo.php?fbid…
Source: hybrideb.com/source/eyewitn…
Video (at 9:22): youtube.com/watch?v=V_AoDy…
The front half of car 2723 is toasted, but check out the new wax job on the back and the unmelted plastic lights on top of the car. Also note the missing front door handle, the untouched back door handle, and the rusted appearance of the interior. If the dust clouds from the WTC towers were not hot enough to burn pedestrians, paper, or cars, why were there so many 'toasted' cars after 9/11?
facebook.com/photo.php?fbid…
(9/12?/01) Source: img.photobucket.com/albums/v214/sh…
Video (at 9:22): youtube.com/watch?v=V_AoDy…
Blistered car on FDR Drive with unburned upholstery and unburned plastic window molding. What could have caused this?
facebook.com/photo.php?fbid…
Source: hybrideb.com/source/eyewitn…
Video (at 9:22): youtube.com/watch?v=V_AoDy…
Cars along FDR drive were randomly toasted. These cars are at least 1/2 mile away from the WTC. The marks in the pavement suggest they were pushed to the side of the road rather than towed here. If the dust clouds from the WTC towers were not hot enough to burn pedestrians, paper, or cars, why were there so many 'toasted' cars after 9/11?
facebook.com/photo.php?fbid…
Video (at 9:22): youtube.com/watch?v=V_AoDy…
Notice the two dust-covered cars under the bridge. How did the dust fall there? Obviosly there were strong enough air currents to put it there. It's interesting how the drying pavement looks like it does after its been treated for snow and ice. This is thought to be the entrance ramp to the Brooklyn Bridge from southbound FDR Drive. If the dust clouds from the WTC towers were not hot enough to burn pedestrians, paper, or cars, why were there so many 'toasted' cars after 9/11?
facebook.com/photo.php?fbid…
Source: i24.photobucket.com/albums/c49/Ign…
Video (at 9:22): youtube.com/watch?v=V_AoDy…
Degradation and corrosion of a metal pipe caused by directed energy in a laboratory setting, Hutchison Effect sample. Note the similarity in appearance between the destruction endured by this metal pipe and the 1,400+ "toasted" metal vehicles near ground zero on 9/11.
facebook.com/drjudywood/pho…
Source: bp0.blogger.com/_SkyVfBO47ts/R…
FDNY Hazmat truck in front of WTC6 on West Street. The remaining upper part of the truck has been peeled and evaporated in areas. The upper part of the cab is gone and the engine block seems to have disappeared. This photo was taken on 9/11 after WTC1 disappeared but before WTC7 collapsed. Also note the other "toasted" truck in the background which also displays the FDNY colors. If the dust clouds from the WTC towers were not hot enough to burn pedestrians, paper, or cars, why were there so many 'toasted' cars after 9/11?
facebook.com/photo.php?fbid…
(9/11/01) Source: 911pictures.com/images/preview…
This "toasted" postal truck appears fairly "eaten up" on its left side. Notice the large holes in the vehicle, despite the paint being relatively intact in many areas. The building on the right is WTC7, the building on the left is the USPS Federal Building (not visible), and WTC5 is located at the end of the street. If the dust clouds from the WTC towers were not hot enough to burn pedestrians, paper, leaves, or cars, why were there so many 'toasted' cars after 9/11?
facebook.com/photo.php?fbid…
Source: wtcdata.nist.gov/gallery2/v/Col… (to access the link, first go to wtcdata.nist.gov and click 'accept' when the user agreement appears)
Why does this ambulance have melted inside doors? The inside looks to have suffered more heat damage than the outside. What would cause that? If the dust clouds from the WTC towers were not hot enough to burn pedestrians, paper, or cars, why were there so many 'toasted' cars after 9/11?
facebook.com/photo.php?fbid…
Source: amny.com/media/photo/20…
Vehicles that had been damaged as a result of the 9/11 attacks were delivered to the Fresh Kills Landfill of Staten Island, New York. About 1,400 vehicles were recovered in total. Almost all of the vehicles recovered were recycled with the exception of approximately 17 vehicles, which were sent to museums.
Source: apwa.net/Resources/Repo…
Closeup of Red Bull aluminum can from previous photo, 'Hutchison Effect' sample. Notice the strange "toasted" hole which was generated by directed energy in a laboratory setting. Compare the similarities between the hole in this metal can and the holes observed in some of the vehicles from previous images.
facebook.com/drjudywood/pho…
Source: bp1.blogger.com/_SkyVfBO47ts/R…
Video: drjudywood.com/media/JohnHutc…
These are some of the many pieces of empirical evidence from 9/11 that are not explained by thermal or kinetic forces of any kind (e.g. airplanes, jet fuel, explosives, thermite, nuclear bombs).


Why was there only one file cabinet found in the rubble at ground zero after 9/11, despite estimates that over 40,000 total file cabinets were present in the WTC buildings? The one remaining file cabinet was extremely warped and shriveled in appearance, and was strangely fused to unburned paper. Thousands of pieces of office machinery, office furniture, toilets, door knobs, and other building materials also mysteriously disappeared on 9/11. The enormous quantity of missing materials is consistent with the fact that the WTC buildings, and their contents, were mostly transformed to fine dust in mid-air on 9/11.
This was the only file cabinet found in the WTC "rubble pile". What happened to the thousands of file cabinets contained in the WTC towers? Why was the one remaining cabinet so warped and shriveled in appearance, and why is it fused with unburned paper? The paper still has its color, indicating this filing cabinet did not shrivel due to conventional heat. What can explain thousands of missing file cabinets, office machinery, office furniture, toilets, door knobs, and other building materials that mysteriously disappeared?
facebook.com/photo.php?fbid…
Source: drjudywood.com/articles/DEW/d…
Video: youtube.com/watch?v=mh18di…
These are some of the many pieces of empirical evidence from 9/11 that are not explained by thermal or kinetic forces of any kind (e.g. airplanes, jet fuel, explosives, thermite, nuclear bombs).
WhereDidTheTowersGo.com
DrJudyWood.com
CheckTheEvidence.com
Facebook.com/DrJudyWood


What can cause objects, including metals, to fuse with unburned paper?
Pages from a Bible were found fused to metal in the wreckage at Ground Zero. The Bible had fused to a chunk of steel as the World Trade Center buildings were destroyed. A firefighter found the object in March 2002, under the Tully Road, a temporary truck route that covered the last remnants of the south tower. He called out to photographer Joel Meyerowitz, who happened to be nearby. Joel Meyerowitz subsequently gave the artifact to the September 11th Memorial Museum where it was put on display. Note the unburned paper with mostly legible text. Fire and heat do not cause unburned paper to fuse with metal, so what caused this?
Image: facebook.com/drjudywood/pho…
Source (Photo Credit Jin Lee, National September 11th Memorial Museum): nytimes.com/live/pope-visi…
Fused block of WTC debris referred to as the 9/11 "meteorite". Notice the numerous pieces of solid metal. Paper with readable print was also found in the "meteorite". If molten metal caused this, the paper would have been incinerated.
Image: facebook.com/photo.php?fbid…
Video: drjudywood.co.uk/media/wtc_mete…
Note the compressed pieces of paper found in the 9/11 "meteorite". If molten metal caused this, the paper would have been incinerated.
Image: facebook.com/photo.php?fbid…
(2002?) Source: amny.com/media/photo/20…
Note the print on these compressed pieces of paper found in the 9/11 "meteorite". If molten metal caused this, the paper would have been incinerated.
Image: facebook.com/photo.php?fbid…
(2002?) Source: amny.com/media/photo/20…
Note the print on these compressed pieces of paper within the 9/11 "meteorite". If molten metal caused this, the paper would have been incinerated.
Image: facebook.com/photo.php?fbid…
(2002?) Source: amny.com/media/photo/20…
Wood fused with aluminum after being affected by directed energy in a laboratory setting, Hutchison Effect sample. The fusing of these objects did not require high heat. The heat required to melt aluminum to this degree would have burnt the wood.
Image: facebook.com/drjudywood/pho…
Source: thehutchisoneffect.com/index.php?opti…
These are some of the many pieces of empirical evidence from 9/11 that are not explained by thermal or kinetic forces of any kind (e.g. airplanes, jet fuel, explosives, thermite, nuclear bombs).
WhereDidTheTowersGo.com
DrJudyWood.com
CheckTheEvidence.com
Facebook.com/DrJudyWood


What can cause steel to bend like a horseshoe without any signs of cracking, buckling, or charring?
Steel beams were bent and warped in odd ways, without any signs of severe heat or buckling stress. A portion of this steel beam has partially separated into individual components. Notice how smooth the curve of this steel column is, and the presence of rust. What can cause steel to bend in this strange way? Why are there no signs of cracking or high heat?
facebook.com/photo.php?fbid…
Source: wtcdata.nist.gov/gallery2/v/NIS… (must enter from main page and accept user agreement to access this link)
Video: youtube.com/watch?v=HrY_PR…
Steel beams were bent and warped in odd ways, without any signs of severe heat or buckling stress. A portion of this steel beam has partially separated into individual components. Notice how smooth the curve of this steel column is, and the presence of rust. What can cause steel to bend in this strange way? Why are there no signs of cracking or high heat?
facebook.com/photo.php?fbid…
Source: wtcdata.nist.gov/gallery2/v/NIS… (must enter from main page and accept user agreement to access this link)
Steel beams were bent and warped in odd ways, without any signs of severe heat or buckling stress. Notice how smooth the curve of this steel column is, and the presence of rusting. What can cause steel to bend in this strange way? Why are there no signs of cracking or high heat?
facebook.com/photo.php?fbid…
(2002) Source: thewebfairy.com/911/h-effect/i…
Steel beams were bent and warped in odd ways, without any signs of severe heat or buckling stress. Notice how smooth the curve of this steel column is, and the presence of rust. What can cause steel to bend in this strange way? Why are there no signs of cracking or high heat?
facebook.com/photo.php?fbid…
Source: 911research.wtc7.net/wtc/evidence/p…
Solid copper bar after being affected by directed energy in a laboratory setting, showing significant bending without evidence of charring, cracking, or warping, even at the area of greatest curvature; Hutchison Effect sample.
facebook.com/drjudywood/pho…
Source: bp0.blogger.com/_SkyVfBO47ts/R…
These are some of the many pieces of empirical evidence from 9/11 that are not explained by thermal or kinetic forces of any kind (e.g. airplanes, jet fuel, explosives, thermite, nuclear bombs).
WhereDidTheTowersGo.com
DrJudyWood.com
CheckTheEvidence.com
Facebook.com/DrJudyWood
Steel beams were bent and warped in odd ways, without any signs of severe heat or buckling stress. A portion of this steel beam has partially separated into individual components. Notice how smooth the curve of this steel column is, and the presence of rust. What can cause steel to bend in this strange way? Why are there no signs of cracking or high heat?
facebook.com/photo.php?fbid…
Source: wtcdata.nist.gov/gallery2/v/NIS… (must enter from main page and accept user agreement to access this link)
Video: youtube.com/watch?v=HrY_PR…
Steel beams were bent and warped in odd ways, without any signs of severe heat or buckling stress. A portion of this steel beam has partially separated into individual components. Notice how smooth the curve of this steel column is, and the presence of rust. What can cause steel to bend in this strange way? Why are there no signs of cracking or high heat?
facebook.com/photo.php?fbid…
Source: wtcdata.nist.gov/gallery2/v/NIS… (must enter from main page and accept user agreement to access this link)
Steel beams were bent and warped in odd ways, without any signs of severe heat or buckling stress. Notice how smooth the curve of this steel column is, and the presence of rusting. What can cause steel to bend in this strange way? Why are there no signs of cracking or high heat?
facebook.com/photo.php?fbid…
(2002) Source: thewebfairy.com/911/h-effect/i…
Steel beams were bent and warped in odd ways, without any signs of severe heat or buckling stress. Notice how smooth the curve of this steel column is, and the presence of rust. What can cause steel to bend in this strange way? Why are there no signs of cracking or high heat?
facebook.com/photo.php?fbid…
Source: 911research.wtc7.net/wtc/evidence/p…
Solid copper bar after being affected by directed energy in a laboratory setting, showing significant bending without evidence of charring, cracking, or warping, even at the area of greatest curvature; Hutchison Effect sample.
facebook.com/drjudywood/pho…
Source: bp0.blogger.com/_SkyVfBO47ts/R…
These are some of the many pieces of empirical evidence from 9/11 that are not explained by thermal or kinetic forces of any kind (e.g. airplanes, jet fuel, explosives, thermite, nuclear bombs).
WhereDidTheTowersGo.com
DrJudyWood.com
CheckTheEvidence.com
Facebook.com/DrJudyWood


Why were steel beams from ground zero wilted and warped in strange ways, without any signs of severe heat or buckling stress? Notice the unusual wavy appearance of these steel beams, and the presence of rust. The edges of the beams are especially wavy and wrinkled. What could have caused this, without signs of cracking or charring?
Steel beams were wilted and warped in odd ways, without any signs of severe heat or buckling stress. Notice the unusual wavy appearance of this steel beam, and the presence of rust. The edges of the beam are especially wavy and wrinkled. What could have caused this?
Image: facebook.com/drjudywood/pho…
Source: wtcdata.nist.gov/gallery2/v/NIS… (must enter from wtcdata.nist.gov main page and accept user agreement to access the link)
Steel beams were wilted and warped in odd ways, without any signs of severe heat or buckling stress. This steel beam has partially separated into individual components. Notice the unusual wavy appearance of the steel, and the presence of rust. What could have caused this?
Image: facebook.com/drjudywood/pho…
Source (Photo from NIST): wtcdata.nist.gov/gallery2/v/NIS… (must enter from wtcdata.nist.gov main page and accept user agreement to access the link)
Steel beams were wilted and warped in odd ways, without any signs of severe heat or buckling stress. Notice the unusual wavy appearance of this steel beam, and the presence of rust. What could have caused this?
Image: facebook.com/drjudywood/pho…
Source(Photo from NIST): wtcdata.nist.gov/gallery2/v/NIS… (must enter from wtcdata.nist.gov main page and accept user agreement to access the link)
Steel beams were wilted and warped in odd ways, without any signs of severe heat or buckling stress. Notice the unusual wavy appearance of these steel beams, and the presence of rust. The edges of the beams are especially wavy and wrinkled. What could have caused this?
Image: facebook.com/drjudywood/pho…
Source (Photo from NIST): wtcdata.nist.gov/gallery2/v/NIS… (must enter from wtcdata.nist.gov main page and accept user agreement to access the link)
Steel beams were wilted and warped in odd ways, without any signs of severe heat or buckling stress. Notice the unusual wavy appearance of this steel beam, and the presence of rust. The edges of the beam are especially wavy and wrinkled. What could have caused this?
Image: facebook.com/drjudywood/pho…
Source: wtcdata.nist.gov/gallery2/v/NIS… (must enter from wtcdata.nist.gov main page and accept user agreement to access the link)
Steel beams were wilted and warped in odd ways, without any signs of severe heat or buckling stress. Notice the unusual wavy appearance of this steel beam, and the presence of rust. The edges of the beam are especially wavy and wrinkled. What could have caused this?
Image: facebook.com/drjudywood/pho…
Source (Photo from NIST): wtcdata.nist.gov/gallery2/v/NIS… (must enter from wtcdata.nist.gov main page and accept user agreement to access the link)
Steel beams were wilted and warped in odd ways, without any signs of severe heat or buckling stress. Notice the unusual wavy appearance of these steel beams, and the presence of rust. The edges of the beams are especially wavy and wrinkled. What could have caused this?
Image: facebook.com/drjudywood/pho…
Source: wtcdata.nist.gov/gallery2/v/NIS… (must enter from wtcdata.nist.gov main page and accept user agreement to access the link)
Steel beams were warped and wilted in odd ways, without any signs of severe heat or buckling stress. Notice the unusual wavy appearance of these steel beams, and the presence of rust. The edges of the beams are especially wavy and wrinkled. What could have caused this?
Image: facebook.com/drjudywood/pho…
Source: wtcdata.nist.gov/gallery2/v/NIS… (must enter from wtcdata.nist.gov main page and accept user agreement to access the link)
These are some of the many pieces of empirical evidence from 9/11 that are not explained by thermal or kinetic forces of any kind (e.g. airplanes, jet fuel, explosives, thermite, nuclear bombs).
Steel beams were wilted and warped in odd ways, without any signs of severe heat or buckling stress. Notice the unusual wavy appearance of this steel beam, and the presence of rust. The edges of the beam are especially wavy and wrinkled. What could have caused this?
Image: facebook.com/drjudywood/pho…
Source: wtcdata.nist.gov/gallery2/v/NIS… (must enter from wtcdata.nist.gov main page and accept user agreement to access the link)
Steel beams were wilted and warped in odd ways, without any signs of severe heat or buckling stress. This steel beam has partially separated into individual components. Notice the unusual wavy appearance of the steel, and the presence of rust. What could have caused this?
Image: facebook.com/drjudywood/pho…
Source (Photo from NIST): wtcdata.nist.gov/gallery2/v/NIS… (must enter from wtcdata.nist.gov main page and accept user agreement to access the link)
Steel beams were wilted and warped in odd ways, without any signs of severe heat or buckling stress. Notice the unusual wavy appearance of this steel beam, and the presence of rust. What could have caused this?
Image: facebook.com/drjudywood/pho…
Source(Photo from NIST): wtcdata.nist.gov/gallery2/v/NIS… (must enter from wtcdata.nist.gov main page and accept user agreement to access the link)
Steel beams were wilted and warped in odd ways, without any signs of severe heat or buckling stress. Notice the unusual wavy appearance of these steel beams, and the presence of rust. The edges of the beams are especially wavy and wrinkled. What could have caused this?
Image: facebook.com/drjudywood/pho…
Source (Photo from NIST): wtcdata.nist.gov/gallery2/v/NIS… (must enter from wtcdata.nist.gov main page and accept user agreement to access the link)
Steel beams were wilted and warped in odd ways, without any signs of severe heat or buckling stress. Notice the unusual wavy appearance of this steel beam, and the presence of rust. The edges of the beam are especially wavy and wrinkled. What could have caused this?
Image: facebook.com/drjudywood/pho…
Source: wtcdata.nist.gov/gallery2/v/NIS… (must enter from wtcdata.nist.gov main page and accept user agreement to access the link)
Steel beams were wilted and warped in odd ways, without any signs of severe heat or buckling stress. Notice the unusual wavy appearance of this steel beam, and the presence of rust. The edges of the beam are especially wavy and wrinkled. What could have caused this?
Image: facebook.com/drjudywood/pho…
Source (Photo from NIST): wtcdata.nist.gov/gallery2/v/NIS… (must enter from wtcdata.nist.gov main page and accept user agreement to access the link)
Steel beams were wilted and warped in odd ways, without any signs of severe heat or buckling stress. Notice the unusual wavy appearance of these steel beams, and the presence of rust. The edges of the beams are especially wavy and wrinkled. What could have caused this?
Image: facebook.com/drjudywood/pho…
Source: wtcdata.nist.gov/gallery2/v/NIS… (must enter from wtcdata.nist.gov main page and accept user agreement to access the link)
Steel beams were warped and wilted in odd ways, without any signs of severe heat or buckling stress. Notice the unusual wavy appearance of these steel beams, and the presence of rust. The edges of the beams are especially wavy and wrinkled. What could have caused this?
Image: facebook.com/drjudywood/pho…
Source: wtcdata.nist.gov/gallery2/v/NIS… (must enter from wtcdata.nist.gov main page and accept user agreement to access the link)
These are some of the many pieces of empirical evidence from 9/11 that are not explained by thermal or kinetic forces of any kind (e.g. airplanes, jet fuel, explosives, thermite, nuclear bombs).


What caused steel to shrivel in the WTC complex, without any signs of cracking or charring? What caused metal to shrivel in the Bankers Trust building (across the street), without any signs of cracking or charring? There were no fires in the Bankers Trust building (as noted in Figure 6-10 of the FEMA report), so what caused the metal beam to shrivel?
Closeup of shriveled steel from the next image. Steel beams were shriveled and warped in odd ways, without any signs of severe heat or buckling stress. Notice the unusual shriveled appearance of this steel beam, and the presence of rust. Heat from jetfuel or explosives do not explain this, so what could have caused this steel beam to shrivel?
facebook.com/photo.php?fbid…
Source: wtcdata.nist.gov/gallery2/v/NIS… (to access the link, first go to wtcdata.nist.gov and click 'accept' when the user agreement appears)
Steel beams were shriveled and warped in odd ways, without any signs of severe heat or buckling stress. Notice the unusual shriveled appearance of this steel beam, and the presence of rust. Heat from jetfuel or explosives do not explain this, so what could have caused this steel beam to shrivel?
facebook.com/photo.php?fbid…
Source: wtcdata.nist.gov/gallery2/v/NIS… (to access the link, first go to wtcdata.nist.gov and click 'accept' when the user agreement appears)
Shriveled steel from previous image. This person appears to be taking a sample of the steel for analysis. Notice the unusual shriveled appearance of this steel beam, and the presence of rust. Heat from jetfuel or explosives do not explain this, so what could have caused this steel beam to shrivel?
facebook.com/photo.php?fbid…
Source: wtcdata.nist.gov/gallery2/v/NIS… (to access the link, first go to wtcdata.nist.gov and click 'accept' when the user agreement appears)
This photo is from the Bankers Trust building, which was directly across the street from WTC2. Notice the wrinkled, warped metal beam hanging at the top of the photo. The FEMA report (Fig6-10) states there were no fires in this building, so why is this beam shriveled and burnt in appearance? Note the holes in the beam, yet the white paint above the shriveled portion is still good.
facebook.com/photo.php?fbid…
Source (Fig6-10): fema.gov/pdf/library/fe…
Again, there was NO FIRE in this building, so what caused this beam to shrivel? This photo is from the Bankers Trust building, which was directly across the street from WTC2. Notice the shriveled, warped metal beam hanging at the top of the photo. The FEMA report (Fig6-10) states there were no fires in this building, so why is this beam shriveled and burnt in appearance? Note the holes in the beam, yet the white paint above the shriveled portion is still good.
facebook.com/photo.php?fbid…
Source (Fig6-10): fema.gov/pdf/library/fe…
Hutchison Effect sample, Molybdenum bar after being affected by directed energy in a laboratory setting. Notice the strange curvature in the metal, without any signs of cracking, charring, or warping, even at the areas of greatest curvature.
facebook.com/drjudywood/pho…
Source: hutchison2006.blogspot.com/2007/07/more.h…
These are some of the many pieces of empirical evidence from 9/11 that are not explained by thermal or kinetic forces of any kind (e.g. airplanes, jet fuel, explosives, thermite, nuclear bombs).


What caused rapid spontaneous rusting of metals around ground zero to start occurring as early as midday on 9/11?
Notice the strange rust on the body of this firetruck. WTC7 is still standing in the background, revealing that this photo was taken early on 9/11 before the building was destroyed. Some areas have turned white, and the front bumper looks undamaged. Notice the astonishing vehicle damage which reaches the tire well, yet the tire is not melted. Why is there so much rust on this vehicle already, despite the fact that this photo was taken early in the day on 9/11? What can cause such strange damage to so many vehicles including this strange, rapid rusting? If the dust clouds from the WTC towers were not hot enough to burn pedestrians, paper, leaves, or cars, why were there so many 'toasted' cars after 9/11?
facebook.com/drjudywood/pho…
Source: wtcdata.nist.gov/gallery2/v/Col…
Spontaneous, rapid rusting? What could have caused this? These soldiers clearly are interested in this phenomenon.
facebook.com/photo.php?fbid…
Source: i24.photobucket.com/albums/c49/Ign…
Rust on another fire truck. Notice the sharp border between the rusted and non-rusted portions of the truck. What could have caused this spontaneous, rapid rusting?
facebook.com/photo.php?fbid…
(9/13?/01) Source: forums.therandirhodesshow.com/index.php?act=…
Closeup of the partially rusted firetruck from the last image. Notice the sharp border between the rusted and non-rusted portions of this fire truck. What could have caused this spontaneous, rapid rusting?
facebook.com/photo.php?fbid…
(9/12-13?/01) Source: i24.photobucket.com/albums/c49/Ign…
Another severely damaged fire truck. WTC7 is still standing in the background, revealing that this photo was taken early on 9/11 before the building was destroyed. Notice the astonishing destruction which reaches the tire well, yet the tire is not melted. Also note the presence of rust in several areas, despite the fact that this photo was taken early on the day of 9/11. What can cause such strange damage to so many vehicles including spontaneous, rapid rusting? If the dust clouds from the WTC towers were not hot enough to burn pedestrians, paper, leaves, or cars, why were there so many 'toasted' cars after 9/11?
facebook.com/photo.php?fbid…
Source: wtcdata.nist.gov/gallery2/v/Col…
Video (at 9:22): youtube.com/watch?v=V_AoDy…
September 16, 2001. It appears that pipes either rusted a lot or not at all. What could have caused such spontaneous, rapid rusting?
facebook.com/photo.php?fbid…
(Photo by Andrea Booher/ FEMA, 9/16/01) Source: photolibrary.fema.gov/photodata/orig…
Closeup of upper left quadrant of previous (original) photo showing thoroughly rusted pipes. Notice how bright their orange color is.
facebook.com/photo.php?fbid…
(Photo by Andrea Booher/ FEMA News Photo, 9/16/01) Source: photolibrary.fema.gov/photodata/orig…
Closeup of spontaneous, rapid rusting of WTC steel columns. Note that the rust is most severe near the warped areas of the beam. What could have caused this?
facebook.com/photo.php?fbid…
(Photo from NIST) Source: wtcdata.nist.gov/gallery2/v/NIS… (to access the link, first go to wtcdata.nist.gov and click 'accept' when the user agreement appears)
The amount of rust on beams adjacent to the hole in WTC6 is impressive. In the background, the remains of WTC1 can be seen on the other side of WTC6.
facebook.com/photo.php?fbid…
Rusted steel beams from ground zero.
facebook.com/photo.php?fbid…
(after 9/11/01) Source: bocadigital.smugmug.com/photos/1069725…
Stainless steel bar exhibiting spontaneous, rapid corrosion after being affected by directed energy in a laboratory setting; Hutchison Effect sample.
facebook.com/drjudywood/pho…
Source: hutchison2006.blogspot.com/2007/07/more.h…
These are some of the many pieces of empirical evidence from 9/11 that are not explained by thermal or kinetic forces of any kind (e.g. airplanes, jet fuel, explosives, thermite, nuclear bombs).
WhereDidTheTowersGo.com
DrJudyWood.com
CheckTheEvidence.com
Facebook.com/DrJudyWood


If NASA AVIRIS thermal imaging shows that fires were out and temperatures were no longer hot by September 23rd 2001, why was ground zero fuming and being hosed down for months and years after 9/11?
USGS Thermal Figure 1. Results of NASA Airborne Visible/Infrared Imaging Spectrometer (AVIRIS) remote sensing data and interpretations show the distribution and intensity of thermal hot spots in the area in and around the World Trade Center on September 16 and 23, 2001. Hot spots show as orange and yellow areas. Dozens of hot spots are seen on September 16, but most had cooled or the fires had been put out by September 23. Why did the fuming at ground zero continue for years after this time? What can cause long-term fuming without generating significant heat? : facebook.com/photo.php?fbid…
(9/16/01) Source: pubs.usgs.gov/of/2001/ofr-01…
USGS Thermal Figure 2. Results of NASA Airborne Visible/Infrared Imaging Spectrometer (AVIRIS) remote sensing data and interpretations show the distribution and intensity of thermal hot spots in the area in and around the World Trade Center on September 16, 2001. Hot spots show as orange and yellow areas. Dozens of hot spots are seen on September 16, but most had cooled or the fires had been put out by September 23. Why did the fuming at ground zero continue for years after this time? What can cause long-term fuming without generating significant heat? facebook.com/photo.php?fbid…
(9/16/01) Source: pubs.usgs.gov/of/2001/ofr-01… & pubs.usgs.gov/of/2001/ofr-01…
USGS Thermal Figure 3. Results of NASA Airborne Visible/Infrared Imaging Spectrometer (AVIRIS) remote sensing data and interpretations show the distribution and intensity of thermal hot spots in the area in and around the World Trade Center on September 23, 2001. Hot spots that remain would show as orange and yellow areas. Dozens of hot spots were seen on September 16, but most had cooled or the fires had been put out by September 23. Why did the fuming at ground zero continue for years after this time? What can cause long-term fuming without generating significant heat? facebook.com/photo.php?fbid…
(9/23/01) Source: pubs.usgs.gov/of/2001/ofr-01… & pubs.usgs.gov/of/2001/ofr-01…
September 27th, 2001. No longer "venting," the pile is now just "fuming." A hazy cloud of fumes wafts up from the WTC1 and WTC2 "piles". Where is it coming from? It does not seem to originate from a single point, but instead rises over a wide zone in a fairly uniform, hazy fashion. If AVIRIS thermal imaging shows that fires were out and temperatures were no longer hot by September 23rd 2001, why is the ground still fuming and being covered with dirt? Most of WTC3 disappeared during the destruction of WTC1, and the pedestrian walkway over the West Side Highway was connected to something that is no longer there. The remains of WTC2 can be seen near the center of the photo and the remains of WTC1 are partly visible in the lower right corner. Notice the distinct columns of the WTC tower lobby. facebook.com/photo.php?fbid…
(9/27/01) Source: photolibrary.fema.gov/photodata/orig…
October 13th, 2001. This is what is left of the WTC1 lobby. Notice the ongoing fuming as well as the lobby's distinct perimeter columns. If AVIRIS thermal imaging shows that fires were out and temperatures were no longer hot by September 23rd 2001, why is the ground still fuming and being covered with dirt? facebook.com/photo.php?fbid…
(10/13/01) Source: photolibrary.fema.gov/photodata/orig…
October 13th, 2001. If this were steam from "molten metal," the vehicles in that area would be permanently damaged. The truck wouldn't be parked so close to it. Note the extraordinary orange rust on the steel beams (left side of photo). If AVIRIS thermal imaging shows that fires were out and temperatures were no longer hot by September 23rd 2001, why is the ground still fuming and being covered with dirt? facebook.com/photo.php?fbid…
(Photo by Andrea Booher/ FEMA, 10/13/01) Source: photolibrary.fema.gov/photodata/orig…
October 20th, 2001. Notice the fumes still coming from the rubble, and the warped, twisted steel trusses on the left side of the photo. If AVIRIS thermal imaging shows that fires were out and temperatures were no longer hot by September 23rd 2001, why is the ground still fuming? A ground zero worker can be seen cutting steel beams using a thermic lance during cleanup operations. Steel beams sticking out of the ground were often cut at angles with these thermic lances. Video evidence of this can be seen at the links below. facebook.com/photo.php?fbid…
(Photo by Edward Keating/NYT, 10/20/01) Source: wtcdata.nist.gov/gallery2/v/Col…
October 28th, 2001. Looking east, through the core of WTC1, there is still fuming from the wet dirt. Note the puddle in the foreground. There are pools of water under a beautiful rainbow. Those orange-rusted core columns are very bright. If AVIRIS thermal imaging shows that fires were out and temperatures were no longer hot by September 23rd 2001, why is the ground still fuming and being hosed down? facebook.com/photo.php?fbid…
(Photo by Andrea Booher/ FEMA News Photo, 10/28/01) Source: photolibrary.fema.gov/photodata/orig…
October 31st, 2001. More fuming at ground zero. If this was steam, workers' faces would be burned and pressure hydraulics equipment would malfunction. If AVIRIS thermal imaging shows that fires were out and temperatures were no longer hot by September 23rd 2001, why is the ground still fuming and being hosed down? facebook.com/photo.php?fbid…
(10/31/01) Source: w3.org/People/Jacobs/…
October 31st, 2001. More fuming at ground zero. If this was steam, workers' faces would be burned and pressure hydraulics equipment would malfunction. If AVIRIS thermal imaging shows that fires were out and temperatures were no longer hot by September 23rd 2001, why is the ground still fuming and being covered with dirt? facebook.com/photo.php?fbid…
(10/31/01) Source: img.timeinc.net/time/photoessa…
March 15th, 2002. Why are they still hosing down the "pile" in March 2002? There appears to be smoke, dust, or vapor rising from the pile. Why? The light streaks across the photo appear to be reflections off the window of the photographer's aircraft. If AVIRIS thermal imaging shows that fires were out and temperatures were no longer hot by September 23rd 2001, why is the ground still fuming and being hosed down months later in March 2002? facebook.com/photo.php?fbid…
(Photo by Larry Lerner, FEMA, 3/15/02) Source: photolibrary.fema.gov/photodata/orig…
June 2006, looking north in the big WTC foundation 'bathtub', notice pockets of fuming where digging is occurring. This is why they need the dirt. The new WTC7 is in the distance, on the right. If AVIRIS thermal imaging shows that fires were out and temperatures were no longer hot by September 23rd 2001, why is the ground still fuming years later in 2006? facebook.com/photo.php?fbid…
(6/?/06) Source: panynj.gov/drp/images/gal…
September 2006, notice pockets of fuming where digging is occurring. This is why they need the dirt. If AVIRIS thermal imaging shows that fires were out and temperatures were no longer hot by September 23rd 2001, why is the ground still fuming years later in 2006? facebook.com/photo.php?fbid…
(9/?/06) Source: panynj.gov/drp/images/gal…
The Hutchison Effect - Iron Bar Warping and Fuming from Directed Energy (Laboratory Experiment)
Video: youtube.com/watch?v=tnBdhs…
These are some of the many pieces of empirical evidence from 9/11 that are not explained by thermal or kinetic forces of any kind (e.g. airplanes, jet fuel, explosives, thermite, nuclear bombs).


The technical details of 9/11 are very important, because understanding WHAT actually happened to the WTC buildings on 9/11 must be understood with a high degree of accuracy and precision before proceeding to determine WHO did it and WHY. We must present and discuss the empirical evidence from 9/11 as accurately and precisely as possible, so that others will view this important evidence with serious consideration. To help emphasize this important point, I would like to share some words from a fellow scientist.
"Anyone declaring who did what or how they did it before they have determined what was done is merely promoting either speculation or propaganda. The popular chant, "9/11 was an inside job," is, scientifically speaking, no different from the chant that "19 bad guys with box cutters did it." Neither one is the result of a scientific investigation supported by evidence that would be admissible in court. Neither identifies what crime was committed or how it was committed. The order of crime solving is to determine:
1) WHAT happened, then
2) HOW it happened (e.g., what weapon), then
3) WHO did it. And only then can we address
4) WHY they did it (i.e. motive).
Let us remember what is required to (legally) convict someone of a crime. You cannot convict someone of a crime based on belief. You cannot convict someone of a crime if you don't even know what crime to charge them with. If you accuse someone of murder using a gun, you'd better be sure the body has a bullet hole in it. Yet, before noon on 9/11/01, we were told who did it, how they did it, and why they did it (they hate us for our freedoms); before any investigation had been conducted to determine what had even been done.
Many people have speculated as to who committed the crimes of 9/11 and/or how they did so. But without addressing what happened, speculation of this kind is nothing more than conspiracy theory. My research is not speculation. It is a forensic investigation of what happened to the WTC complex on 9/11." -Dr. Judy Wood, Ph.D. (Materials Science Engineer)
As for the question of 'who' truly orchestrated the 9/11 attacks, the large and conclusive body of verifiable, physical evidence from 9/11 mostly points to a relatively small number of private weapons, defense, and security corporations, which happen to be some of the leading corporations involved in directed energy research. These corporations are some of the primary 9/11 suspects which must be brought to court for evidence-based interrogation and public questioning. Although it's possible that these corporations, their owners, and/or their employees could be affiliated with other organizations, agencies, or individuals, it is at these corporations specifically which the large body of evidence from 9/11 mostly points. In addition, a group of Israeli citizens temporarily staying in the U.S. were arrested on 9/11 after being seen suspiciously filming and celebrating the 9/11 attacks as they happened, suggesting that they may have had foreknowledge of the attacks. Once back in Israel, they were observed on a television show stating that they were "sent to document the event," which is concerning. Investigations that followed the arrest of the ‘dancing Israelis’ revealed a significant Israeli spy operation in the U.S. that sold a toy helicopter (Zoom Copter) to disguise their illegal spy operation. It is unclear if the "dancing Israelis" or the ‘Zoom Copter’ spy operation are linked to these private weapons, defense, and security corporations.
The National Institute for Standards and Technology (NIST) and many private weapons, defense, and security corporations [e.g. Science Applications International Corp. (SAIC), Applied Research Associates (ARA), and many others] engaged in an enormous conflict of interest when NIST contracted these private corporations to conduct the fraudulent 9/11 "investigations" using our tax dollars (it's like paying a fox to investigate the attack on a farmer's chickens even though the fox is the primary suspect). It is NIST and these private weapons, defense, and security corporations, many of which are associated with the Directed Energy Professional Society (DEPS), that are the primary suspects of the 9/11 attacks, not necessarily our government. It is NIST and these suspect corporations that we must bring to court for evidence-based interrogation and public questioning.
The primary connection between the federal government and the corruption surrounding 9/11 is the organization known as the National Institute for Standards and Technology (NIST), as they are the government entity that committed science fraud based on the Data Quality Act during the fraudulent 9/11 "investigations", which ultimately gave rise to the extremely unscientific "official story" known as the '9/11 Commission Report'. NIST has clearly helped promote a 9/11 cover-up by committing science fraud, ignoring large amounts of evidence, and using unscientific explanations to deceive most of the public into mistakenly believing a gravity-driven "collapse" occurred on 9/11. Although it's uncertain how deeply the federal government is involved in this corruption, there is irrefutable evidence linking the government entity NIST to the 9/11 cover-up. If we focus on the large and conclusive body of verifiable, physical evidence from 9/11, it will lead us to those corporations, organizations, and entities that were involved in the 9/11 cover-up, and ultimately the 9/11 attacks.
In 2007, Dr. Judy Wood and her attorney Dr. Jerry Leaphart took legal action against the private corporations that the National Institute for Standards and Technology (NIST) had contracted with to conduct the fraudulent 9/11 "investigations", many which are the leading weapons, defense, and security corporations involved in directed energy research (an enormous conflict-of-interest). The filings in these legal efforts included Requests For Corrections (RFC) based on the Data Quality Act, and a Qui-Tam federal whistleblower lawsuit. The federal qui-tam case was so strong, thanks to all the physical evidence that Dr. Wood has gathered, that it was successfully appealed to the level of the U.S. Supreme Court in October 2009, despite the attempts of the corporate defense lawyers pushing for premature dismissal of the case at each level of appeal. The case was then unlawfully dismissed without being heard by the U.S. Supreme Court, and this is detailed in the legal documents found on Dr. Wood's website and in her textbook 'Where Did The Towers Go?'. To this day, Dr. Judy Wood is the only individual who has submitted physical evidence in the form of a lawsuit to pursue truth and justice for our nation and planet. The legal documents from her court cases can be viewed at the following links:
1. drjudywood.com/articles/NIST/…
2. drjudywood.com/articles/NIST/…
WhereDidTheTowersGo.com
DrJudyWood.com
CheckTheEvidence.com
Facebook.com/DrJudyWood


I have only shared a few pieces of empirical evidence from 9/11 above. There is so much more evidence available. However, let us pause here, so I can ask you one very simple question.
What can explain the verifiable, accurate, empirical evidence that I shared with you above? Please feel free to provide the explanation that you think best explains the evidence above. (Hint: You can use the attached table below to compare possible explanations.)
Please note, if anyone attempts to divert attention away from the important forensic evidence that I shared above in any way, I will promptly bring our focus back to the evidence.
Please note, if anyone attempts to engage in ad hominem attacks or other logical fallacies, or any other type of disingenuous or disrespectful behavior, I will promptly bring our focus back to the forensic evidence, and I will start posting more forensic evidence for all to see.
@realDonaldTrump @DonaldJTrumpJr @EricTrump @JDVance @DanScavino @RobertKennedyJr @NicoleShanahan @RepThomasMassie @SenRandPaul @EagleEdMartin @elonmusk @GenFlynn @TulsiGabbard @Kash_Patel @PeteHegseth @PamBondi @LizCrokin @KenOKeefe1TJP @RealCandaceO @realstewpeters @joeroganhq @TonySeruga @GrrrGraphics @Jim_Jordan @mtgreenee @realannapaulina @RepBoebert @RogerJStoneJr @Cancelcloco @charliekirk11 @JamesOKeefeIII @w_terrence @DavidJHarrisJr @RealBrysonGray @ifamericansknew @jakeshieldsajj @SamParkerSenate @iluminatibot @LetsGoBrando45 @TheOfficial1984 @CensoredMen @truthtroll_X @TrackAIPAC @realMikeLindell @conservmillen @ElijahSchaffer @KarluskaP @MAGAMattyQ @C__Herridge @KAGdrogo
Theory, speculation, and belief are not necessary to understand that directed energy technology was used on 9/11, rather, only detailed study of the empirical evidence from 9/11 is necessary. Situations like this are rare in science, when there is so much empirical evidence that one can bypass theory and speculation to draw an irrefutable conclusion from the evidence. This also helps to clarify a major difference between Dr. Judy Wood and other 9/11 researchers, as she did not start with theory or speculation and then begin researching to see if it was consistent with the evidence. Instead, Dr. Wood simply did what any objective, vigilant scientist would do, she gathered and studied as much of the empirical evidence from 9/11 as possible, assembling a monumental database of verifiable physical evidence that dwarfs the efforts of any other 9/11 "research", including the unscientific '9/11 Commission Report'. After gathering and studying all of this important evidence, Dr. Wood arrived at the only logical, inescapable conclusion that explains all of this evidence, a general category of weapon technology known as 'directed energy weapons' (DEW). It would be theory or speculation to suggest additional weapon details beyond this, such as the possible serial number or location of the weapon, because that is not what the evidence allows us to irrefutably conclude.
Dr. Judy Wood, Ph.D | 9/11 Breakthrough Energy Technology youtube.com/watch?v=vadSaW…
IRREFUTABLE 'Introduction to the Evidence' 9/11 Video Series: youtube.com/watch?v=BxA2cZ…
This table briefly summarizes and compares the various explanations that attempt to address the large body of empirical evidence from 9/11 (table from Dr. Judy Wood's presentation at the 2012 'Breakthrough Energy Movement' conference in Holland). facebook.com/drjudywood/pho… Source: drjudywood.com & vimeo.com/57923364
These are some of the primary inescapable and irrefutable conclusions revealed by the large body of verifiable, forensic evidence from 9/11:
1) This is a large and conclusive body of verifiable, forensic evidence from 9/11, which mostly consists of empirical evidence, with a large quantity of testimonial evidence as well. (FACT)
2) This large body of verifiable, forensic evidence is conclusive, because it can only be successfully explained by one type of destructive force, and nothing else comes close. (FACT)
3) Thermal and kinetic forces of any kind (e.g. jet fuel, airplanes, explosives, thermite, nuclear bombs, etc.) are not even remotely consistent with the large body of verifiable, forensic evidence from 9/11. (FACT)
4) Only the general category of weapon technology known as 'directed energy weapons' (DEW) can successfully explain all of the forensic evidence from 9/11, and it does so completely and irrefutably, while nothing else comes close. (FACT)
5) In other words, the large body of verifiable, forensic evidence from 9/11 reveals the inescapable, irrefutable conclusion that a general type of weapon technology known as 'directed energy weapons' was used to transform the WTC buildings mostly to fine dust in midair on 9/11. (FACT)
Please consider the following simplified example as it helps to clarify the important difference between theory/speculation versus a conclusive body of evidence. Let's pretend my attorney provided you with the following verified and certified factual evidence: I own a common household pet, that's a mammal, has four legs, has sharp teeth, eats meat, has lots of hair, barks very loudly, drools when I place food in front of him, wags his tail when excited, eats from under the table, often chases cats, can be trained to do many tricks including 'sit', 'stay', and 'roll over', can play "fetch", has a strong sense of smell, is often used by law enforcement to fight crime, is often used for hunting, is closely related to wolves, and is known as "man's best friend". Based on this factual information, you can irrefutably conclude that I own a dog, because there is no other possible explanation to account for all of the verifiable facts that are available to describe my pet. You don't need theory or speculation, rather, you simply need to study all of the factual evidence that's available to describe my pet in order to be absolutely certain that it's a dog. By studying all of the available factual evidence in this exercise, you can irrefutably know that I own a general category of animal known as a dog, because the evidence is overwhelmingly conclusive. However, if you were to try and guess the specific breed or color of the dog I own, that would be theory or speculation, because the verifiable body of factual evidence only allows you to irrefutably conclude that I own a general category of animal known as a dog.
High Definition Clip of WTC1 Turning to Dust in Midair on 9/11 (Slow Motion) youtube.com/watch?v=dueVm1…
Dustification | Episode 3, IRREFUTABLE: Classified Free-Energy Technology Revealed to the World youtube.com/watch?v=x2IMiQ…
Media Acknowledges Steel Turned to Dust on 9/11 (Full Clip) | ABC News youtube.com/watch?v=eJb-GP…
The empirical evidence from 9/11 is also overwhelmingly conclusive, because there is only one thing that can explain it all, and nothing else comes close. Only the general category of weapon technology known as 'directed energy weapons' (DEW) can explain all of the empirical evidence from 9/11, and it does so completely and irrefutably. I hope this helps clarify the difference between theory versus a conclusive body of evidence, and why studying all of the empirical evidence from 9/11 is so important.
Even Richard Gage, the leader of 'Architects & Engineers for 9/11 Truth' (AE911Truth), admitted to me that thermite does not explain the evidence from 9/11, and that he has not studied the important Columbia University NYC seismographic data. He also lies to the public and censors the many pieces of evidence that thermite can't explain. I recorded his suspicious responses on video when I questioned him at a presentation in Peoria, IL. Watch: youtube.com/watch?v=qBP9mN…
Please study the large and conclusive body of verifiable, physical evidence from 9/11, including the Columbia University NYC seismographic data, University of Alaska magnetometer data, United States Geological Survey (USGS) dust analysis, National Aeronautics and Space Administration (NASA) AVIRIS thermal imaging, NASA AVIRIS dust and iron (ferrous/ferric) spectrometer imaging, 7 total WTC buildings destroyed on 9/11, WTC1 & 2 steel turning to dust in midair, WTC1 'lathering up', WTC7 'lathering up', WTC2 falling dust trails, WTC1 & 2 minimal seismic impact, WTC7 minimal seismic impact, WTC lack of P-wave seismic signal, National Oceanic and Atmospheric Administration (NOAA) verified Hurricane Erin (category 3), WTC1 & 2 rapid speed of destruction, WTC1 & 2 top-down direction of destruction, WTC7 'free fall' destruction, disappearance of most of WTC4, vertical cylindrical holes in surrounding WTC buildings, relative lack of rubble compared to explosive controlled demolitions, lack of major damage to surrounding non-WTC buildings other than Bankers Trust, rapid spontaneous rusting of WTC metals, rapid spontaneous rusting of Bankers Trust metals, 1400+ 'toasted' and warped cars up to 1/2 mile away, numerous flipped cars, spontaneous 'weird' fires, ground zero fuming for years without high heat, truck loads of fresh dirt being hauled in and out of ground zero for years, numerous unharmed survivors in WTC stairwells, mostly undamaged WTC shopping mall, mostly undamaged PATH trains, mostly undamaged WTC 'Bathtub' foundation, presence of dust 'fuzzballs', strange round window holes, shriveled WTC steel beams, strangely curved steel beams, wavy steel beams, vertical axis 'rolling up' of steel beams, thinning of steel beams, holes in steel beams, Bankers Trust warped and shriveled metal beams, objects fusing with unburned paper, missing file cabinets, missing office machinery, missing office furniture, missing toilets, missing door knobs, lack of high heat, cool temperature of WTC dust, unburned paper, unburned clothing, unburned pedestrians, elevated levels of tritium, lack of ionizing radiation, glowing and molten materials, spontaneous explosion of Scott air tanks, numerous similarities between 'The Hutchison Effect' and phenomena observed at ground zero, and much more.
WhereDidTheTowersGo.com
DrJudyWood.com
CheckTheEvidence.com
Facebook.com/DrJudyWood

@threadreaderapp unroll
• • •
Missing some Tweet in this thread? You can try to
force a refresh


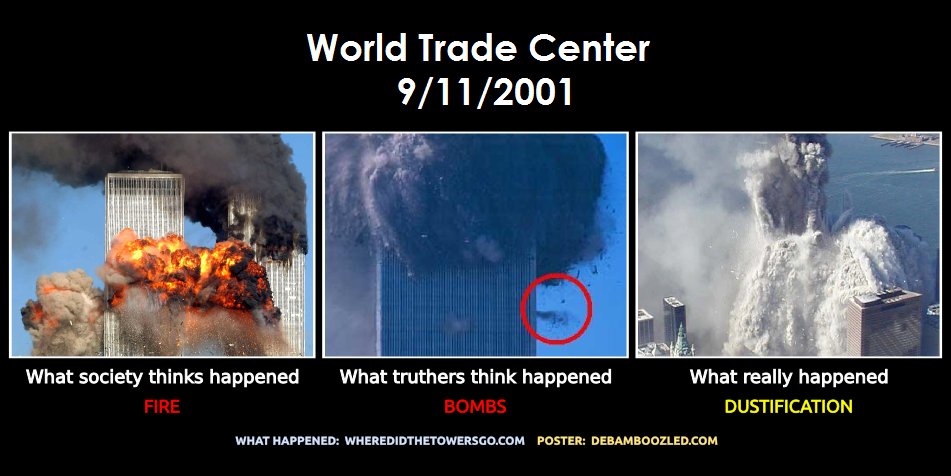


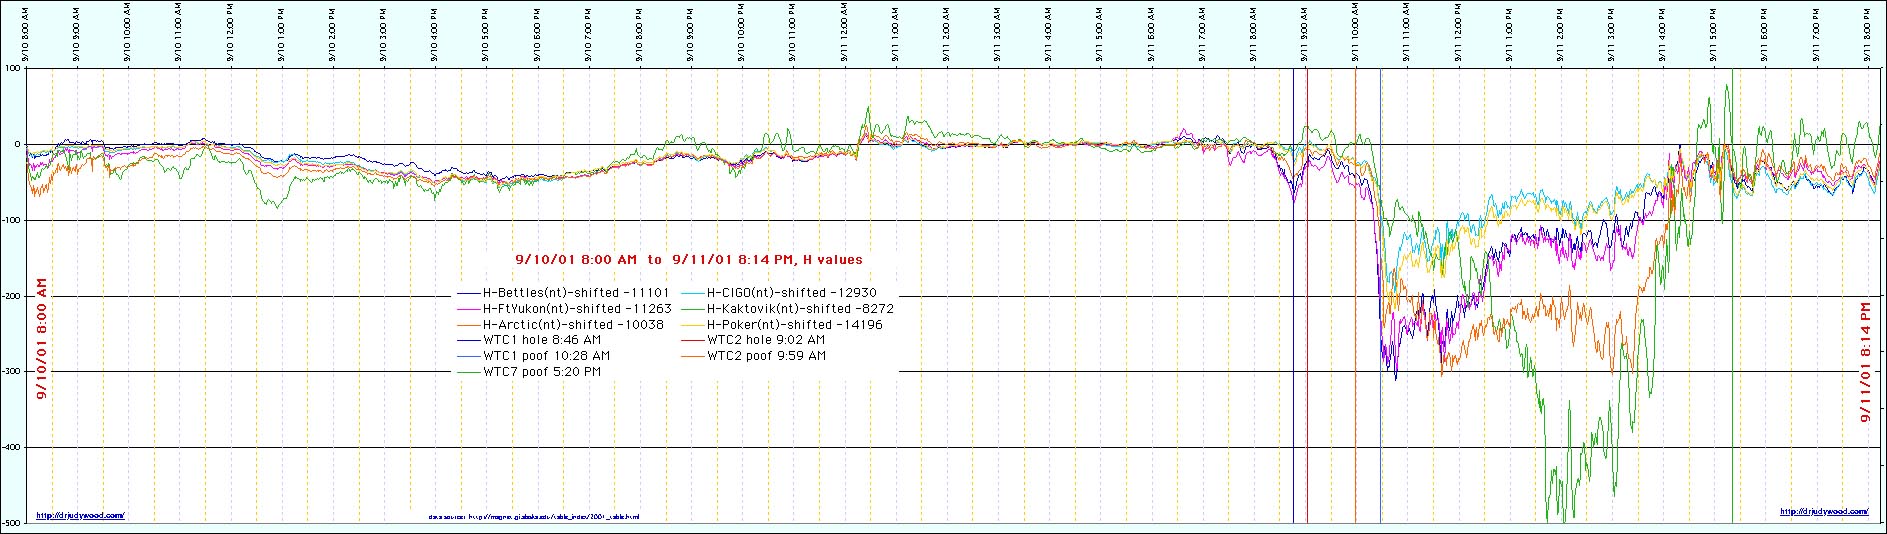
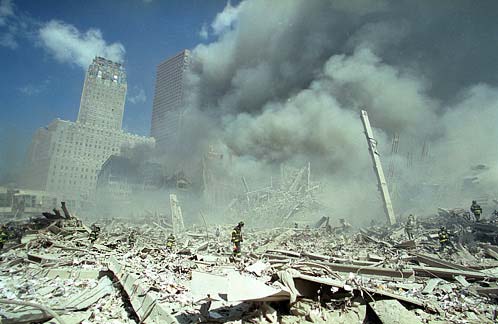
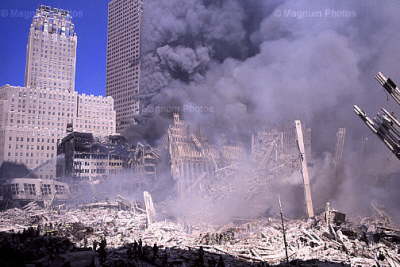
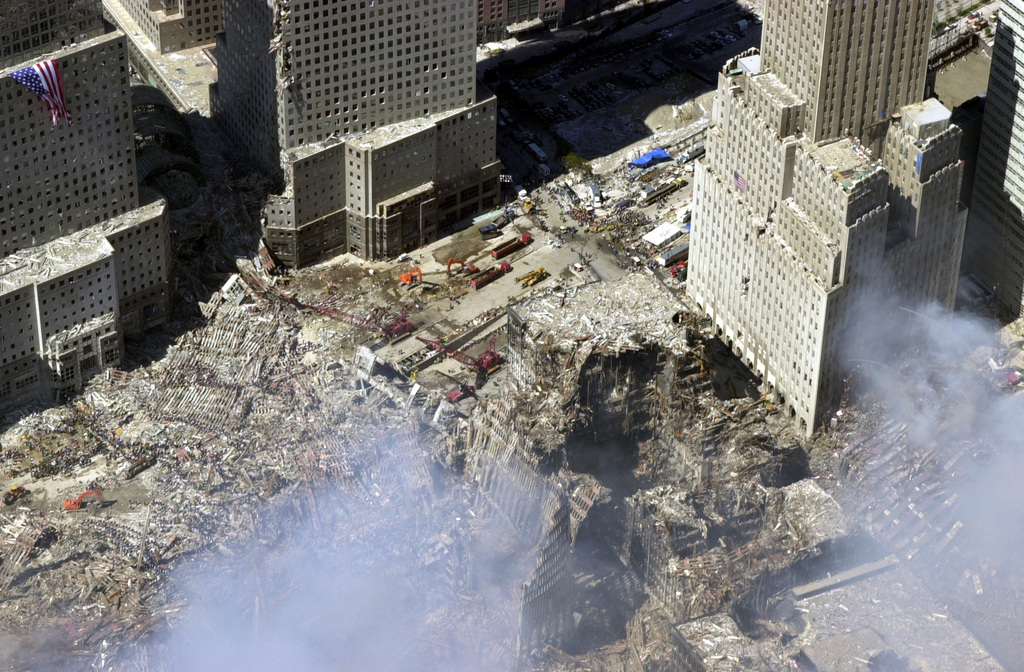
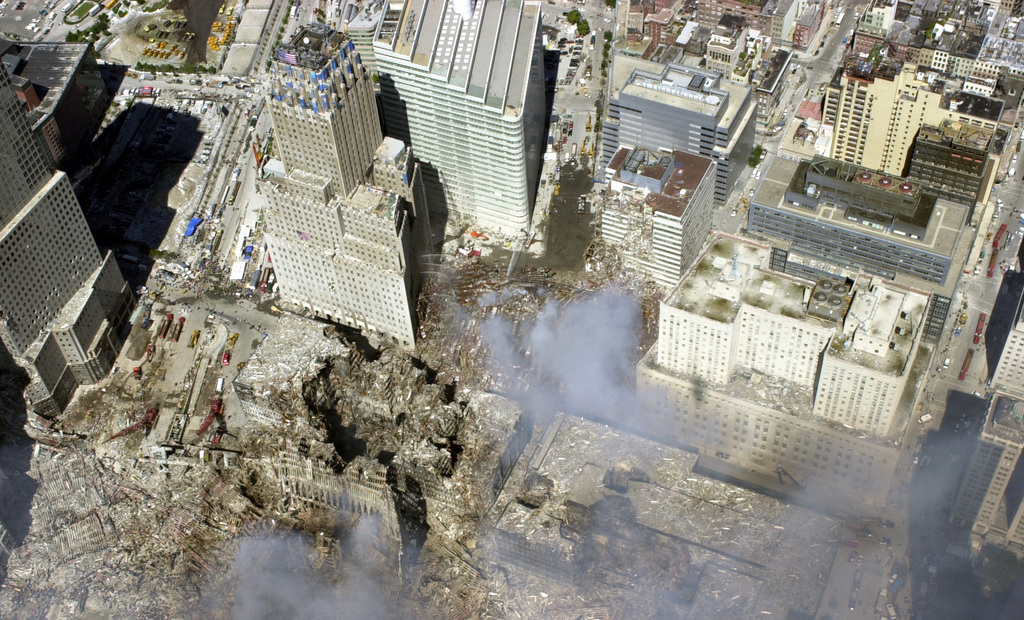
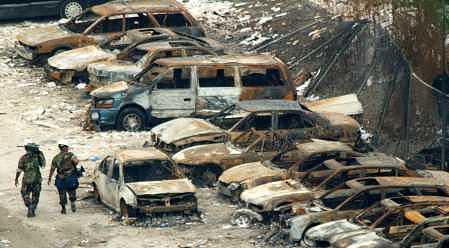
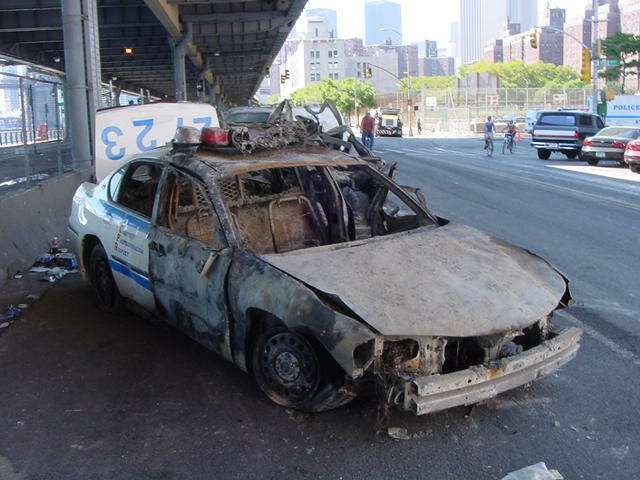
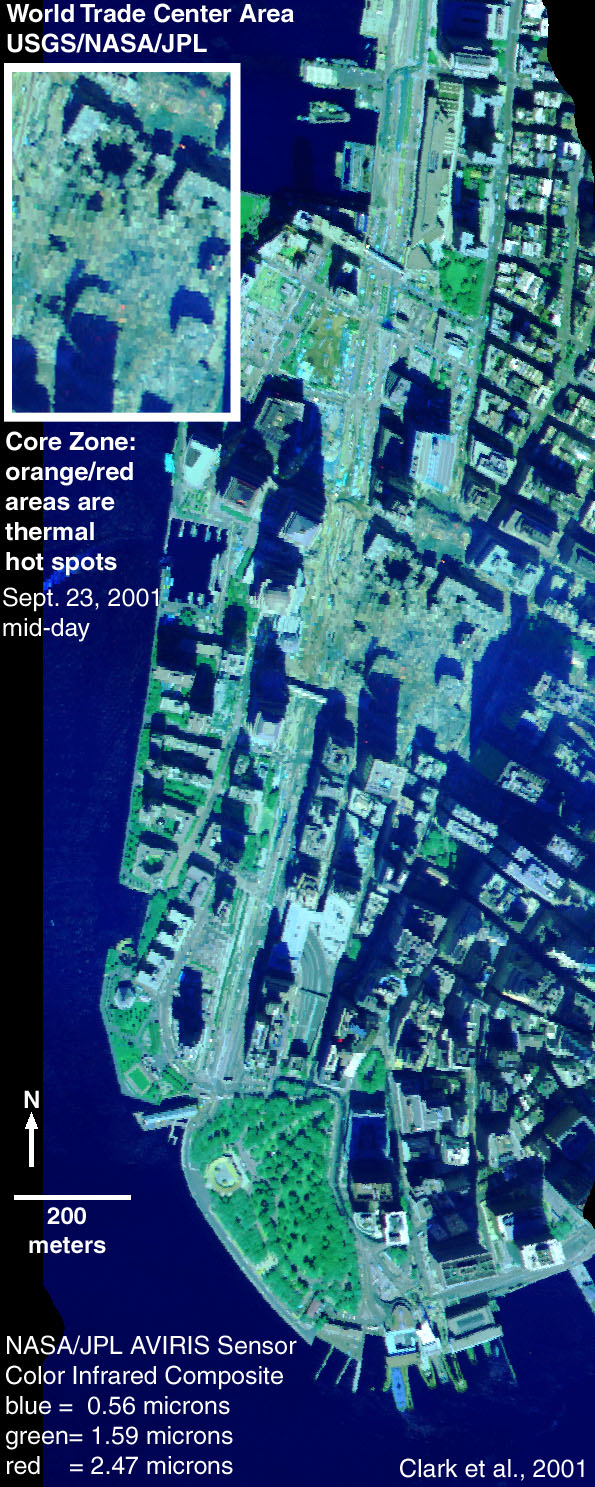
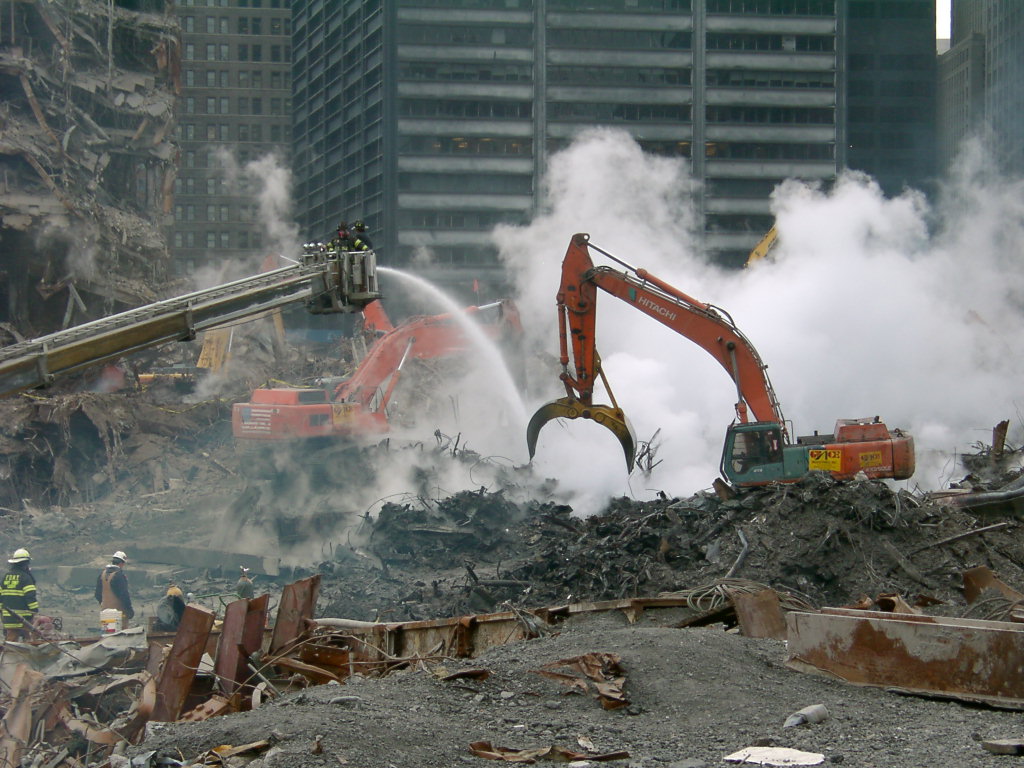