Can Europe learn from Ghana? Buried on Wikipedia is a 3 sentence part about how Ghana deported 20% of the population -- 3 million people -- all the non-Ghanans. And it only took 3 months. The "Ghana Aliens Compliance Order" (GACO)
This website provides the history. It begins, of course, with economic migration since Ghana was the gold coast. In fact, these migrants were going into a British colony, probably for the usual reasons of wanting to live under European domain: rule of lawand prosperity.
European rule eventually declined, and just after they left (1957), the economy goes bad. At least, so they say, but it doesn't look that way until 1970s by GDP stats.
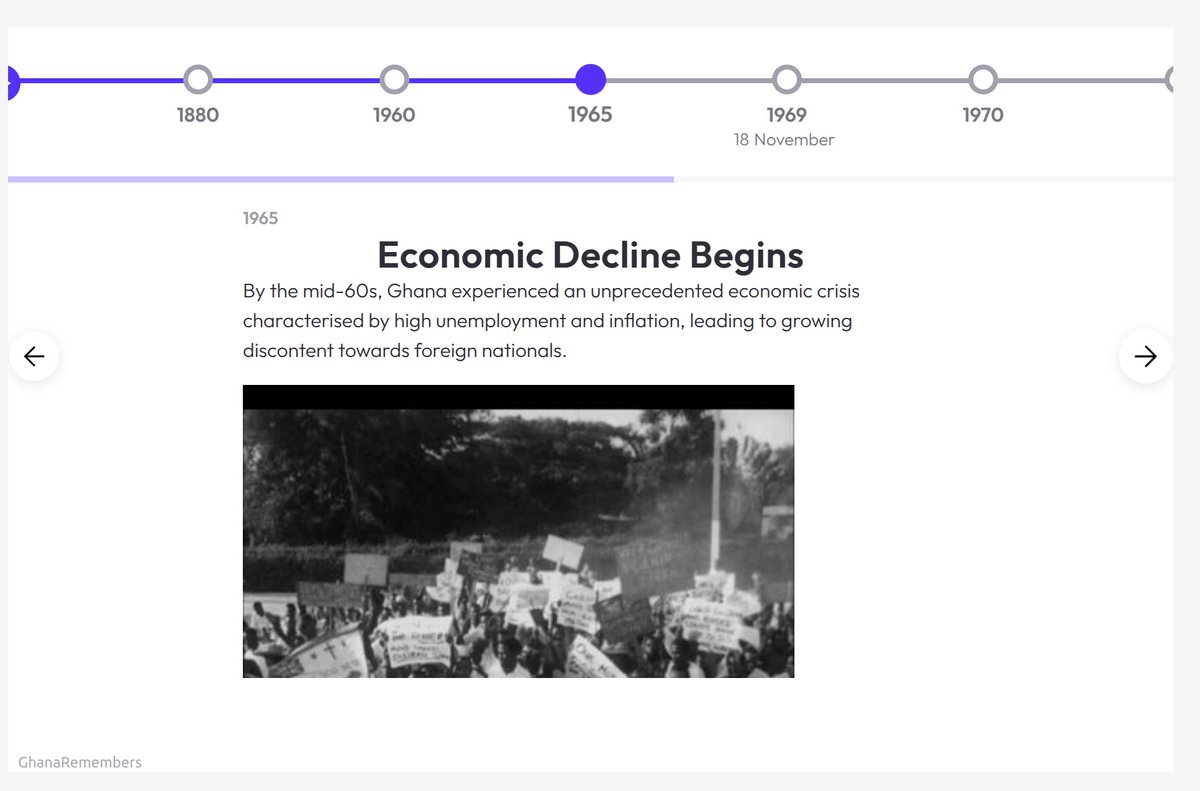
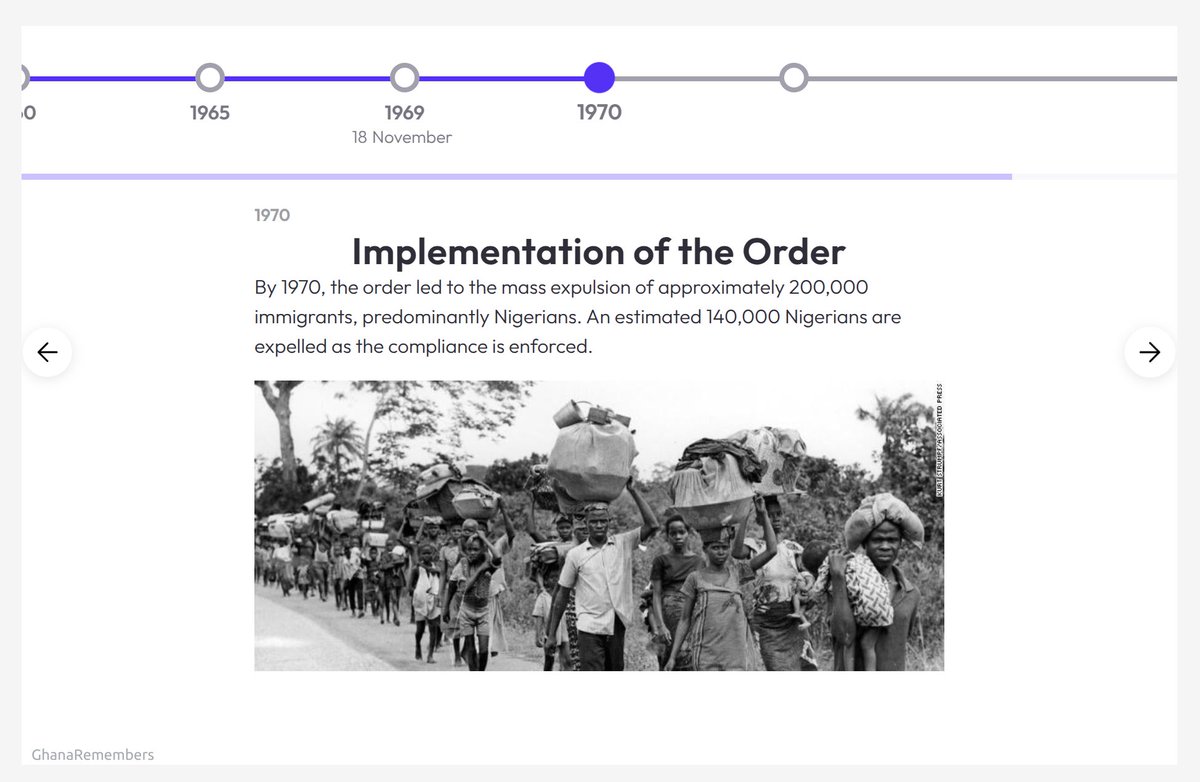
So the government decides to expel the foreigners, and it works out in 3 months despite being a staggering number of people. It the economy keeps failing for another 15 years, but then recovers and growth looks good since 1983.
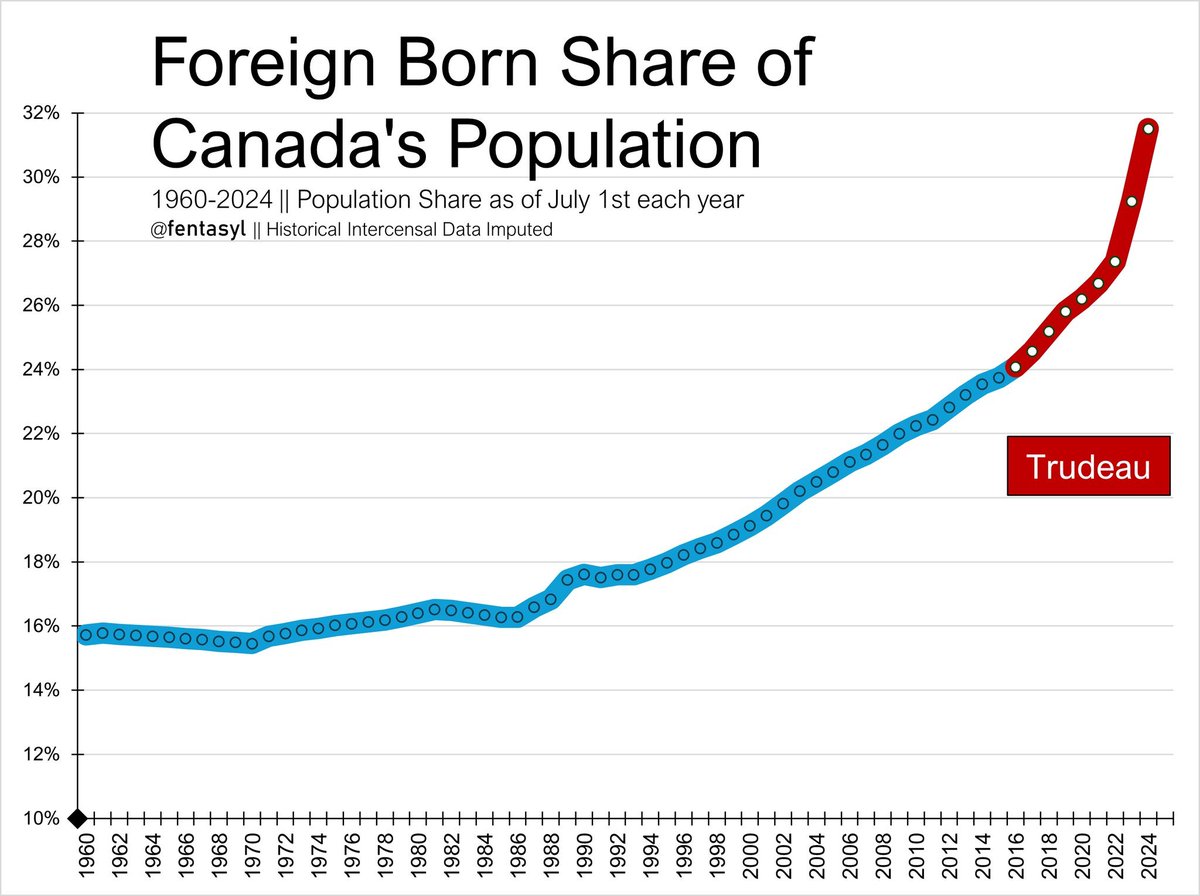
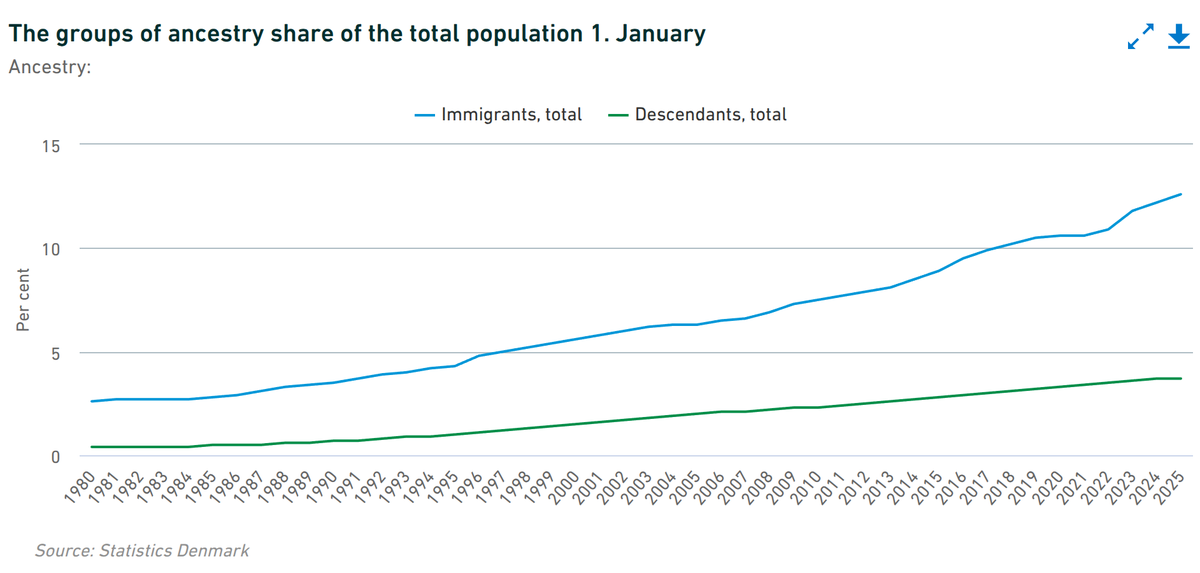
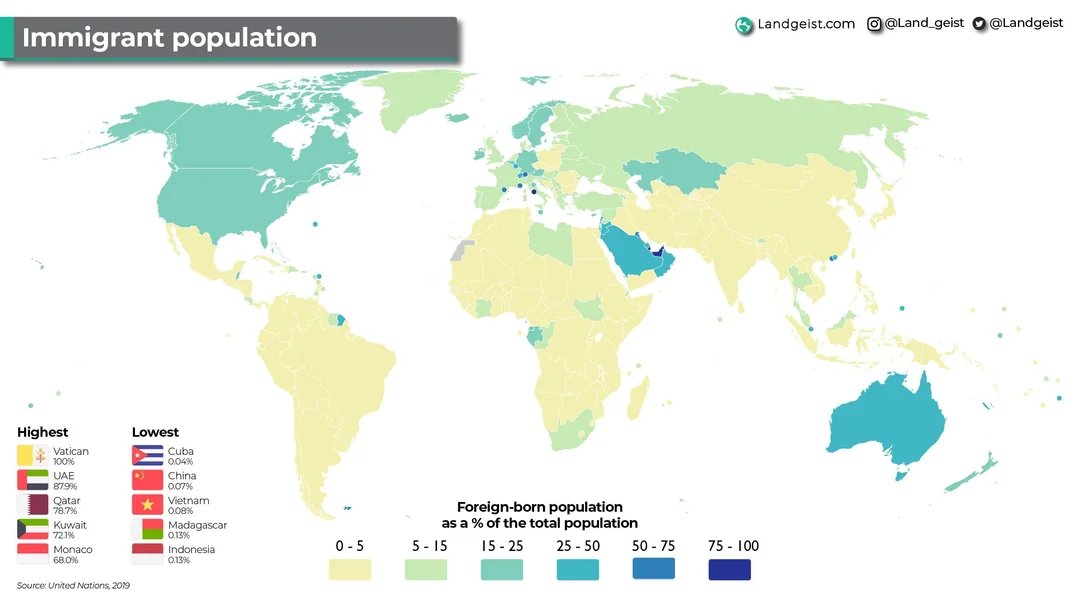
Wikipedia seems to be wrong about the number. It's not 3 million people out of Ghana. It was some hundreds of thousands. Sources don't really know. But Ghana had 12% foreign born in 1960, similar to a typical western country.
Using public data on first names, one can figure out how fast the population replacement is happening in France despite the ban on informative statistics. Selected results.
As elsewhere, the foreign born are clustered in cities.
Foreign born is a decent proxy for where the Muslims and Africans are having children.
In economics of economic growth, it is often seen that countries have catch-up growth, called the advantage of backwardness. We can see this in OECD using GDPpcppp numbers.
However, looking at the world at large for the same period (2000-present), the picture is not so clear. R2 dropped from 52% to 9%. Looking at the plot, most of the dots that didn't grow as expected are Africans. It's another example of OECD fallacy, one can get substantially wrong ideas about how the world works by only looking at a subset of mostly European, above average countries.
We can see the role of national intelligence here. A simple way is just splitting the data into some groups. Higher IQ countries show much stronger convergence, and the low IQ countries grow quite slowly. This is essentially the story of how Asian tigers had strong economic growth starting poor, including China.
Who does hate speech law protect? Well, in Denmark the prosecutor's office has an overview, a summary of every case since 2001 or so. The targets of the utterances that led to guilty verdicts are shown below.
Thus, only 1 case of 142 protected Danes, and it was kinda incidental because the guy was insulting Danes and Jews combined, apparently because he was angry about Gaza getting rekt by Israel.
I expect results would be similar for other western countries. These laws are pernicious, only protect minorities, despite ostensibly being neutrally formulated. You can basically smear Danes in Denmark as much as you want as long as you don't do it because they are gay.
Our new meta-analysis of American race gaps in IQ/intelligence is out! The main results didn't change that much, with 2 exceptions:
First, there appears to be reverse publication bias for Black IQs, smaller studies find _larger_ values. This is a prediction from leftism bias model, since social scientists hack in the preferred direction, which is usually positive, but sometimes negative. Adjusting for this gives a Black IQ estimate 82 instead of 85.
The formal meta-analysis models did not find any changes over time, but if one looks at the plot, there is some trend, p > 5%.
Happy to release our newest and largest admixture project. 🧵 Thread with the main findings.
First, we compiled data from 100s of sources to estimate genetic ancestry for over 400 units in the Americas. These are countries and subnational divisions of the larger countries, such as US states, Canadian provinces, various Caribbean islands. Results can be seen in these 4 maps.
It was a real pain in the ass to merge the spatial data to produce the maps!
Next up, we gathered cognitive ability data from international datasets, and various regional and subnational scholastic tests, and any other source of standardized testing we could find. These were then converted to British international norms (Greenwich mean IQ) as best we could. It gives this map.