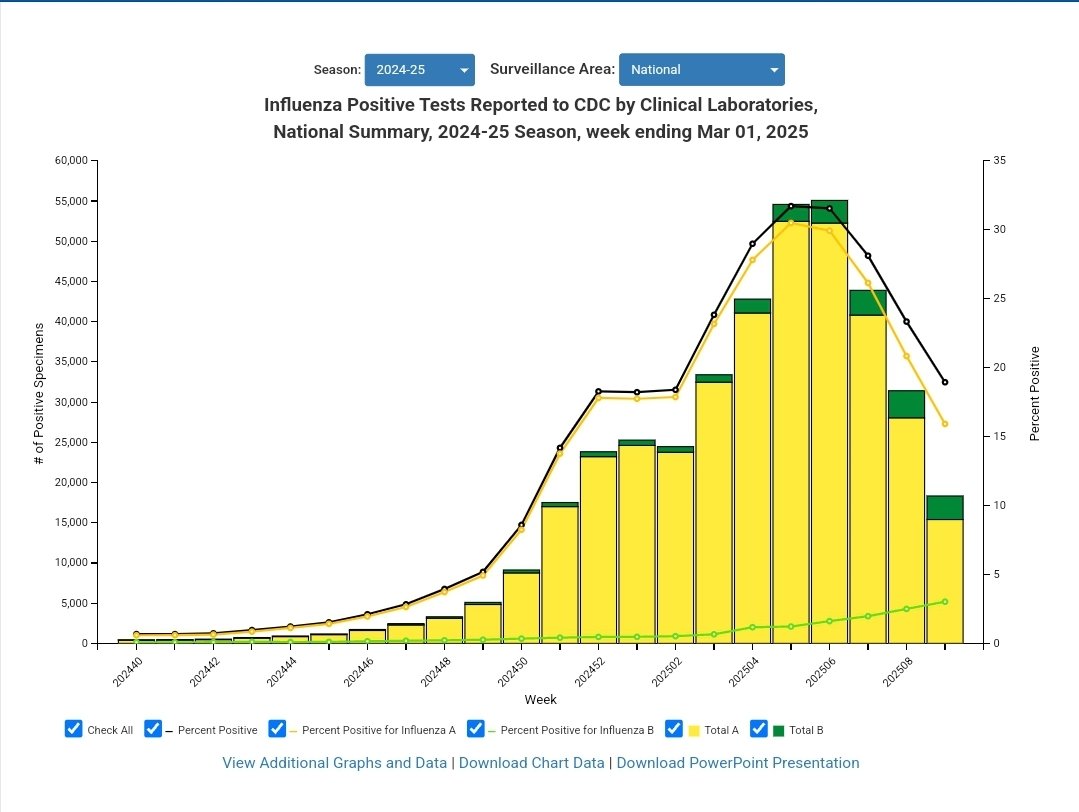
▶️ An interesting saltation was found yesterday by variant trackers.. 3 samples of a highly divergent BA.3 in South Africa with 57 AA spike mutations. Samples were taken Nov-Jan, so it doesn't have a ton of speed (at least yet), but is worth watching. 1/
It currently lacks both 455 and 456 mutations that have been critical for immune escape in the last 16 months. If it is able to find those before its candle runs out, I think it has a chance to outcompete the current variants. 2/
I completely agree with this take from @LongDesertTrain - I was pessimistic about BA.2.87 due to the uphill battle against JN.1. The current relatively slow movement of variants could give this new BA.3 enough time to evolve mutations to jump start spread
How accurate are my infection estimates? The calibration is based on 2020-early2022 historical WW&case data, so we have no easy way to validate today's calibration in the US.
But we do have *measured* UK prevalence in December 2023 that arrives very close to my US estimates.
This is unfortunately about as good of validation as we can have since we don't measure prevalence directly in the US. UK and US are obviously not the same entity, but they do tend to spike together in December each year. Their data was not used to feed my calibration, so it..
..is reassuring that they arrived at very similar numbers on their actual prevalence measurements.
It would be great if the US did a similar measured prevalence study of their own, but we don't have anything like that at the moment.
The sequence from the 2nd severe H5N1 case in North America (Louisiana) has been released, and again, ⚠️has mutations that favor a2,6. Is it simply a coincidence that both severe cases have 2,6 favoring mutations? Or is this an indication of severity with 2,6?
I don't like this.
PSA (again): *Never* use the last 3 or 4 days of WWscan averages. They're always wrong, and I keep seeing this mistake being made. Half the time it's a straight line up or down. The midwest showed a vertical spike a couple days ago then it got reduced by 40% a day later.
@WastewaterSCAN is a fantastic resource, but it has an averaging issue in the latest few data points, as they dont have samples from all of their sites yet, so it's not comparing apples to apples. They should consider averaging to tmax-4 days in their algorithm.
By the way here is what the NE looks like with t-5 days
Increasing numbers this week as the holiday season kicks in. I believe the prior week was undersampled and this week was oversampled. ED data shows a slower rise over 2 wks (next post)
🔸286,000 new infections/day
🔸1 in every 112 people currently infected
Emergency department data is currently 5 more days up to date than WW, and the trend looks quite different. Slow, steady increases. The reality may lie somewhere between them. I didn't post a WW update last week because I thought the decrease was a mirage.
Either way, we are still over 3x lower on case levels than the prior two years at this time. But we are getting back to moderate levels of spread- just not the large surge we are used to at this time.
Given recent data, the expected peak has decreased even further, and the range has shrunk.
This is now guaranteed to be a record low for Holiday infection rates, hospitalization, and deaths.
A comparison of Holiday surge estimates from 2020 to 2024 shows just how unusual this prediction is.
I've explained the reasons for this anomaly over the past month. After the appearance of highly divergent Pirola, we had a ton of new escape mutations that led to a summer wave, infecting most of the susceptable populations. Evolution shut off suddenly after, with only...