1) 5-yr Anniversary of the WHO Pandemic Declaration
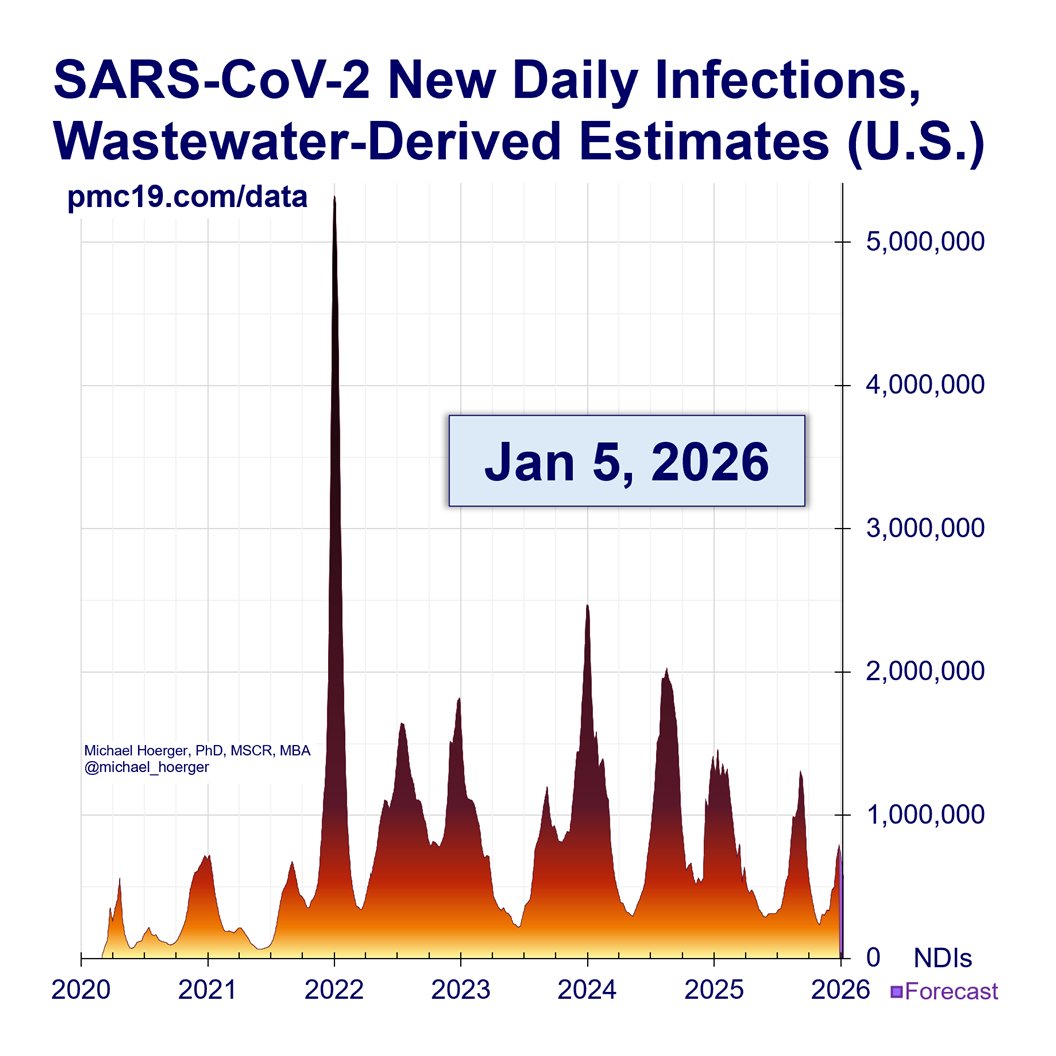
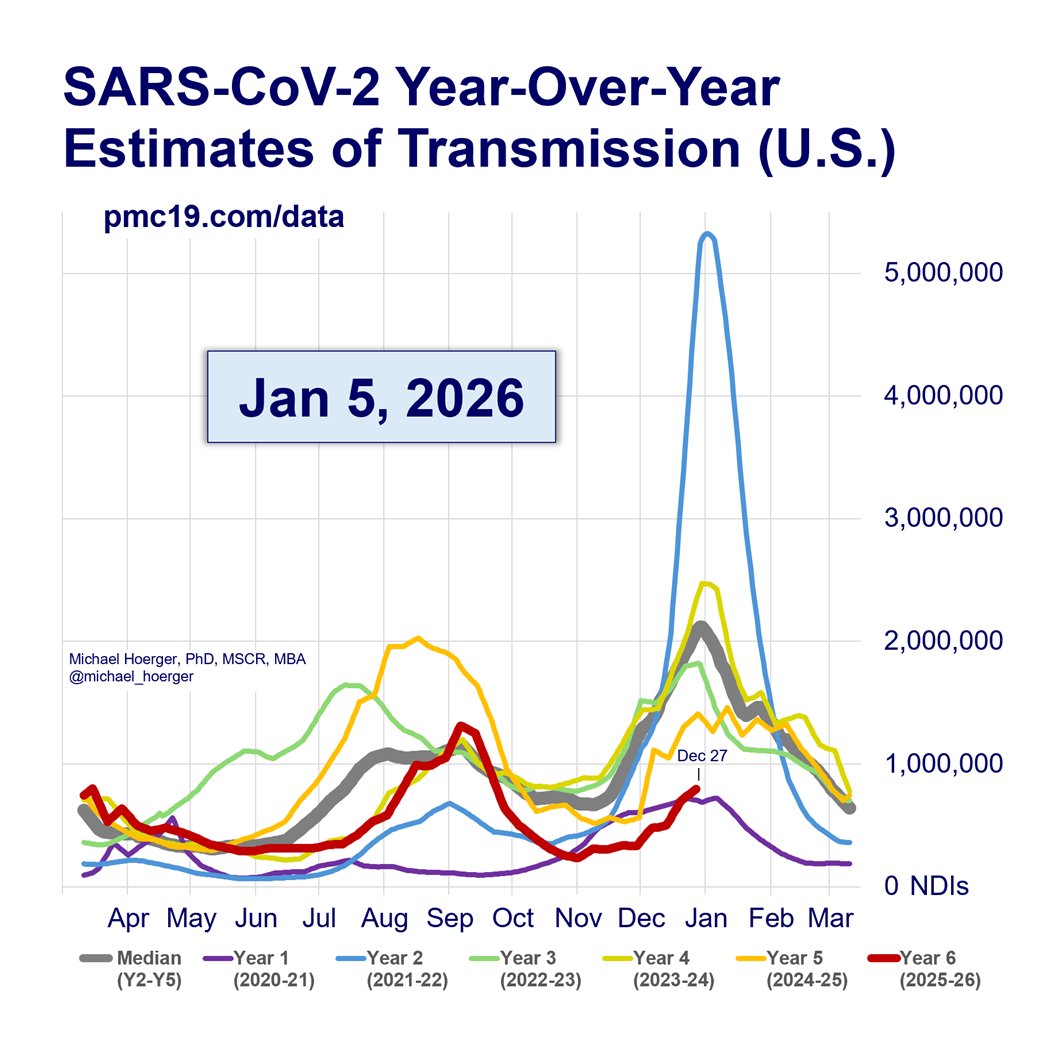
🔥10 waves
🔥Covid mortality rivals lung cancer
🔥8 infections/person by 2030
🔥Long Covid as catastrophic
🔥Death trajectories becoming complex
🔥"During Covid" as anti-science rhetoric
🔥Serious ppl take Covid seriously
🧵
🔥10 waves
🔥Covid mortality rivals lung cancer
🔥8 infections/person by 2030
🔥Long Covid as catastrophic
🔥Death trajectories becoming complex
🔥"During Covid" as anti-science rhetoric
🔥Serious ppl take Covid seriously
🧵
3) The ratio of reported cases versus true cases has remained consistent, demonstrating the validity of wastewater-derived estimates. 

4) Misinformation is based on cognitive biases that steer people toward easy-but-bad data or lead them to overestimate their skills.
Disinformation can be blatant or grounded in specious pseudo-scientific arguments. Financial COIs are often the cause.
Disinformation can be blatant or grounded in specious pseudo-scientific arguments. Financial COIs are often the cause.

5) Contrary to misinformation and disinformation, wastewater-derived estimates have a long history of publication on top scientific journals 

6) The NYTimes shows that Covid continues to cause excess deaths, meaning it is killing hundreds of thousands of Americans in 2025.
Their estimates are overly simplistic but make the correct argument. See next few.
Their estimates are overly simplistic but make the correct argument. See next few.

7) More complex analyses of Covid excess deaths remain much too simplistic and often underestimate current Covid deaths. They do not account for "mortality displacement" -- the idea that so many have already died, we should be seeing fewer deaths by now. We're not. 

8) Actuaries measure excess death correctly (or still slightly underestimate). They find Covid deaths are on par with lung cancer in 2025. 

9) The sources of Covid excess deaths are increasingly understood and paint a more pessimistic long-term trajectory, as demonstrated by (multi-systemic) non-respiratory deaths. 

10) The past and ongoing consequences of Covid will be marked by health disparities. Race, ethnicity, socioeconomic status, immigration status, LGBTQ. 

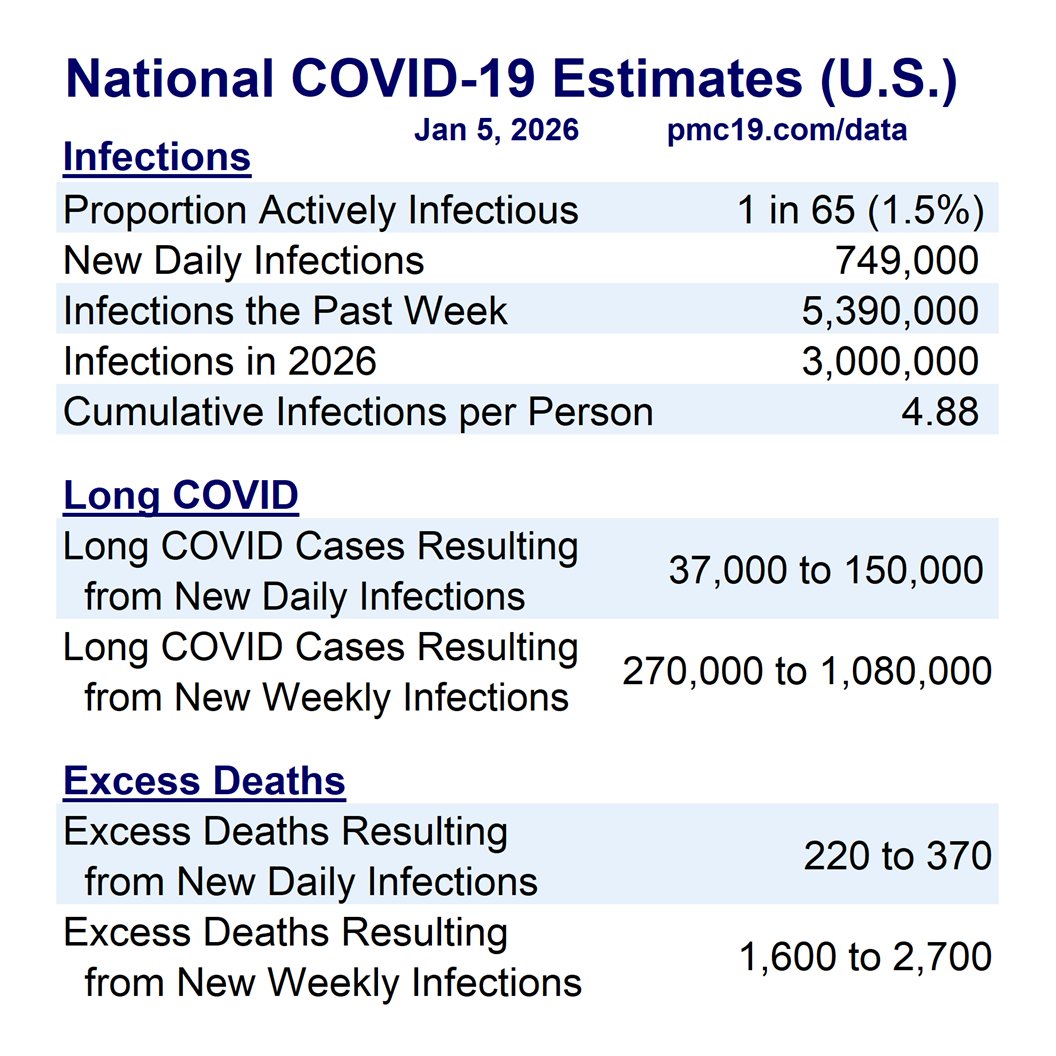
11) We are headed from nearly 4 Covid infections on average to 8 cumulative infections over the next 5 years if current trends hold. The Long Covid burden will be substantial.
Mitigating risk using multi-layered mitigation, like during the early pandemic, helps greatly.
Mitigating risk using multi-layered mitigation, like during the early pandemic, helps greatly.

12) Nearly 5 million American adults have become disabled during the pandemic, with an ongoing linear trend because cumulative infections remain an ongoing burden.
We're doing almost nothing as a society to reduce infections.
We're doing almost nothing as a society to reduce infections.

13) Children continue to become sick more frequently and more severely, with an increasing proportion missing multiple weeks of school.
So-called "lockdowns" don't case this. An annual Covid infection is the likely culprit.
So-called "lockdowns" don't case this. An annual Covid infection is the likely culprit.

14) Younger adults are becoming disabled by Covid, though often still working. Women are particularly burdened. 

15) Though at a slower clip, male workers <65 years old are also becoming disabled by Covid.
>1 million female workers <65 have become disabled during the pandemic
>1 million female workers <65 have become disabled during the pandemic

16) Older adults are dropping out of the workforce. 2.0-2.7 million so far, so-called "excess retirements" 

17) Covid deaths are less and less about acute deaths and more and more about complex non-acute death trajectories. 

22) "During Covid" is anti-science offensive nonsense.
We don't say during car accidents, during lung cancer, or during diabetes to describe the onset or any time point of these public health problems.
We don't say during car accidents, during lung cancer, or during diabetes to describe the onset or any time point of these public health problems.

23) Many people are "high risk," simply based on known evidence, albeit imperfect. Many more are high risk based on unknown or undiagnosed factors. Most should assume a high risk family member or that high risk themselves. 

24) NIH has required universal masking in 48 clinical centers for >4 months because they lead on healthcare. 

25) Over 75% of PMC Covid Dashboard viewers note using 4 layers of mitigation (masks, vax, tests, air quality) in the past 6 months. 95% use at least 3 out of 4 layers. 

• • •
Missing some Tweet in this thread? You can try to
force a refresh


