A user on @Uniswap v3 was just sandwiched attacked out of $216k while simply trying to swap $221k USDC to USDT.
Mind you, this was a pool that had over $35m of USDC and USDT it.
This is insane.
How did it happen?
An MEV bot front-ran the tx by swapping all the USDC liquidity out.
After the transaction executed, they put back the liquidity.
The attacker tipped a block builder (bobTheBuilder) $200k and profited $8k from this transaction.
-----
A few ways to try to avoid this:
1. Reduce slippage tolerance on transactions
2. Don't use Uniswap. Use cowswap or another aggregator - which can provide better execution + prevent this malicious MEV
3. Use a custom RPC that doesn't expose your transactions publicly
-----
What is Uniswap's responsibility here?
We can't live in a world where a user executes a simple swap of $221k in a liquid stablecoin pool and gets rugged.
----
P.S. data team @the_defi_report is cooking. Going deep on MEV to share the economics of various chains from the ground up.
Might not be pretty.
If you want to stay on top of all the insights we're sharing, you can sign up below 👇
@Uniswap If you'd like to have our latest data & research hit your inbox when it's published, sign up here: thedefireport.io/subscribe
Appreciate all the comments. Looks like the tx did not come from Uniswap's front-end, which has MEV protection and default slippage settings.
Looks like this might be money laundering? But what doesn't make sense is that the attacker (or money launderer) paid $200k as a bribe for tx inclusion. Why would you do that instead of using a mixer?
• • •
Missing some Tweet in this thread? You can try to
force a refresh
But have we truly grasped the *economic* ripples that every proposal sets in motion?
Each pivot, upgrade, and idea impacts more than just the blockchain itself.
It shapes the experiences, challenges, and fortunes of:
1. Developers 2. Users 3. Validators 4. Service Providers 5. And Investors
That’s why I created a dashboard on @tokenterminal breaking it all down.
Past. Present. And Future.
A 🧵with some insights from the dashboard + a link at the end for those looking to go deeper 👇
Starting with EIP1559 in August of '21:
$12.4b has been “burned” or bought back since it’s implementation.
1/7
Shifting to ETH 2.0 and the move to Proof of Stake in Sept. '22:
Annual issuance dropped 88% overnight.
Impact on Validators:
1. Now compensated with tips from users (fees paid in excess of the base fee for block inclusion) + new issuance.
2. Compensation from new issuance was reduced by 88% overnight (from roughly 13.5k ETH/day to 1.7k ETH/day).
3. Overhead costs (energy) reduced by 99.9%.
4. Compensation from fees + new issuance is now determined by the validator's portion of ETH staked pro-rata to the amount of ETH staked on the network.
[see dashboard for impact on ETH holders]
2/7
Moving on to The Shapella Upgrade (staking withdrawals) in April of '23:
Validators increased 58% in the first 6 months post-Shapella.
Impact:
1. Validators: decrease in yield 2. Tokenholders: drop in yield can impact demand for ETH 3. Network security: more validators = more secure network. 4. Applications: @LidoFinance was the largest beneficiary.
So many bad takes on the timeline regarding Ethereum vs Solana right now.
It's about time we cut through the noise with a data-driven approach.
That's why I created an absolute banger of a dashboard comparing the economics of the two networks across:
1. Go-To-Market Strategy 2. Value Accrual 3. Total Economic Value 4. Cost to Produce $1 Fee Revenue 5. Network Fundamentals 6. Performance & Valuation
It's both quantitative and qualitative.
A quick 🧵with some takeaways + a link to the dashboard via @tokenterminal at the end 👇
Takeaway #1: It's now about 50% cheaper to transact on Arbitrum than Solana. In fact, it's cheaper to transact on half of the top L2s.
1/7
Shifting to Total Network Fees:
Takeaways:
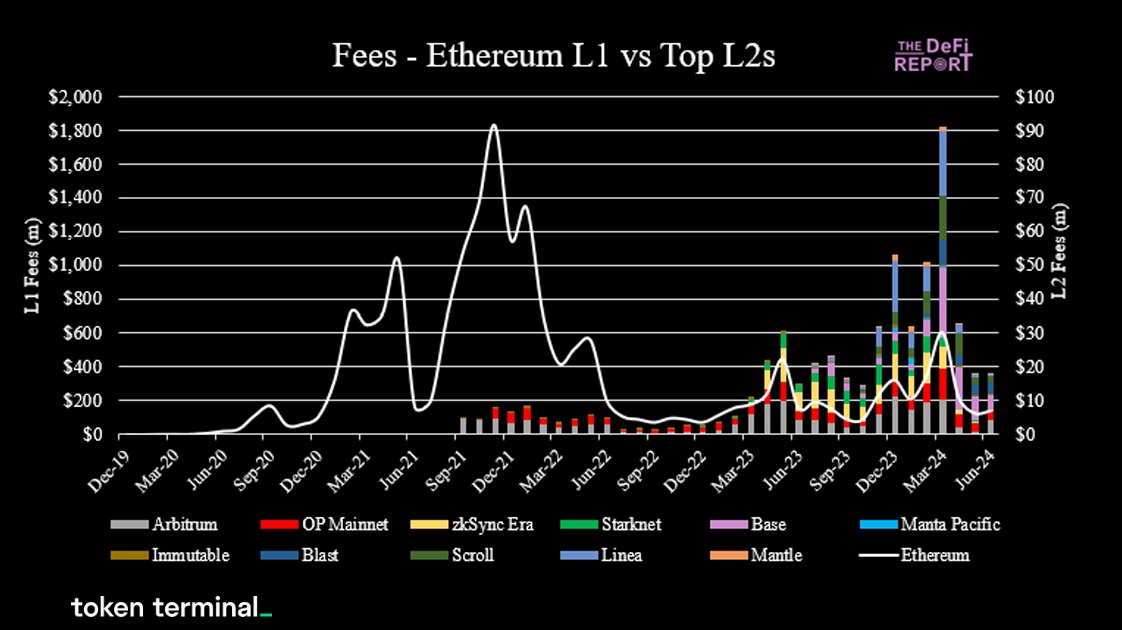
1. Ethereum + the top L2s have done nearly $20b in all-time fees
2. 97.5% has come from the L1 ($479m from the top L2s)
3. Solana has produced $495m in all-time fees, with 87% of that coming this year.
4. The trend is the friend of Solana, which has produced 41% of Ethereum's top-line network fees over the last 90 days (not including MEV)
5. Why am I including L2s? Because they create demand for ETH + settle transactions down to the L1. We'll stop including them if those two economic ties are severed.
2/7
Next is Protocol Revenue (burned tokens, which accrue value to non-stakers):
Takeaways:
1. 64% of Ethereum's all-time transaction fees ($12.4b) have been burned, accruing value to ETH tokenholders.
2. 50% of Solana's all-time transaction fees ($247m) have been burned (2% of Ethereum).
3. L2s have no value accrual mechanism for tokenholders today.
. @Uniswap did 81% of @coinbase trading volume in Q2.
It did 65% of @RobinhoodApp's volume.
Meanwhile, Uniswap has just 3% of Coinbase's workforce and 4% of Robinhoods.
A 🧵on @Uniswap's market share within crypto across 6 different KPIs using @tokenterminal new dashboard feature.
___
Starting with Fees - Uniswap currently controls a 55% market share. Notably, the protocol generated $45m for Uniswap Labs via it's interface fee over the last 6 months.
That's 9% of what was paid to Uniswap LPs ($503m) over the same period.
*please note all data excludes Solana DEXs (coming soon)
1/7
In terms of active users, @Uniswap currently has a 60% market share — twice as high as one year ago.
Uniswap had over 9 million active users in August. For reference, Coinbase has 8 million monthly active users. Robinhood has 13.7m.
Data: @tokenterminal
2/7
In terms of trading volume, Uniswap currently has a 42% market share across crypto DEXs (excludes Solana)
In August the DEX did $52b (down from $90b in March).
Again, Uniswap did 81% of Coinbase's volume in Q2 and 65% of Robinhood's volume.
Every qtr I spend a week writing The Ethereum Investment Framework while combing through hundreds of KPIs throughout the Ethereum Ecosystem.
10 insights from the Q1 update which was published yesterday.
Shout out to @artemis__xyz for supplying the data.
A 🧵
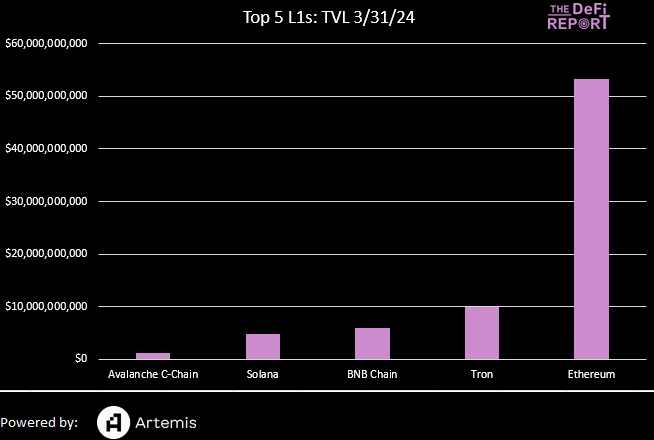
Newer blockchains may be stealing some mind share from Ethereum, but in terms of where the value still sits, the King still rules:
- 5x higher TVL than the second-largest L1
- 10x higher TVL than #3
As of 3.31, Ethereum has over 118 million non-zero wallet addresses, a KPI that has been growing at a compound annual rate of 40% since 2018. At 3.31, Ethereum has over 2.3x more non-zero wallets than the Bitcoin network.