One fact about the global economy should not be subject to debate any more -- the US is more than meeting global demand for reserve assets (a significant change from 2002 to 2014 ... )
1/ many
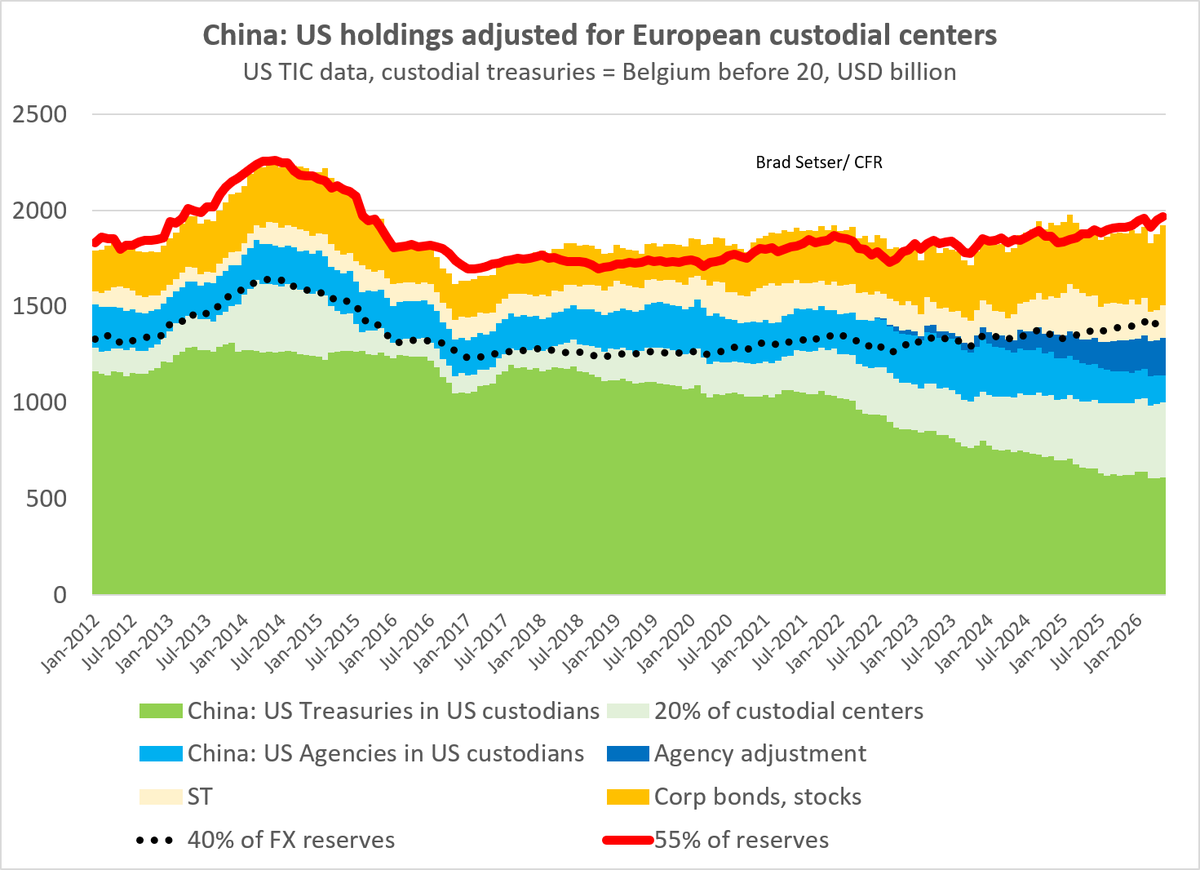
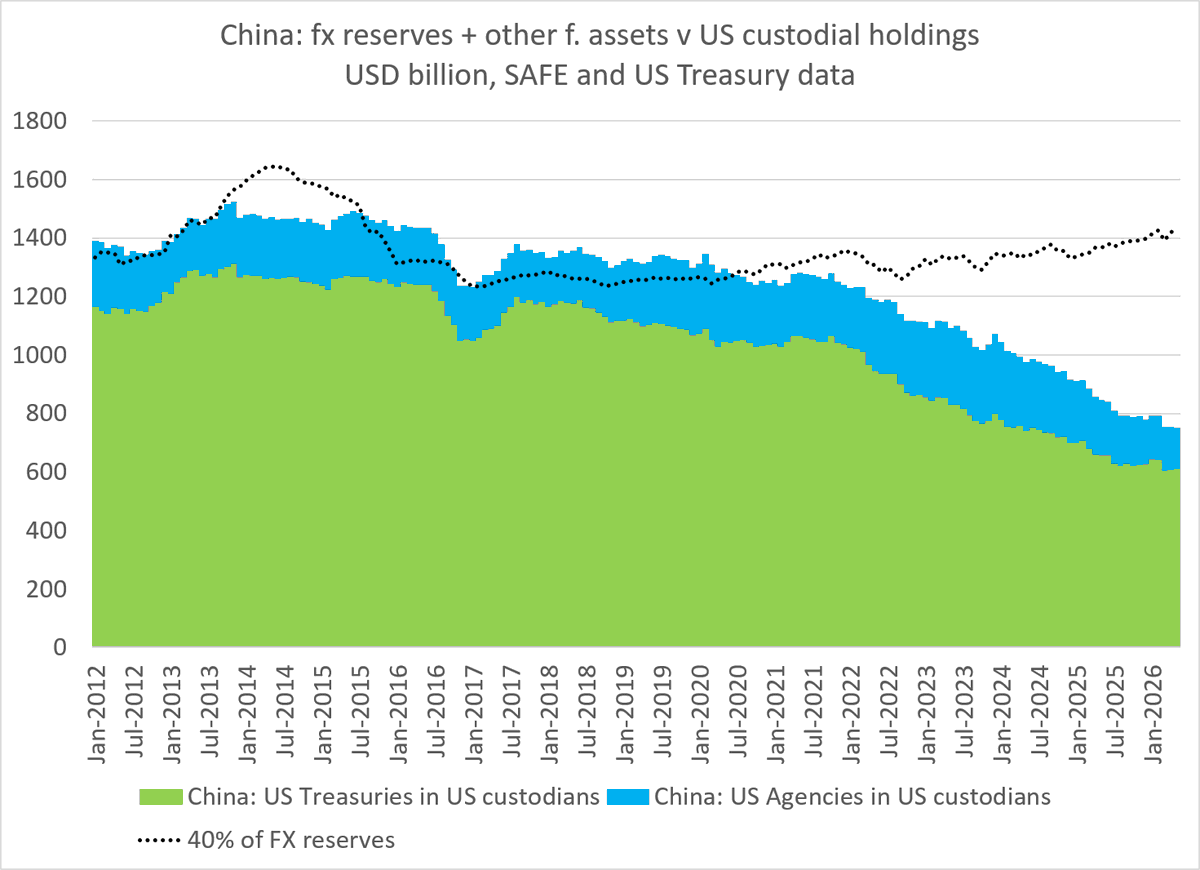
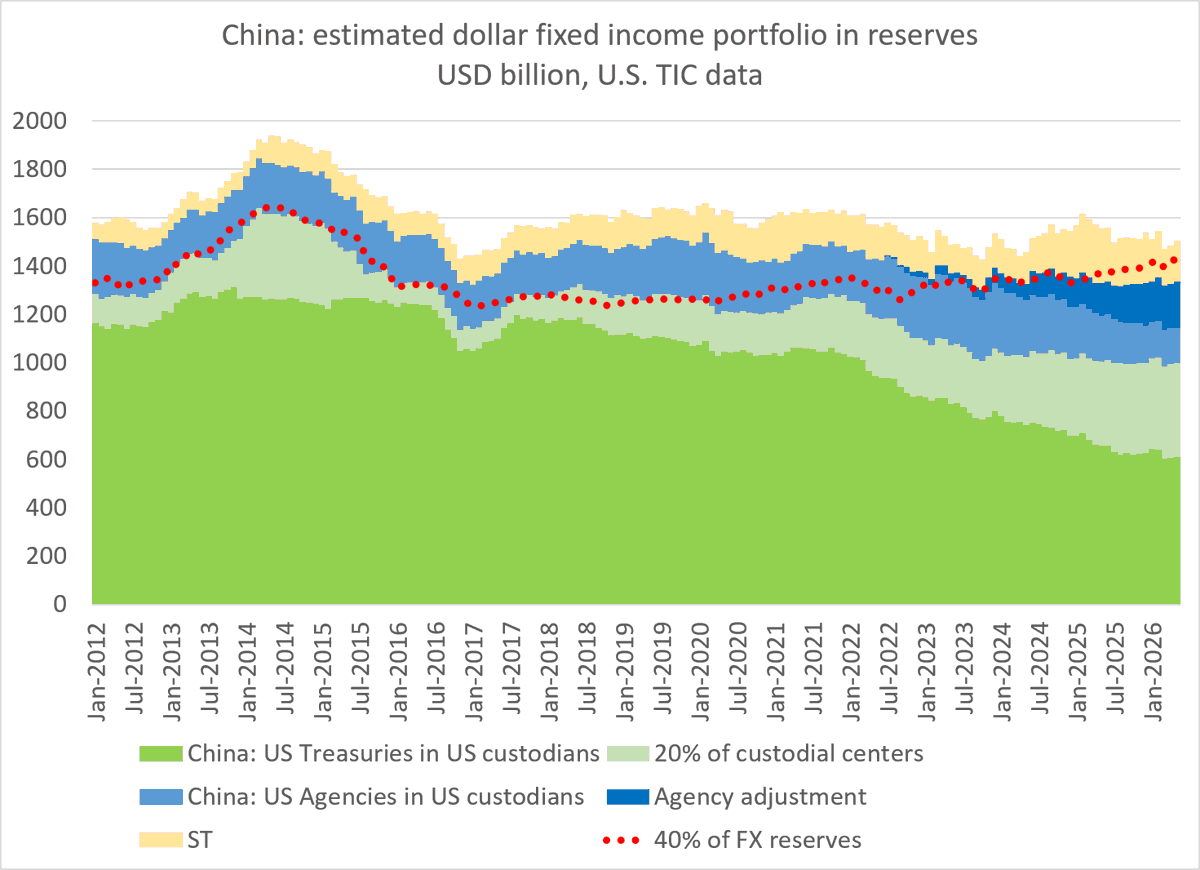
And since China has had a policy of limiting its Treasury holdings (and shifting fx reserves over to the SCBs and policy banks) since around 2010, China's share of the Treasury market has shrunk radically ...
2/
The split is imprecise (Treasuries held by central banks in offshore custodians count as "private") but there is no real doubt that the role of official investors in the market has shrunk -- and there has been a big increase in private US holdings ...
3/
The stock in private domestic hands still is absolutely huge (it is around 50% of GDP) but it is up ~ 20 pp of GDP compared to the pre-COVID era, and a lot of that increase has been funded by US money market funds, either directly or indirectly (via repo)
4/
These structural shifts help explain why the Treasury issued a lot of bills in 2022 and 2023 -- that was where the demand was ...
Note issuance actually picked up significantly over the course of 2024 ...
5/
Note issuance is now running at just under 5% of US GDP -- a level consistent with a stable bill share if the fiscal deficit is around 6% of GDP. Counting QT, the market absorbed note supply equal to the fiscal deficit last year ...
6/
Foreign demand for notes has been stable at around 1.5 pp of GDP/ $450b -- a decent number absolutely and relative to history, but modest v total supply.
7/
Increased note (coupon paying Treasuries, bills are sold at a discount to pay) issuance has been facilitated by gigantic fall off in mortgage issuance (Fed tightening clearly impacted the secondary market in housing)
8/
And shifting from the flow of funds data to the Bertaut Judson monthly flow data, the bulk of foreign demand for Treasury coupons does look to be from true private holders. b/c China shifted to bills at the margins, my estimates imply its note holdings fell modestly in 2024
9/
Bottom line -- the increase in the stock of Treasuries in the market since the start of the pandemic has largely been absorbed domestically ... a point that is well known among actual market participants (who like to point that there are more price sensitive buyers)
10/
& absent a very elastic definition of reserve demand that includes private holdings abroad, it no longer is really accurate to say the US external deficit reflects excess global demand for reserve assets. That was the case imo from 03 to 13 -- but the world has changed
/end
• • •
Missing some Tweet in this thread? You can try to
force a refresh
A few words on Japan's balance of payments, which confuse many (including, at times, my friends at the IMF) --
Japan now runs a large current account surplus (more than China) of 5% of GPD even with a 1% of GDP trade deficit
1/
The reason, of course, is that Japan now runs a massive surplus in its investment income account (something the IMF with its obsession on fiscal debt tends to overlook). A weak yen of course inflates foreign earnings, and rising global rates
2/
Japan's financial account also tends to confuse: Japan is a massive global creditor of course, with a large gross stock of fixed income assets. But the net outflows that match the current account surplus have mostly come from FDI (and fx reserves)--
A very DC joke back in 2012 was that the IMF should be renamed the European Monetary Fund. It certainly should now be called the Argentine monetary fund.
Lending to Argentina now far exceeds the funds lending to the rest of the world after COVID
1/
Measures of balance sheet concentration should be viewed with a grain of salt as the IMF has a lot of unused financial firepower these days -- but $50b plus is a lot of exposure to a single country even for the Fund.
2/
There is a sense among many that Argentina should be rewarded for its 2024 fiscal adjustment. But fiscal metrics aren't the only measure of adjustment (hint, @IMFNews). Milei's record on external adjustment is, well, not great
A lot of the analysis of China's trade exposure to the US has been unsatisfying (at least to me) as looks exclusively or primarily at the bilateral trade flows.
A broader perspective is needed.
1/
Looking at the bilateral flows first raises a basic issue -- whether to use the US import data ($440b, somewhat over 2 pp of China's GDP) or the Chinese export data ($530b, somewhat under 3 pp of China's GDP).
2/
The answer here is clearly the Chinese data, as the US data misses Shein and Temu (de minimis) and clearly changed relative to the Chinese data as a result of tariff avoidance. Same is true of the bilateral surplus data.
China hasn't been adding in scale for a long time, but if the euroclear custodial account is included, Chinese holdings of all Treasuries rose a bit recently -- but their holdings are increasingly short-term.
A better chart than the BoA chart -- straight from the US balance of payments but with the "Belgium/ euroclear" adjustment. LT bonds includes Agencies. No significant net purchases and sales in the US data since 2016
2/
The highest frequency data available: the Bertaut Judson valuation adjusted flow data. Chinese sales -- assuming China still accounts for a large share of the flow though custodial centers -- actually dried up in late 2024/ early 25 (there were sales in 23/ early 24)
Amid all the debate about trade and the dollar's global role, one facet of the United States international economic position hasn't gotten enough attention -- the traditional US surplus in investment income has disappeared
1/
Net interest payments to the rest of the world have gone up because rates have gone up, nothing fancy --
2/
And there are good reasons to think the rise in net interest payments isn't complete (some low yielding long dated bonds will be refinanced at higher rates, short-term rates have come down and that will pull interest receipts down a bit )
The bilateral current account data (which has some problems because a firm like Apple will report its profits from China in "Ireland" given its corporate structure) reports an even more modest total for FDI income accruing back to the US (less than $10b in 2024)
2/
Indeed, in the reported bilateral data, the second largest line item isn't a credit from US firms profits in China -- but the debtit from the interest income China receives on all its holdings of US bonds.