The first empirical evaluation of New York's congestion pricing has just been published.
Spoiler: It worked really, really well🧵
Spoiler: It worked really, really well🧵

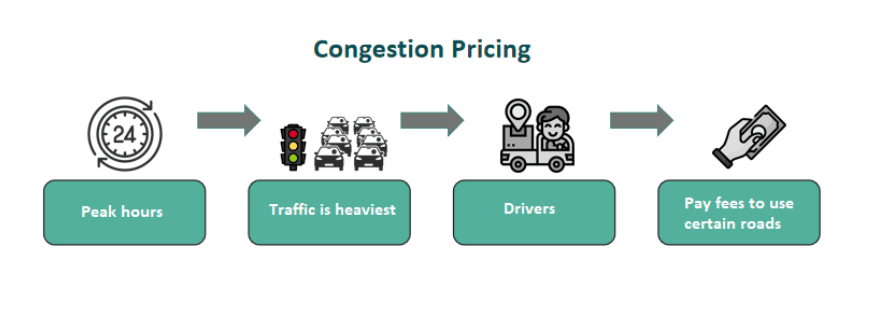
First, what is congestion pricing?
It's an added fee sent to drivers when they drive on certain roads, at certain times, in order to dissuade people from using the road when they don't need to.
The initiative aims to cut down on needless overuse, leading to slow roads.
It's an added fee sent to drivers when they drive on certain roads, at certain times, in order to dissuade people from using the road when they don't need to.
The initiative aims to cut down on needless overuse, leading to slow roads.
Congestion pricing, in New York, acts as a sort of redistribution:
Because people pay to get into Manhattan, fewer go in, and the payments that would go to paid parking lot owners are effectively redistributed to the city government.
Congestion pricing can improve land use!
Because people pay to get into Manhattan, fewer go in, and the payments that would go to paid parking lot owners are effectively redistributed to the city government.
Congestion pricing can improve land use!

Congestion pricing should also increase the use of public transit, like the subway and buses and such.
This also helps with the redistribution from inefficient land users in Manhattan to the city government, and it's fine because transit has lots of excess capacity.
This also helps with the redistribution from inefficient land users in Manhattan to the city government, and it's fine because transit has lots of excess capacity.
The way congestion pricing was evaluated was by using a "synthetic control".
The data from NYC was compared to the data from a counterfactual NYC based on data from other, comparable cities.
The estimate is New York (real) vs New York (projected without congestion pricing).
The data from NYC was compared to the data from a counterfactual NYC based on data from other, comparable cities.
The estimate is New York (real) vs New York (projected without congestion pricing).
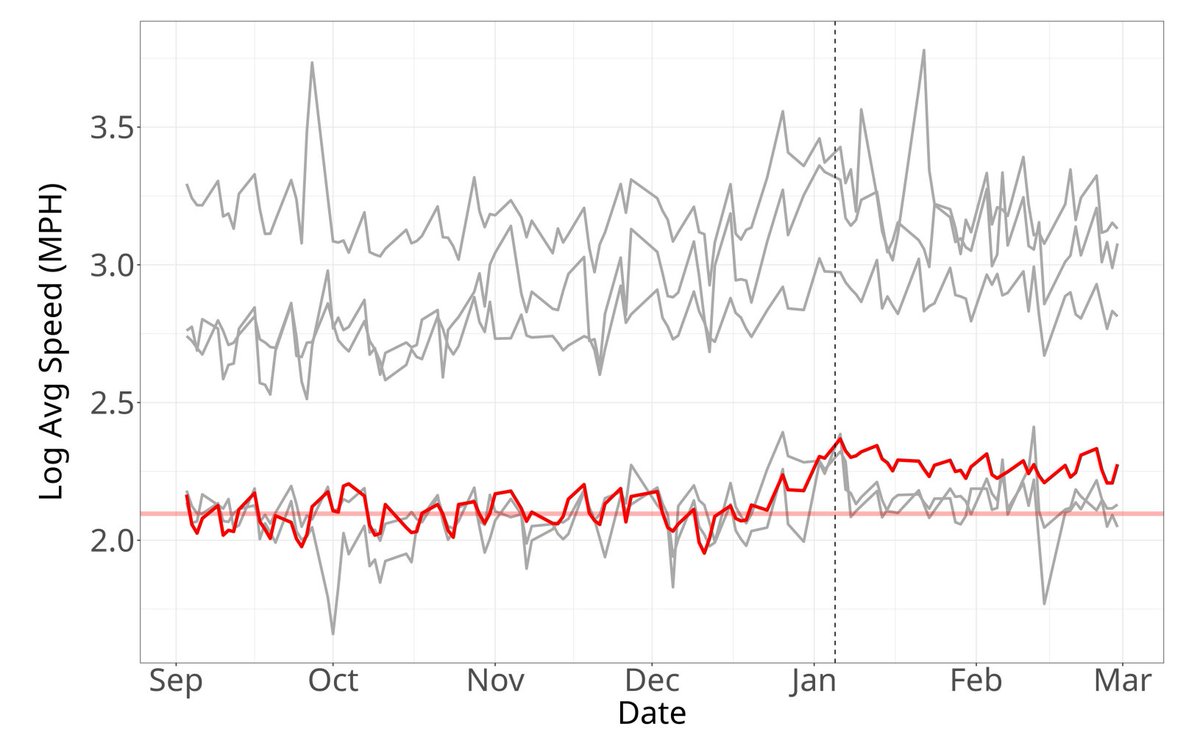
Some of the data underlying this model looks like this.
In this example, we can see average daily speeds within New York's Central Business District (CBD) in red and in comparison cities in gray.
Notice the jump around congestion pricing being introduced?
In this example, we can see average daily speeds within New York's Central Business District (CBD) in red and in comparison cities in gray.
Notice the jump around congestion pricing being introduced?
With that data, we can compare real New York to the ensembled New York and get this result, our treatment effect of interest.
On average, road speeds went up by a whopping 16%!
On average, road speeds went up by a whopping 16%!
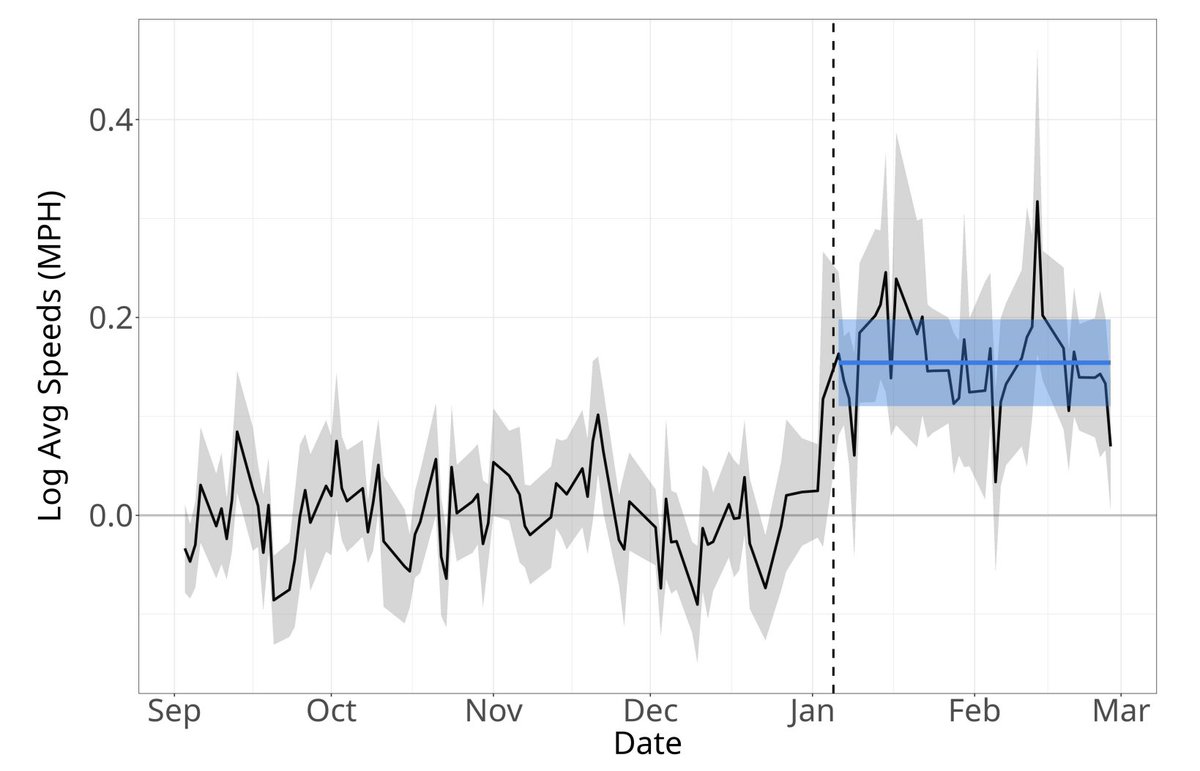
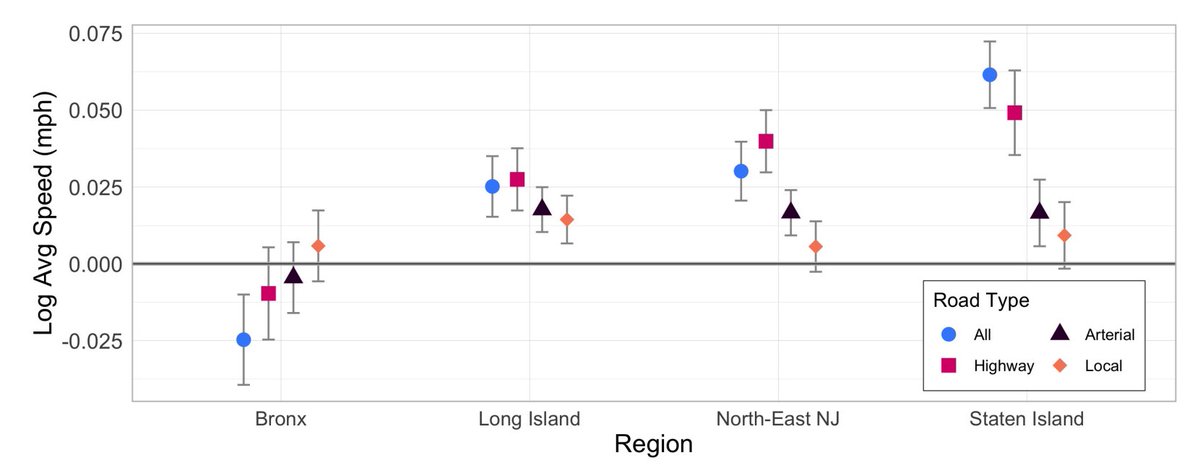
But here's something interesting:
Speeds on highways went up 13%, arterial road speeds went up by 10%, and local road speeds increased by 8%.
None of that's 16%, and that's important: This means congestion pricing sped roads up, but also sorted people to faster roads.
Speeds on highways went up 13%, arterial road speeds went up by 10%, and local road speeds increased by 8%.
None of that's 16%, and that's important: This means congestion pricing sped roads up, but also sorted people to faster roads.

In response to having to pay a toll, people not only got off the road, they also made wiser choices about the types of roads they used!
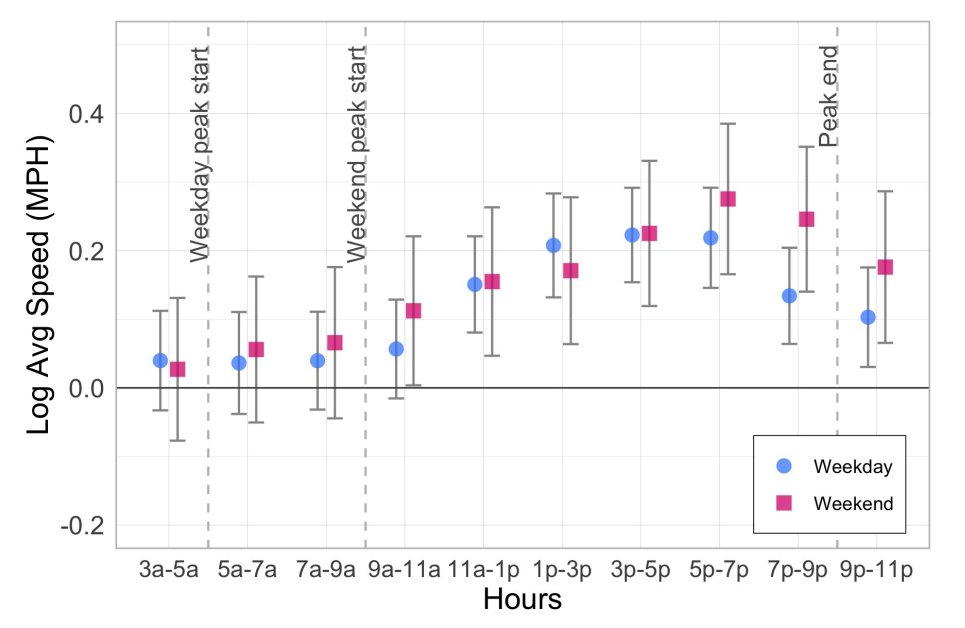
Now let's look at the times of day, as a check on the model
It works: Congestion pricing just boosts speed when it's active and shortly after:
Now let's look at the times of day, as a check on the model
It works: Congestion pricing just boosts speed when it's active and shortly after:
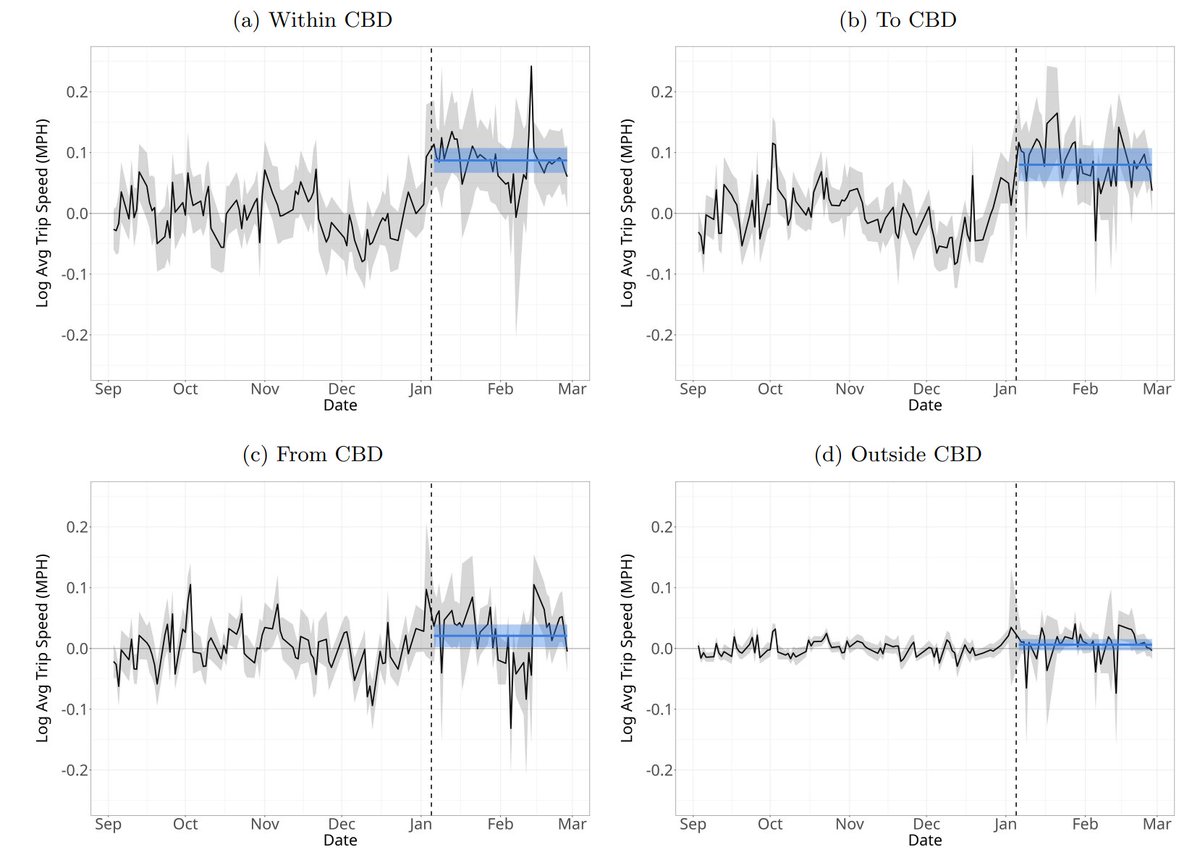
As another check, let's look at the effects by location.
In the CBD, trips are faster. Going to the CBD, trips are faster. Leaving it, trips are faster, but not much. And outside of it, where congestion pricing is irrelevant? No effect.
In the CBD, trips are faster. Going to the CBD, trips are faster. Leaving it, trips are faster, but not much. And outside of it, where congestion pricing is irrelevant? No effect.
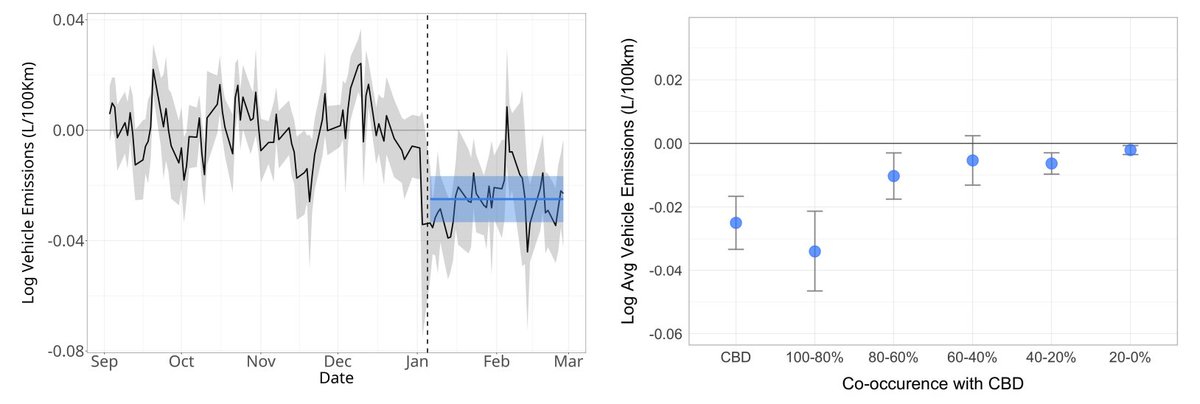
This policy has economic benefits and incentive benefits, but it also helps residents of New York who aren't directly paying the fee.
This is because vehicle emissions are down!
They're down the most in the areas with the highest rate exposure (co-occurrence), too.
This is because vehicle emissions are down!
They're down the most in the areas with the highest rate exposure (co-occurrence), too.
The policy is also fair: The impacts do not fall on particularly low- or high-class neighborhoods, and the distributional impacts are thus pretty much neutral, with some regional differences.
The big effect is really just that people are able to get into the city more reliably.
The big effect is really just that people are able to get into the city more reliably.
In short, congestion pricing, though only briefly in place, has been a rousing success.
But New Yorkers don't seem to mind if the policy goes. They seem to prefer being able to freely waste time in traffic, even though it's inefficient and boring.
But New Yorkers don't seem to mind if the policy goes. They seem to prefer being able to freely waste time in traffic, even though it's inefficient and boring.
https://x.com/cremieuxrecueil/status/1894439227946934621
Convincing the public to care about this policy and support it will be key to its future re-implementation, not just in New York, but nationally
Getting people to understand that a small fee actually improves how cities operate and aligns incentives is going to be a big project.
Getting people to understand that a small fee actually improves how cities operate and aligns incentives is going to be a big project.
As an added note, subway ridership was increasing and, more interestingly, with congestion pricing, more people were choosing to take the express service buses.
Because of the reduced traffic, those buses were also making their trips much faster.
Wins everywhere!
Because of the reduced traffic, those buses were also making their trips much faster.
Wins everywhere!
Another interesting set of datapoints:
1. Foot traffic went up. That's the type that's relevant for businesses.
2. Broadway ticket sales? Also up.
3. Honking complaints? Went down by two-thirds.
Every sign points to benefits.
1. Foot traffic went up. That's the type that's relevant for businesses.
2. Broadway ticket sales? Also up.
3. Honking complaints? Went down by two-thirds.
Every sign points to benefits.

And I think signs should generally point to benefits, because I believe New Yorkers are smart enough to adjust in response to a little toll.
Some links:
bloomberg.com/news/articles/…
amny.com/news/broadway-…
nyc.streetsblog.org/2025/02/05/win…
thecity.nyc/2025/03/11/tra…
Some links:
bloomberg.com/news/articles/…
amny.com/news/broadway-…
nyc.streetsblog.org/2025/02/05/win…
thecity.nyc/2025/03/11/tra…
• • •
Missing some Tweet in this thread? You can try to
force a refresh