Quant Science Profile picture
Mar 22 8 tweets 3 min read Read on X
According to Ray Dalio, the easiest way to adjust for risk is to seek uncorrelated returns.

Ray's made billions from a simple idea.

Here's how to do it in a few lines of Python code: Image
Step 1: Collect Stock Data

Run this code to download free stock price data from Yahoo Finance. Image
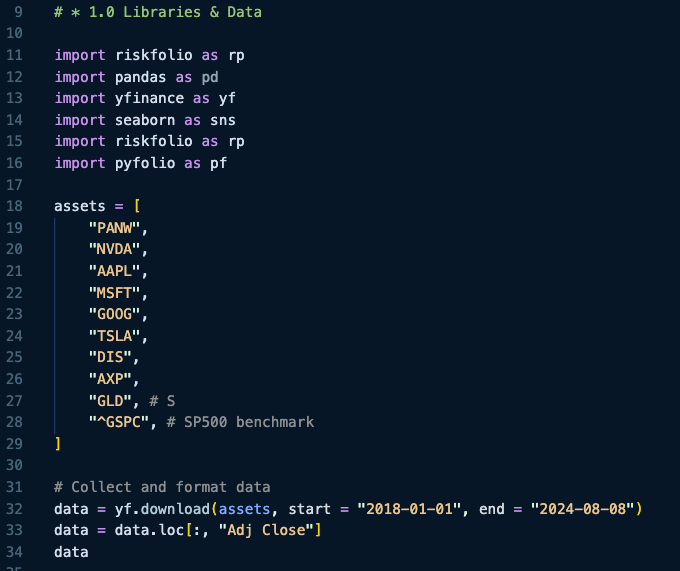
Step 2: Convert Prices to Returns

Using pandas code, we can get returns (just run this code): Image
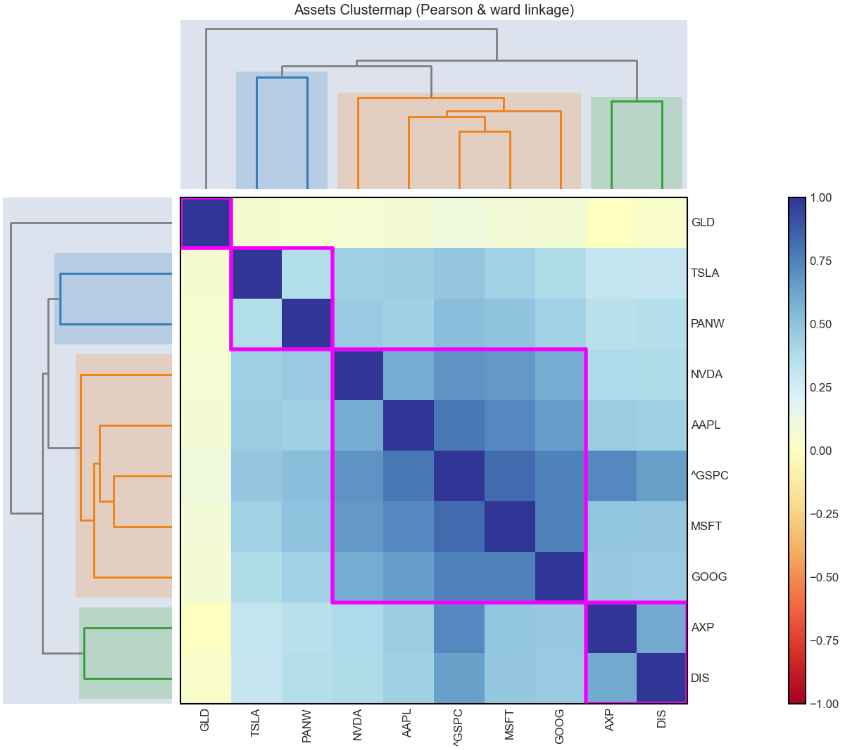
Step 3: Use Riskfolio's Plot Clusters

This function takes our returns and creates a hierarchical dendrogram based on Pearson correlation of the stock returns. Image
Step 4: Analyze the plot

Select Stocks from different buckets that exhibit lower correlation to others in your portfolio.

Example:

GLD, TSLA, NVDA, AXP would be less correlated than AAPL, MSFT, NVDA, GOOG. Image
Step 5: Become a Quant Scientist

Once you realize that trading with algorithms gives you an edge, the next step is to learn how to exploit that edge.

We want to help.
On March 26th, we are hosting a free workshop to help you get started with algorithmic trading with Python.

Register here (500 seats): learn.quantscience.io/qs-registerImage
That's a wrap! Over the next 24 days, I'm sharing my top 24 algorithmic trading concepts to help you get started.

If you enjoyed this thread:

1. Follow me @quantscience_ for more of these
2. RT the tweet below to share this thread with your audience

• • •

Missing some Tweet in this thread? You can try to force a refresh
 

Keep Current with Quant Science

Quant Science Profile picture

Stay in touch and get notified when new unrolls are available from this author!

Read all threads

This Thread may be Removed Anytime!

PDF

Twitter may remove this content at anytime! Save it as PDF for later use!

Try unrolling a thread yourself!

how to unroll video
  1. Follow @ThreadReaderApp to mention us!

  2. From a Twitter thread mention us with a keyword "unroll"
@threadreaderapp unroll

Practice here first or read more on our help page!

More from @quantscience_

Mar 23
How to create your own "mini" hedge fund with algorithmic trading and Python

A thread 🧵 Image
1. What is a Hedge Fund

Hedge funds pool money from wealthy individuals or institutions to seek higher, risk-adjusted returns across multiple markets.
While they often strive to outperform benchmarks like the S&P 500, the focus is usually on lowering risk (drawdowns) rather than purely maximizing returns.
Read 16 tweets
Mar 23
This guy made an AI Hedge Fund...

Then open-sourced it for everyone to use.

This is the story. Image
His name is @virattt and he's doing something amazing.

He's built an AI hedge fund that has:

1. Market Data Analyst
2. Sentiment Analyst
3. Fundamentals Analyst
4. Quant Analyst
5. Risk Manager
6. Portfolio Manager
@virattt The AI Hedge Fund uses LLM agents to make Buy, Sell, and Hold actions from each AI Agent's signals. Image
Read 7 tweets
Mar 22
Top 15 Algorithmic Trading Strategies (and how they work) 🧵 Image
1. Pairs Trading

Trades two correlated instruments simultaneously. It goes long on one asset and short on the other to profit from deviations from their historical relationship, expecting the correlation to eventually resume.
2. Scalping

Involves making numerous small trades to capture minimal price differences over a short time. For example, tape reading is used to analyze order flow and timing, enabling scalpers to profit from very brief price fluctuations.
Read 19 tweets
Mar 20
Stock Prediction AI: Using Machine Learning and Deep Learning to predict stock price movements in Python.

The Python code is 100% free on GitHub.

Let's dive in (bookmark this): Image
1. The Python Machine Learning and Deep Learning Libraries:

- mxnet
- gluon
- sklearn
- xgboost Image
2. Stock Price Data (Train/Test)

The dashed vertical line represents the separation between training and test data.

GS is shown but will use 72 assets.

Daily prices for each asset. Image
Read 13 tweets
Mar 17
Time Series Momentum.

A 23-page PDF.

Here are the best parts: Image
Time series momentum (page 6)

Regression analysis and trading strategies. Image
t-statistic by asset class (page 7) Image
Read 9 tweets
Mar 17
How to make a simple algorithmic trading strategy with a 472% return using Python.

A thread. 🧵 Image
This strategy takes advantage of "flow effects", which is how certain points in time influence the value of an asset.

This strategy uses a simple temporal shift to determine when trades should exit relative to their entry for monthly boundary conditions. Image
The signals for when to go short, when to cover shorts, when to go long, and when to close longs are all linked to these recurring monthly cycles.

This periodic "flow" of signals—month-in, month-out—creates a systematic pattern. Image
Read 10 tweets

Did Thread Reader help you today?

Support us! We are indie developers!


This site is made by just two indie developers on a laptop doing marketing, support and development! Read more about the story.

Become a Premium Member ($3/month or $30/year) and get exclusive features!

Become Premium

Don't want to be a Premium member but still want to support us?

Make a small donation by buying us coffee ($5) or help with server cost ($10)

Donate via Paypal

Or Donate anonymously using crypto!

Ethereum

0xfe58350B80634f60Fa6Dc149a72b4DFbc17D341E copy

Bitcoin

3ATGMxNzCUFzxpMCHL5sWSt4DVtS8UqXpi copy

Thank you for your support!

Follow Us!

:(